| |
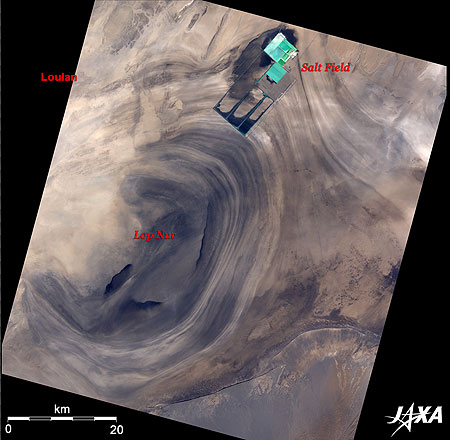 |
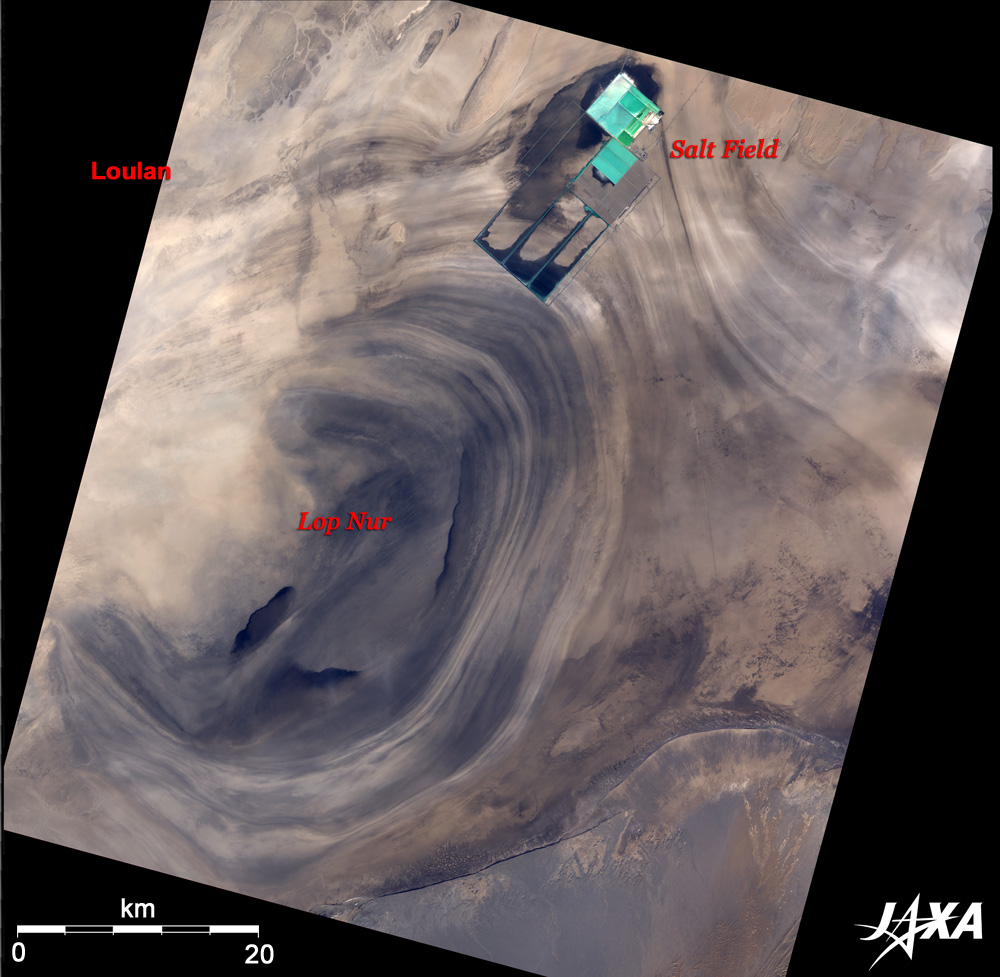
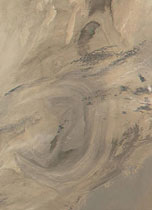
Fig. 1 Lop Nur
Lop Nur (kmz,912KB,Low Resolution) is seen from Google Earth. |
Figure 1 depicts Lake Lop Nur located in the Xinjiang Uygur Autonomous Region of China, on the eastern side of the Tarim Basin, which includes the Taklamakan desert, as observed by the Advanced Visible and Near Infrared Radiometer-2 (AVNIR-2) on board the Advanced Land Observing Satellite (ALOS) Daichi in January 2006. The lake is now dry, but it was formerly a 50km-square big lake on the desert. The black area is the trace of the dried lake. The trace of the dried lake resembles a giant ear of the Earth and is visible from space.
Lop Nur means Lake Lop in Mongolian and was the dream of many explorers in the late 19th century. Everyone knew there was a big lake, but no-one knew where it was. The location of Loulan, an old oasis town northwest of the lake and a strongpoint of trade on the Silk Road, was also unknown since it vanished in the 6th century after falling into ruin in the middle of the 4th century.
After much controversy and many explorations, the Swedish explorer Sven Hedin happened to find the ruins of Loulan and Lop Nur in the 19th century. There was no water then, but he was able to take a canoe there 34 years later when there was water all over the lake. Lop Nur became well known as Roaming Lake, as it moved between North and South in 1,600-year cycles, as advocated by Sven Hedin. He assumed that a small shift in the ground surface changes the flow path because the vertical difference between the northern and southern shores of Lop Nur is less than 2m. The Tarim River is fed by the melt snow of the Tian Shan mountain range north of the desert and the Kunlun mountain range south of the desert. The lake bottom rises due to sediment in the river, and the desert surface lowers due to erosion of heavy wind. As a result, the heights of the lake bottom and the desert could be inverted, causing the water to flow south toward the lower side. Similarly, when the high winds erode the desert near Loulan, the river may once again flow to the north. In the 4th century, Lop Nur started moving. Prosperous Loulan on the lakeshore (difficult to discriminate in Fig. 1) lost the water necessary for life and was buried in deep sand. Satellite images confirmed that Lop Nur had effectively vanished by 1972. It is assumed that the river was shortened halfway and that the water did not flow into the lake because of evaporation in the Tarim Basin due to climate change, irrigation upstream of the Tarim River, or reduction of melt water of the Tian Shan range and Kunlun range.
A square salt field is visible in the upper part of Fig. 1. It suggests that the river may not flow into Lop Nur any more. Lop Nur was a salt lake, and many salt rocks remain in the dried up lake. It is difficult to determine the procedure of refining salt there by satellite image. Salt could have been refined by the wet-mining (dissolving mining) method that extracts the salt grains by melting mined salt with subsoil water scooped up from the salt field. It could also have been refined by the gushing-well method in which brine water melted with subsoil water gushes from a well. Concentrating the brine water produces not only salt (sodium chloride) but also magnesium sulfate, magnesium bromide, calcium sulfate, calcium chloride, potassium chloride, etc. We do not know what was produced there, but China's production of salt is second in the world (60% is sea salt, 30% is rock salt and 10% is lake salt). This special production in the salt field may be salt such as potassium chloride for manure.
 |
 |
 |
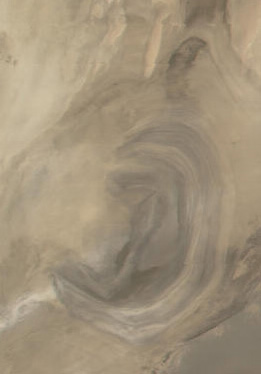
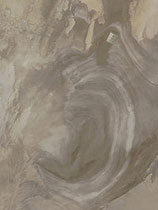
| Fig. 2 January 5, 2002 |
Fig. 3 February 22, 2002 |
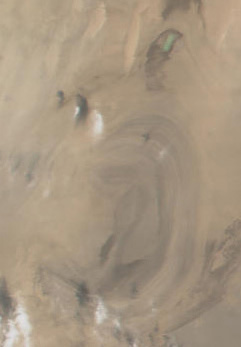
Fig. 4 March 17, 2002 |
 |
 |
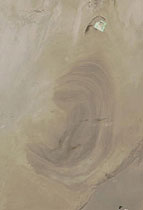 |
| Fig. 5 May 4, 2002 |
Fig. 6 May 20, 2002 |
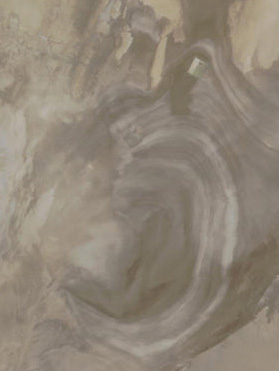
Fig. 7 August 8, 2002 |
| Transition of Lop Nur and salt field |
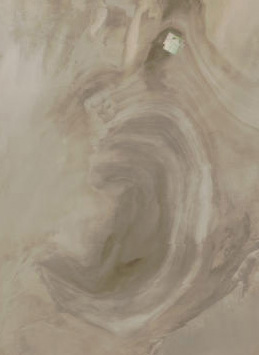
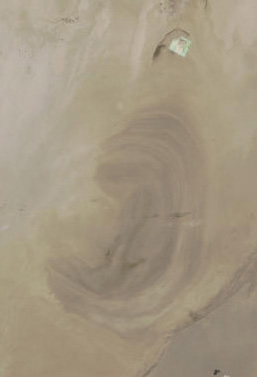
Figures 2 to 7 present images of Lop Nur and the salt field observed by MODIS on board the NASA Earth Observation Satellite, Terra, in January to August 2002. The salt field structure was not visible on January 5 (Fig. 2) and February 22 (Fig. 3), but you can see the left rectangular structure on March 17 (Fig. 4). The structure had expanded to the right on May 4 (Fig. 5). The square structure skeleton was almost completed in May 20 (Fig. 6), and the square salt field was almost completed in August 8 (Fig. 7). From satellite images, you can obtain various information about when and in which periods the world's structures were constructed. You can see that the square salt field was constructed in just three months, from March to June 2002. Please look at Fig. 1 again. You can see that the salt field expanded after that.
Explanation of the Images:
Fig. 1
AVNIR-2 has four observation bands. The composite image was produced by assigning red to Band 3 (610 to 690nm), green to Band 2 (520 to 600nm), and blue to Band 1 (420 to 500nm). The resulting image has natural coloring as if seen by the naked eye. The ground objects are distinguished by the following colors.
| Ocher: |
Desert |
| Blue and Green: |
Water surfaces (Salt field) |
| Black: |
Dried lake or area with no data |
Figs. 2 to 7
| Satellite: |
EOS- Terra (NASA) |
| Sensor: |
MODIS (NASA) |
| Date: |
January 5, 2002 (Fig. 2)
February 22, 2002 (Fig. 3)
March 17, 2002 (Fig. 4)
May 4, 2002 (Fig. 5)
May 20, 2002 (Fig. 6)
August 8, 2002 (Fig. 7) |
| Resolution: |
500 m |
|
 |
|