| |
 |
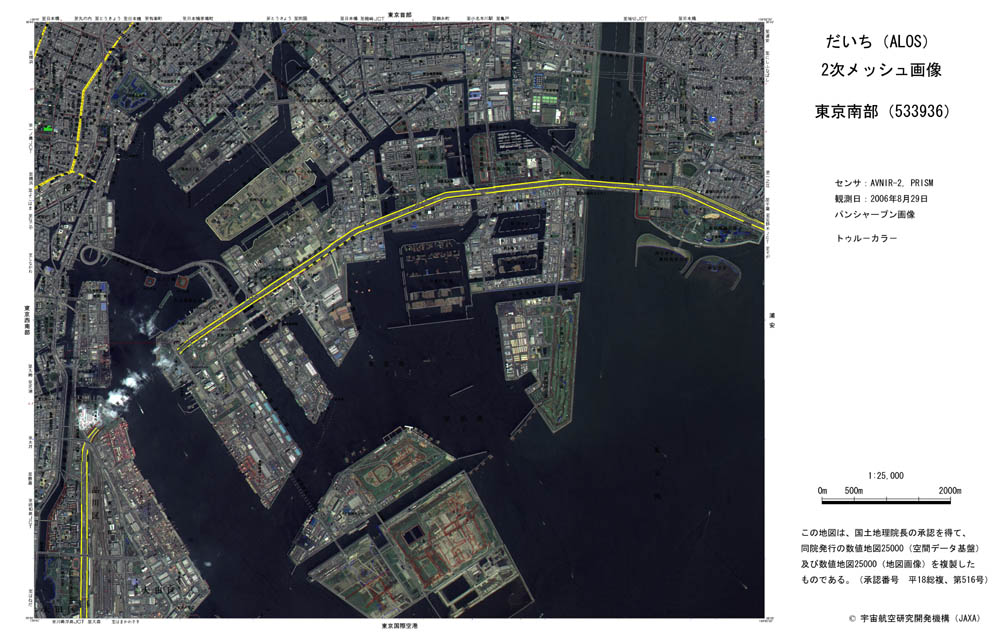
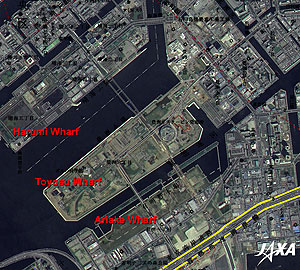
Fig. 1 Satellite Topographical Map of Southern Tokyo
Southern Tokyo (kmz,1.76MB,Low Resolution) is seen from Google Earth.
"Digital Map 25,000" (Spatial Data Framework and Map Image) published by the Geographical Survey Institute is overlaid. |
Figure 1 presents a composite image of southern Tokyo made by combining a pan-sharpened image and 10km square secondary meshed data (see Appendix). The pan-sharpened image was produced from the images acquired by the Advanced Visible and Near Infrared Radiometer-2 (AVNIR-2) and the Panchromatic Remote-sensing Instrument for Stereo Mapping (PRISM) on board the Advanced Land Observing Satellite (ALOS) "Daichi" in August 2006. Yellow lines indicate the Tokyo Metropolitan Expressway.
Rainbow Bridge forms a big loop on the left of the figure, and the enclosure in the center of the figure with brownish thin materials lined up inside is the No. 12 lumber storage area. Kasai Seafront Park with two man-made beaches is visible to the right. Daichi's pan-sharpened color image has a ground resolution of 2.5m, which enables easy recognition of town blocks, buildings, roads, railways, and green areas.
Daichi images are not only used by themselves but can also be a more convenient and useful satellite map if it is displayed together with map and other information.
 |
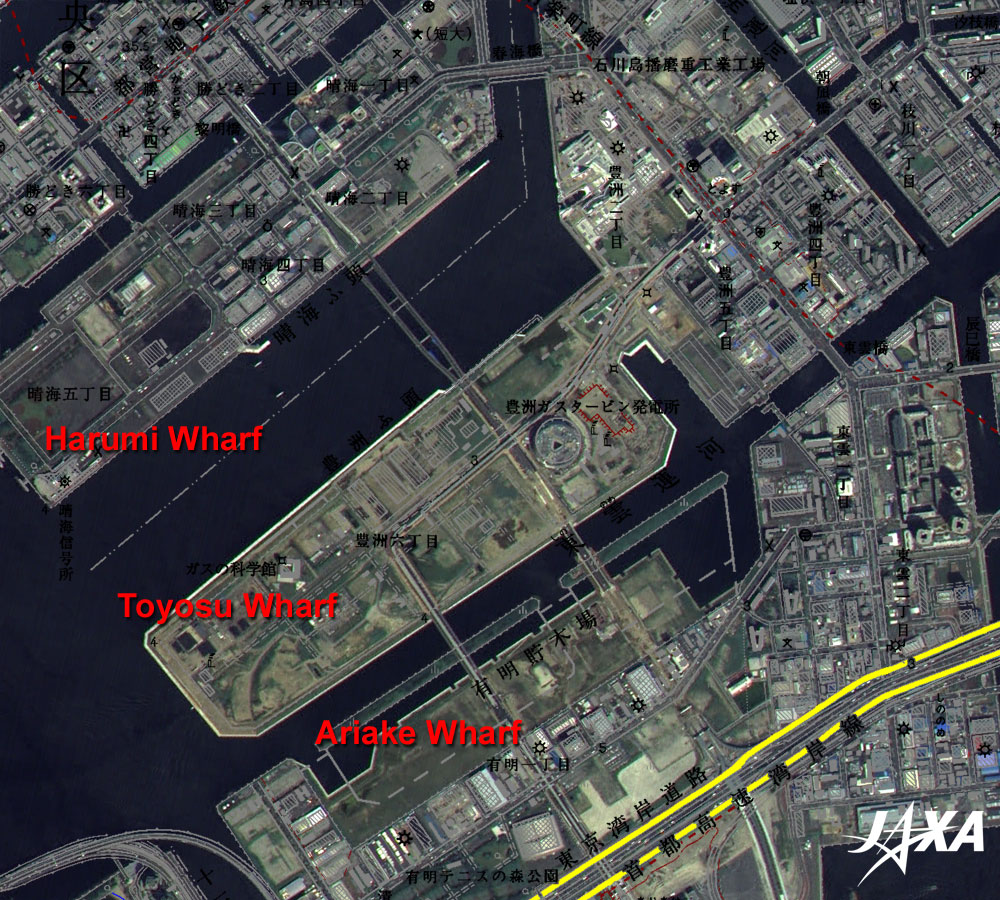
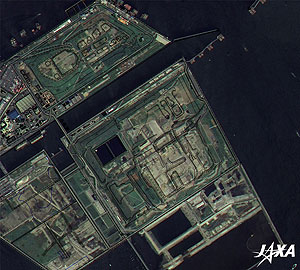
| Fig. 2 Bridge near Toyosu Wharf that doesn't appear in the map |
Figure 2 is a close-up image of the upper left portion of Fig. 1. Toyosu wharf is at the center of the image, Ariake wharf is to the southeast, and Harumi wharf is to the northwest. Harumi-Ohashi (a big bridge) connecting Harumi wharf and Toyosu wharf is clearly visible in the figure, but it does not appear in the map since it was just opened to traffic in March 2006.
A map symbol for factory appears at Toyosu ni-choume (second block of Toyosu) to the northeast of Harumi-Ohashi, but no such building is visible in the Daichi image. There was once a shipyard here, but it was relocated and the area redeveloped into a large shopping center.
Tokyo announced its candidacy for hosting the 31st Olympic Games in 2016. If it is selected, many athletic facilities will be built in Toyosu wharf. The hosting city will be determined at the IOC plenary meeting in Copenhagen, Denmark, in October 2009.
 |
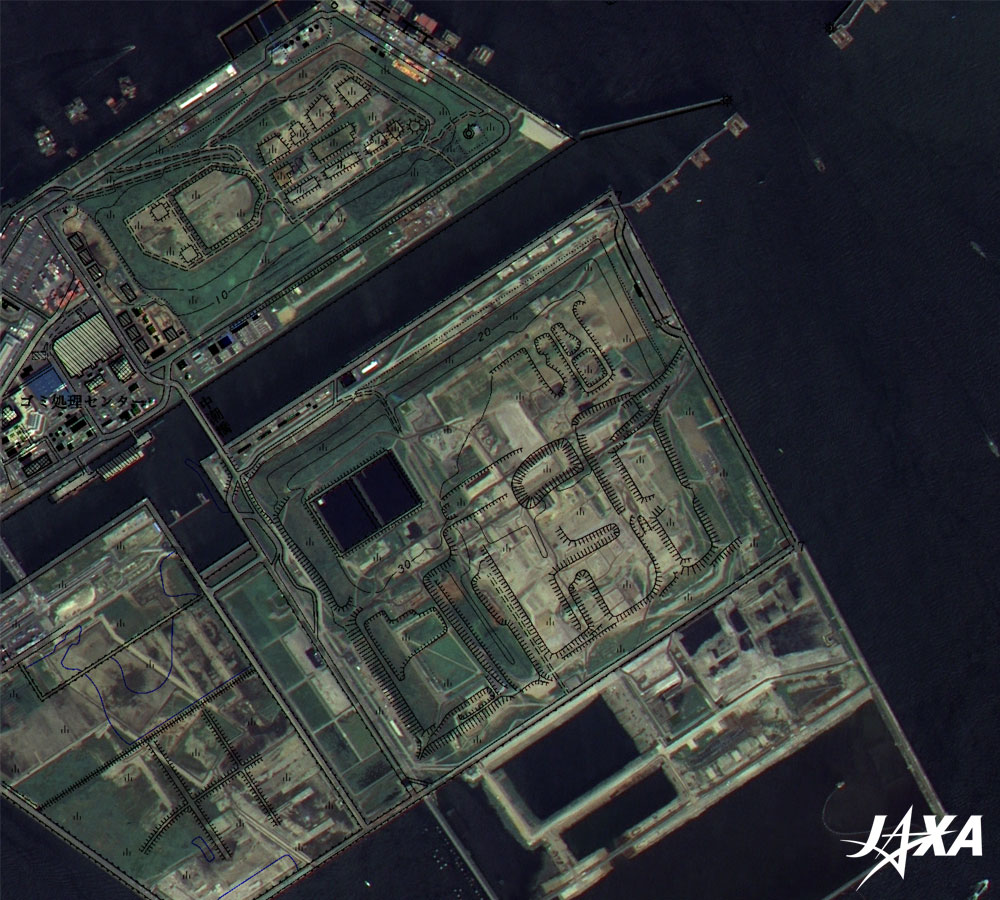
| Fig. 3 Land that doesn't appear in the Map; Reclaimed Ground at the Central Breakwater |
Figure 3 is a close-up image of the lower part of the Fig. 1, depicting the Reclaimed Disposal Ground at the Central Breakwater (Chuu-bou). It is the final landfill disposal field of the waste from the 23 districts of Tokyo. The land-fill areas are, from north to south, the inner disposal site, the outer disposal site, and the new water surface disposal site. Refuse landfill at the inner disposal site started in December 1973 and finished March 1987. The landfill area is about 78ha and contains 12.3 million tons of refuse. Refuse landfill at the outer disposal site started in October 1977, and that of the new water surface disposal site started in December 1998; land filling continues in these areas. The landfill areas are 199ha and 319ha. Although the landfill status is clearly reflected in the Daichi image, the new water surface disposal site does not appear in the map.
Daichi data present the latest status of the ever-changing Earth's surface while Daichi repeatedly observes the same area on a 46-day cycle. The Japan Aerospace Exploration Agency (JAXA) is conducting demonstration experiments to apply this capability to disaster-prevention activities in cooperation with disaster-prevention-related agencies. Figure 1 is a topographic map prepared for planning to dispatch rescue teams to devastated sites. Predisaster satellite images are expected to provide information that will help to select transportation routes for relief materials and landing sites for rescue helicopters. In this experiment, Daichi data are also used in some fields of disaster-prevention such as monitoring volcanic activity.
Daichi data can be modified in various ways depending on the user needs. Examples other than the satellite topographic map shown here include mosaic-processed wide-area images (prefecture image, province image etc.) and three-dimensional stereoscopic images to see topographic relief of the ground.
Explanation of the Images:
(Figs. 1 to 3)
PRISM is an optical sensor for observing ground surfaces with visible and near-infrared signals in the 520 to 770 nano-meter (one-billionth of a meter) band. The acquired image is monochrome. PRISM has three independent optical systems (telescopes) to acquire images for nadir, forward, and backward views at the same time. Only the nadir image was used in this article.
AVNIR-2 is equipped with a pointing function by which it can shift its observation area perpendicular to ALOS's direction of travel, and it can observe ground surfaces with four spectral bands.
First, the color image was produced by assigning red to Band 3 (610 to 690 nm), green to Band 2 (520 to 600 nm), and blue to Band 1 (420 to 500 nm). The image was then transformed into Hue, Saturation and Intensity, and the Intensity was replaced by the PRISM image. The Hue, Saturation and Intensity data were then reversed into a color image. As a result, a virtual 2.5m ground-resolution color image was obtained. This kind of high-resolution color image, composed by combining the higher resolution monochrome image and the lower resolution color image, is called a pan-sharpened image. The resulting image has natural coloring as if seen by the naked eye. Thus, the ground objects are distinguished by the following colors.
| Green: |
Forests, grass field |
| City area or roads: |
City area or roads |
| Ocher: |
Bare ground |
| Red, blue, white etc.: |
Roofs of buildings |
| Dark blue: |
Water surfaces (sea, rivers) |
|
 |
Related Sites:
 ALOS Research and Application Page ALOS Research and Application Page
Pan-sharpened image around Tsukuba Science City
Land, Seen from Space
Appendix:
First Mesh and Secondary Mesh:
Each 80km square area of Japan divided by 1° (arc degree) longitudinal lines and 40' (arc minutes) latitudinal lines is called the first mesh (as defined by the Geographical Survey Institute of Japan, corresponding to the area of one 1/200,000 topographical map). Each 10km square area of the first mesh divided by 8 in longitudinal and latitudinal directions is called the secondary mesh (corresponding to the area of one 1/25,000 topographical map). Various map-related information is often arranged with regard to those meshes, therefore, meshed satellite images can be used as satellite maps.
The number 533936 shown in the Fig. 1 is a mesh code; the first four digits indicate the first mesh, and the next two digits indicate the secondary mesh.
The mesh-related information reveal the detailed status of the districts on the same standard, thus they can be widely used in the city planning, development, disaster prevention, and pollution control of the national and local governments.
|
|