Seen from Space 2006
Land surface temperature distribution in the northern hemisphere as observed by AMSR-E: Strong cold wave in Siberia and severe winter in Japan this year
| |
 |
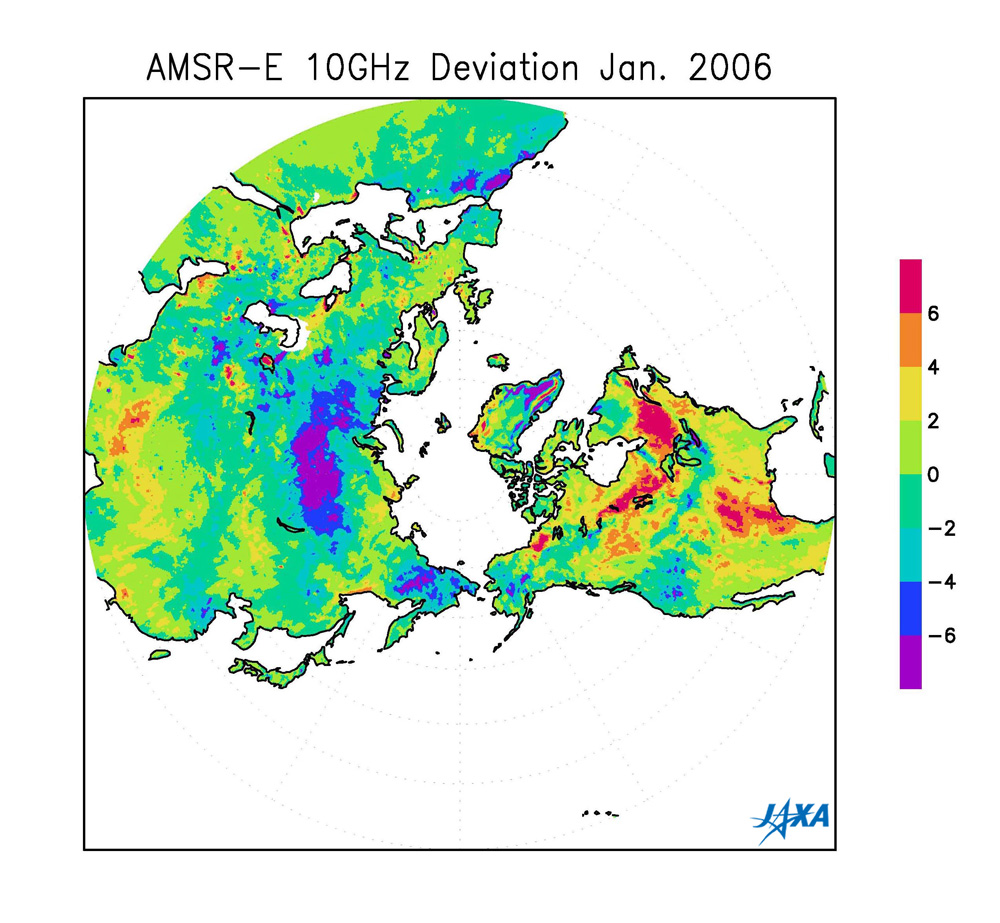
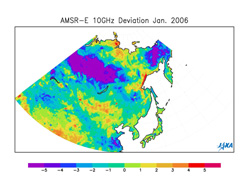
Fig. 1 Land surface temperature distribution in the northern hemisphere
during January 2006.
Full size of Figure 1 is here. (1.76MB)
|
Russia experienced its most severe cold wave in 100 years in January 2006, and there was an unexpectedly severe winter in Japan. A temperature of -58°C was recorded in the Evenki Autonomous District and in the Krasnoyarsk area in central Siberia on January 12. This was 22°C lower than the normal temperature of -36°C for that locale in January.
Figure 1 shows the distribution of land surface temperatures in the northern hemisphere during January 2006 as observed by AMSR-E*1. The figure displays the difference from the mean value for January over a four-year period (from 2003 through 2006). Red depicts high temperatures and blue depicts low temperatures.
In this image, a large blue-purple area appears in the Siberia inland north of the line from the Caspian Sea to Lake Baikal and the eastern edge of the continent, north of the Kamchatka Peninsula. Land surface temperature is much lower than average. The Evenki Autonomous District and the Krasnoyarsk area, where a temperature of -58°C was recorded, are northwest of Lake Baikal, almost in the center of the low-temperature area. Around Morocco in North Africa, land surface temperatures were also much lower than average. Regions on the image with a lot of orange or red show that temperatures have risen more than the average in North America.
 |
 |
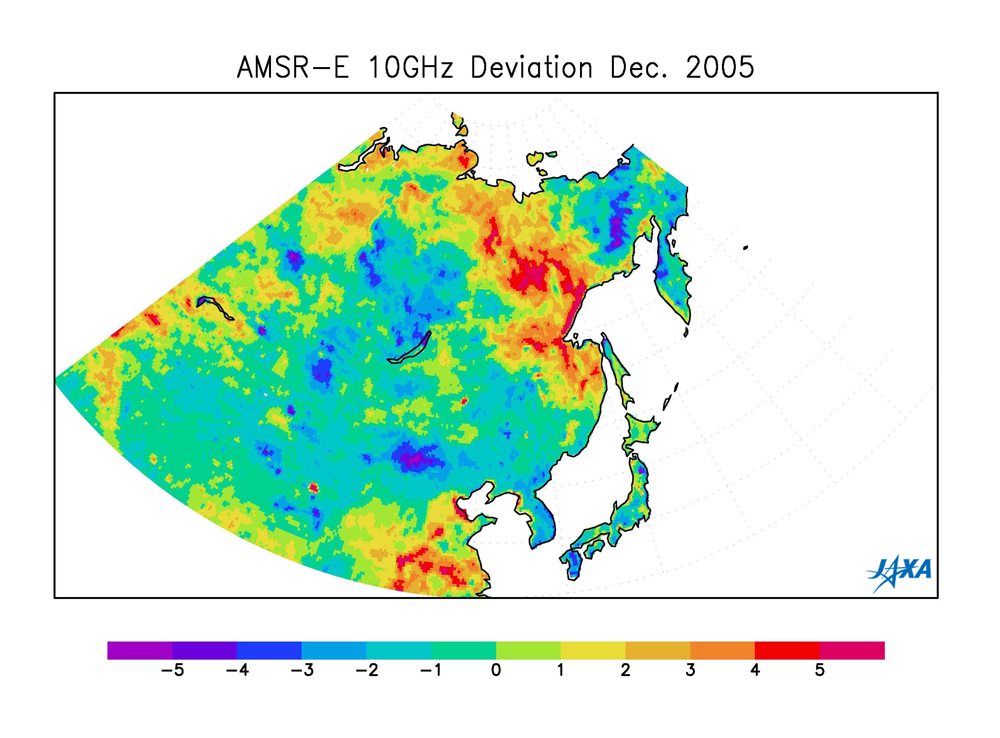
December 2005,
Full size picture is here (1.99MB) |
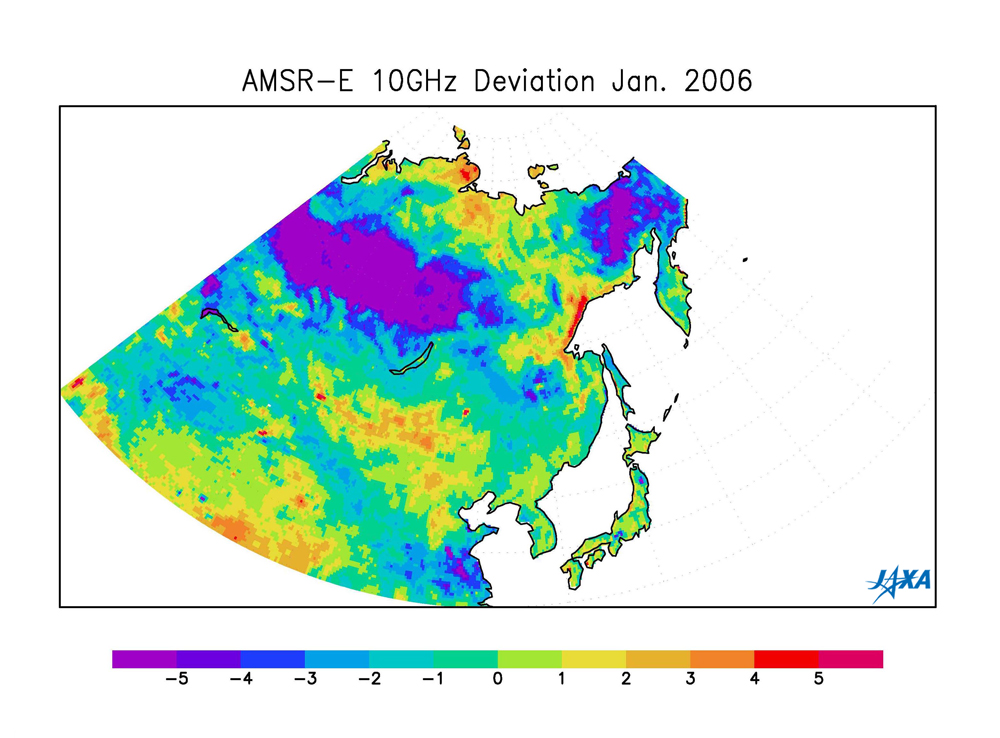
January 2006
Full size picture is here (2.1MB) |
| Fig. 2 Land surface temperature distribution near Japan this winter |
Figure 2 is a close-up image, centered on Japan during December 2005 and January 2006. In Japan, temperatures dropped at the end of last year, and heavy snow fell on the areas of the Sea of Japan side. The figure for December last year shows that the land surface temperature in Japan was about 2 to 3°C lower than average. When we look at the figure for January 2006, Japan's land surface temperatures are close to the average. The figure for December 2005 near the Siberian coast northwest of Okhotsk indicates land surface temperatures 3 to 5°C warmer than average. This seems to be related to the decreasing sea ice in the Sea of Okhotsk*2 this year.
The Arctic Oscillation, the meandering path of the prevailing westerlies in the atmosphere around the North Pole, is thought to cause these abnormally low temperatures. A large portion of the cold atmosphere travels south when the Arctic Oscillation strengthens. Although we do not fully understand the causes for the changes in the Arctic Oscillation, the possibility that a strengthening Arctic Oscillation is related to a decrease of sea ice in the Arctic Ocean was investigated by "Earth Frontier Research System," the collaborative project of JAMSTEC and NASDA (present JAXA) five years ago*3. AMSR-E*4 observations have confirmed the decrease of sea ice in the Arctic Ocean in recent years. Continued investigation on relationship between these two phenomena is essential though it is in the research stage.
Explanation of the images:
(Fig. 1 and Fig. 2)
| Satellite: |
EOS-Aqua (NASA) |
| Sensor: |
Advanced Microwave Scanning Radiometer-EOS (AMSR-E; JAXA) |
| Date: |
January 2006 (Fig. 1)
December 2005, January 2006 (Fig. 2)
|
|
The data from AMSR-E*1 observation of the brightness temperature of the 10 GHz microwaves radiated from the Earth's surface over four January's from 2003 to 2006 are deflected with their average. Because the 10 GHz microwave signal penetrates the atmosphere, the land surface is clearly visible. The description on the products and the algorithms of AMSR-E is here.
|
|
 |
Related sites:
 Heat Wave in Australia Heat Wave in Australia
Heat Wave in Europe
Cryosphere, Seen from Space
AMSR/AMSR-E
Appendix:
This severe Siberian cold wave occurred in mid-January and continued for over a week. A Siberian high-pressure system along with a mass of cold, heavy air developed to 1,060 hPa in its center and the northwestern monsoons increased in Japan at the same time. The available energy sources for heating were insufficient in various areas of Russia. Therefore, natural gas exports were reduced by 20 percent and the gas was used for domestic consumption. The after effects of this severe cold also extended into Europe.
|
|