ページの先頭です。
本文へジャンプする。
【Important Notices】This page is an archive page of information published in the past. Since the update has been completed, it may contain broken links or outdated information. For the latest information, please use the new site Earth-graphy (earth.jaxa.jp).
ここからサイト内共通メニューです。
サイト内共通メニューを読み飛ばす。
サイト内共通メニューここまで。
ここから本文です。

Seen from Space 2005

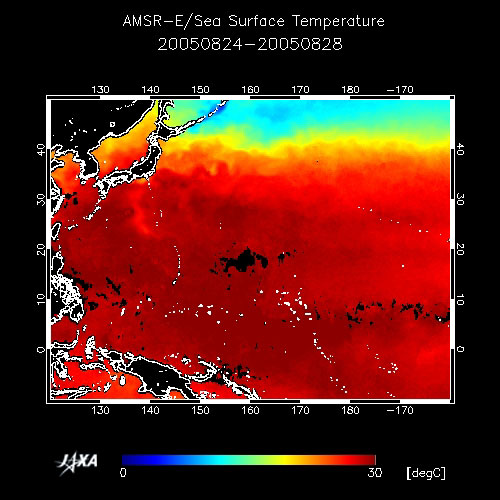
Footprint Left on Sea Surface by Typhoon 200511 "Mawar"


Typhoon Mawar (meaning "Rose" in Malaysian) struck the Kanto region of Japan on August 26, 2005 and left its footprint upon the sea just offshore of the Tokai region. Figure shows a five-day average (from August 24 to August 28) of sea-surface temperatures as observed by a microwave sensor, the Advanced Microwave Scanning Radiometer for EOS (AMSR-E). The red hatching on the sea surface represents high temperatures, and the blue hatching represents low temperatures (between 0°C and 30°C. The black hatching represents land and regions that were not observable due to thick clouds.

Nearly the entire southern part of Japan is hatched in dark red, indicating temperatures of approximately 30°C. There is bright red hatched area surrounding the dark red hatched area along and to the west of the Izu and Ogasawara Islands. This bright red area is the footprint of typhoon Mawar. At the sea surface during a typhoon, strong winds stir the hot surface water and the cold water below it, cooling the surface water, so the footprint of the typhoon is cooler than the surrounding seas.

Typhoon Mawar began to form south of the Ogasawara Islands on August 20, 2005, and quickly developed a central atmospheric pressure of 930 hPa by August 22. Mawar gradually weakened, moving northward, grazing the Izu Peninsula. It struck the city of Chiba on Tokyo Bay on August 26 and became an extratropical cyclone in the area offshore of Kujuu-kuri-hama on August 28.

By the time the typhoon struck the coast, it produced 528 mm of measurable precipitation for one day at Hakone and 57.0 m/s of wind velocity (averaged over ten minutes) at Izu Oshima Island. It caused great destruction, blocking traffic and cutting off supplies when it struck Tokyo and the Kanto region.

In the report on the typhoon's track by the JAXA/EORC Tropical Cyclone Database, we see that Typhoon Mawar traveled from August 20 to August 28 in a clockwise arc (semicircle). The typhoon track almost matches the bright-red hatching (cooler area) of the figure This cooler area of sea surface disappears a few days afterward due to the heat of the sunshine and the surrounding hot water.

The large meandering Kuroshio Current is not visible in the figure. On September 12, the Japan Meteorological Agency announced that it had ended in August 2005. JAXA will continue using spacecraft observation to identify such otherwise invisible phenomenon.


Explanation of the image:
Satellite: EOS- Aqua (NASA)
Sensor: Advanced Microwave Scanning Radiometer- EOS (AMSR-E; JAXA)
Date: Five-day average from August 24 to August 28, 2005
Figure depicts the calculated sea-surface temperature averaged over five days, based on the observation data from AMSR-E. It also shows the algorithm and other products of AMSR-E.

Related sites:
Kuroshio Monitor
JAXA EORC Tropical Cyclone Database
TRMM Typhoon Quick Report (Japanese only)
AMSR-E Typhoon Quick Report (Japanese only)
AMSR-E Today's Image
MODIS Near Real-Time Data (Japanese only)
Kuroshio's Large Meander Continues This Year
AMSR-E captures Kuroshio's Large Meander
Typhoon/Flood, seen from Space
Ocean, seen from space


Appendix:
Structure of typhoon:
A typhoon is a huge atmospheric vortex formed by the heat of the water vapor from the sea surface. When it rises, the water vapor releases latent heat to the surrounding air and returns to a liquid state. Next, the heated air becomes lighter and a strong updraft develops. The air pressure at the bottom of the updraft decreases, and the surrounding moist air gathers and is raised by the updraft. This releases more latent heat and further strengthens the updraft. The updraft grows stronger, the air pressure at the bottom of updraft decreases even more, and when the air flows back down, the cycle develops into a large air vortex called a tropical cyclone or typhoon.

The enormous amount of water vapor from the sea surface maintains this updraft pattern. The water absorbs the heat from the sea surface as it returns from liquid to vapor. The strong winds caused by the typhoon wash away the hot water on the sea surface, and the cold water from below rises (upwelling). This process cools the sea surface under the typhoon. Evaporation from the sea surface decreases, weakening the updraft, and the typhoon gradually loses its strength.

Typhoons generally increase in strength when sea-surface temperatures are greater than 26°C, and decrease when it is less than 26°C. The bright-red hatched area in the figure represents a temperature of approximately 25°C. The typhoon at this point is gathering all the heat that it can from the sea surface.
本文ここまで。
image:Satellite Navigator
image:Satellite Applications and Operations Center(SAOC)
Earth Data Collection by JAXA Satellites
image:ページTOP