ページの先頭です。
本文へジャンプする。
【Important Notices】This page is an archive page of information published in the past. Since the update has been completed, it may contain broken links or outdated information. For the latest information, please use the new site Earth-graphy (earth.jaxa.jp).
ここからサイト内共通メニューです。
サイト内共通メニューを読み飛ばす。
サイト内共通メニューここまで。
ここから本文です。

Seen from Space 2005

What color is the Earth's surface?
- Cloud-free global land-surface images from GLI. -

 
Fig. 1 Cloud-free global land-surface image from GLI.
High resolution, 2700x1350 TIFF: 2.58MB, pixel
resolution at surface is about 16km on the Equator
Twenty-nine percent of the Earth's surface is landmass and displays many faces, including green-rich forest, bare desert, ice and snow.
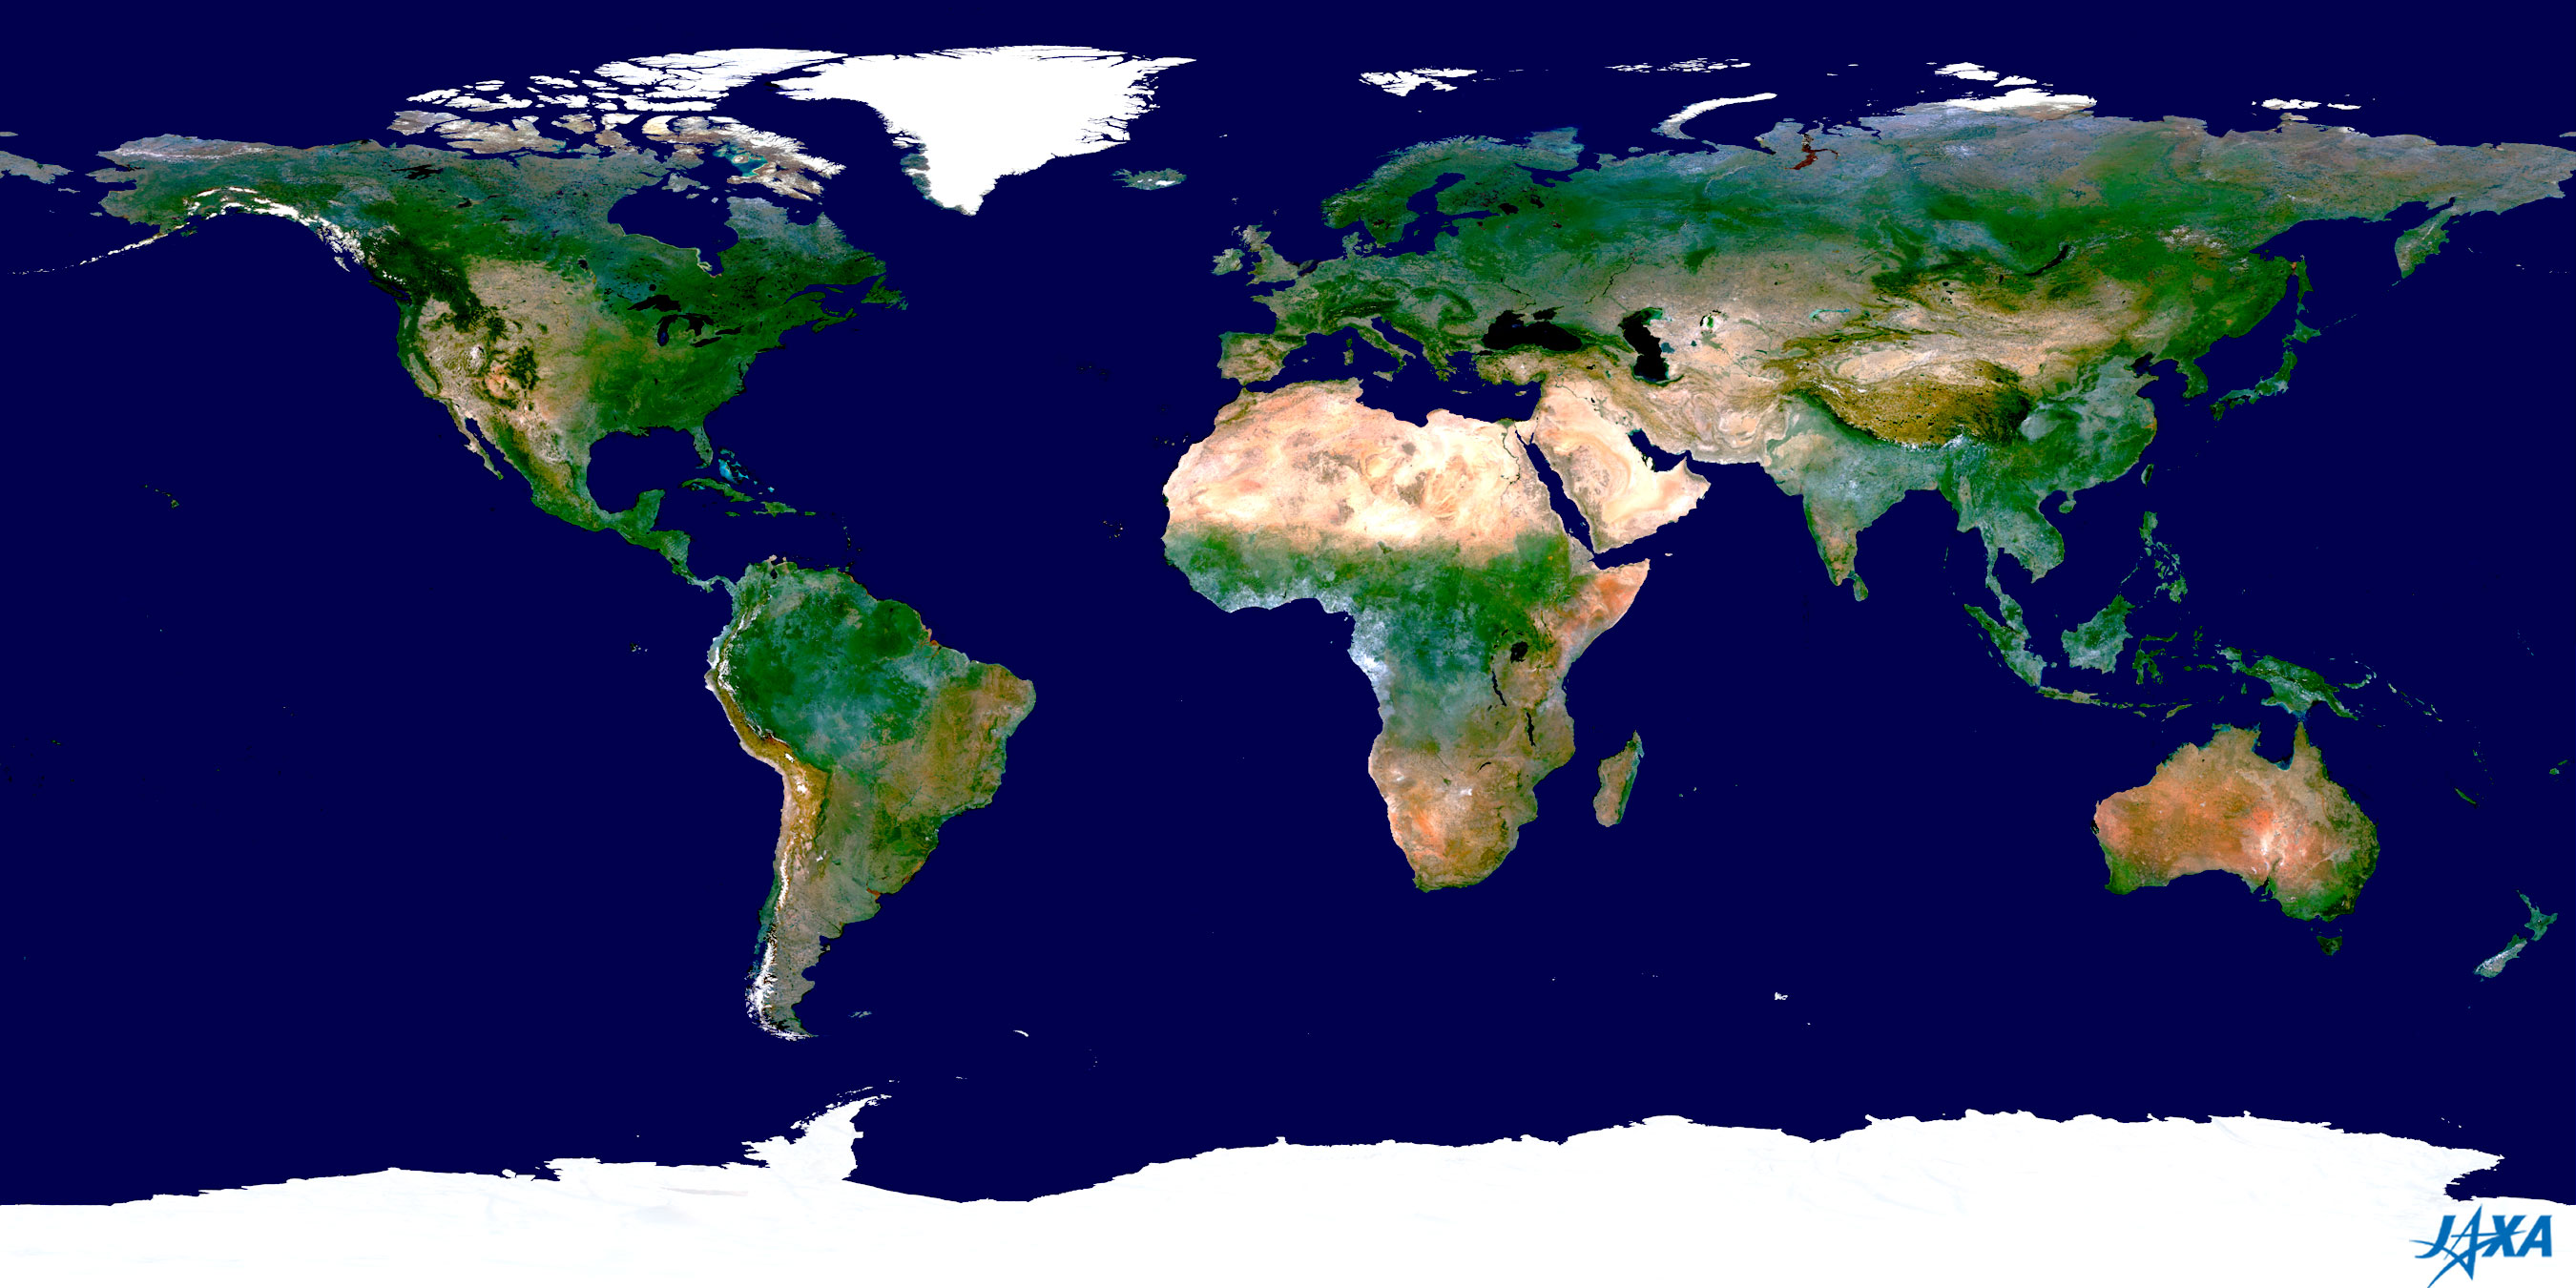
JAXA EORC produces true-color global images using Earth-observation satellites that continually observe the Earth's surface from orbit. We have released global cloud-free images (as Fig. 1) produced using ADEOS-II GLI data.

In Fig. 1, the white area in the upper left is Greenland, and that in the lower left is Antarctica. The yellow or brown area in the center is the Sahara desert of northern Africa. We can see that the arid or semi-arid areas in the Arabian Peninsula, Central Asia, Australia, eastern and southern Africa, western North America, and South America have expanded from the yellow or brown areas.
The deep green of other land areas indicates rich vegetation.

Fig. 2 Cloud-free spherical land-surface image
from GLI
(centered on Japan).
(High resolution, 2000x2000 TIFF: 2.69MB)
Fig. 3 Cloud-free spherical land-surface image
from GLI
(centered on Europe).
High resolution, 2000x2000 TIFF: 3.37MB
Fig. 4 Cloud-free spherical land-surface image
from GLI
(centered on North America).
High resolution, 2000x2000 TIFF: 2.73MB

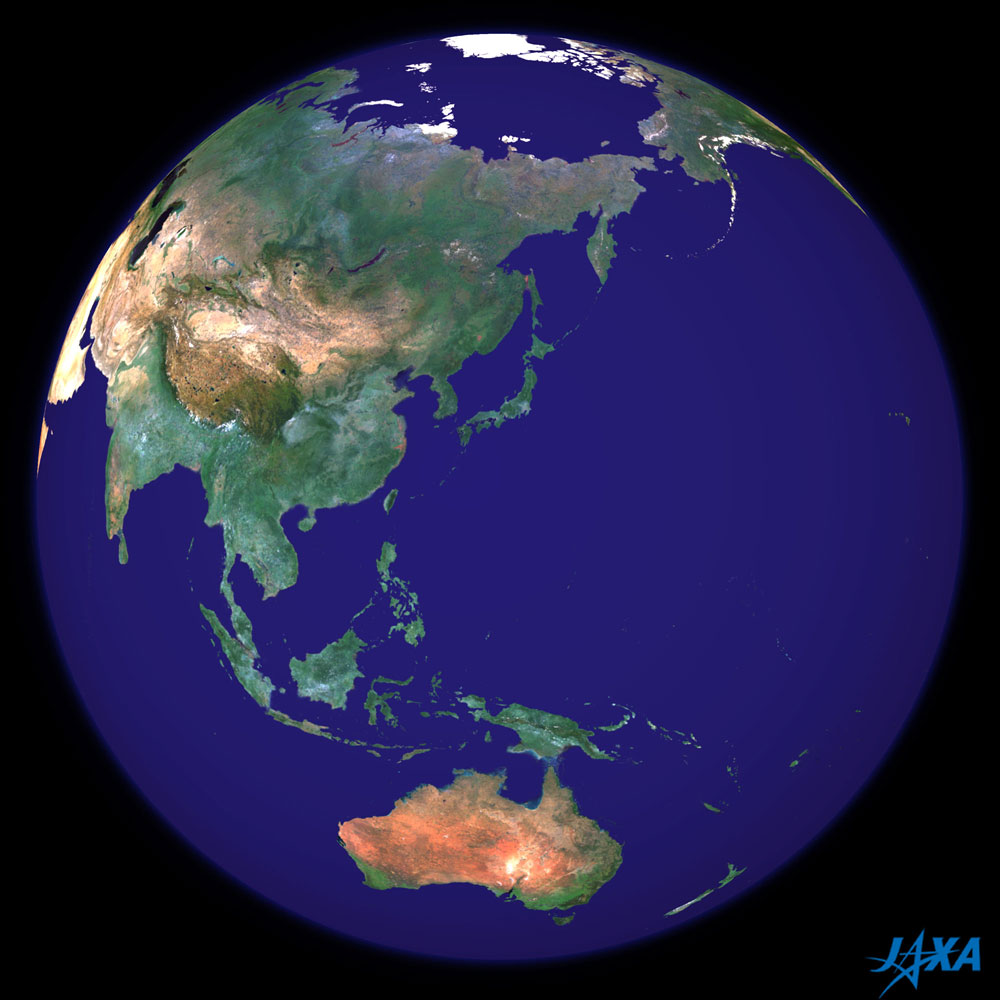
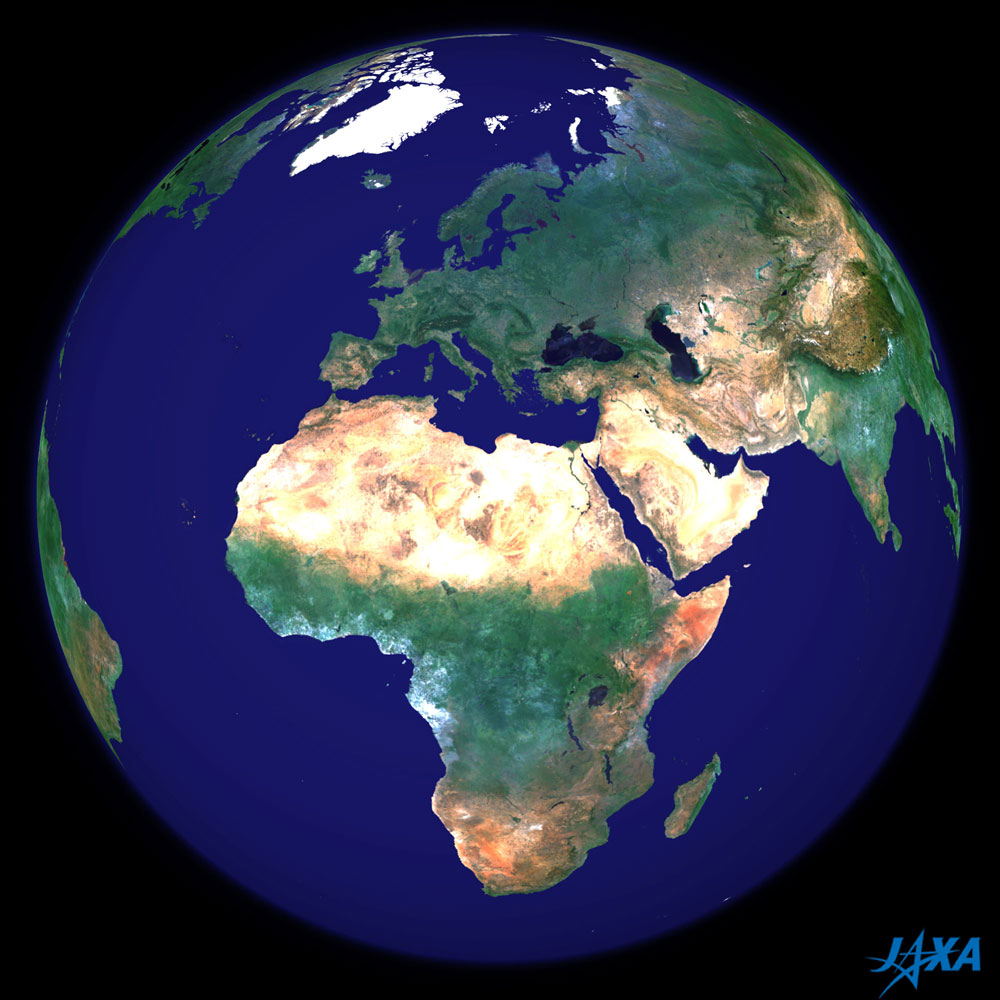
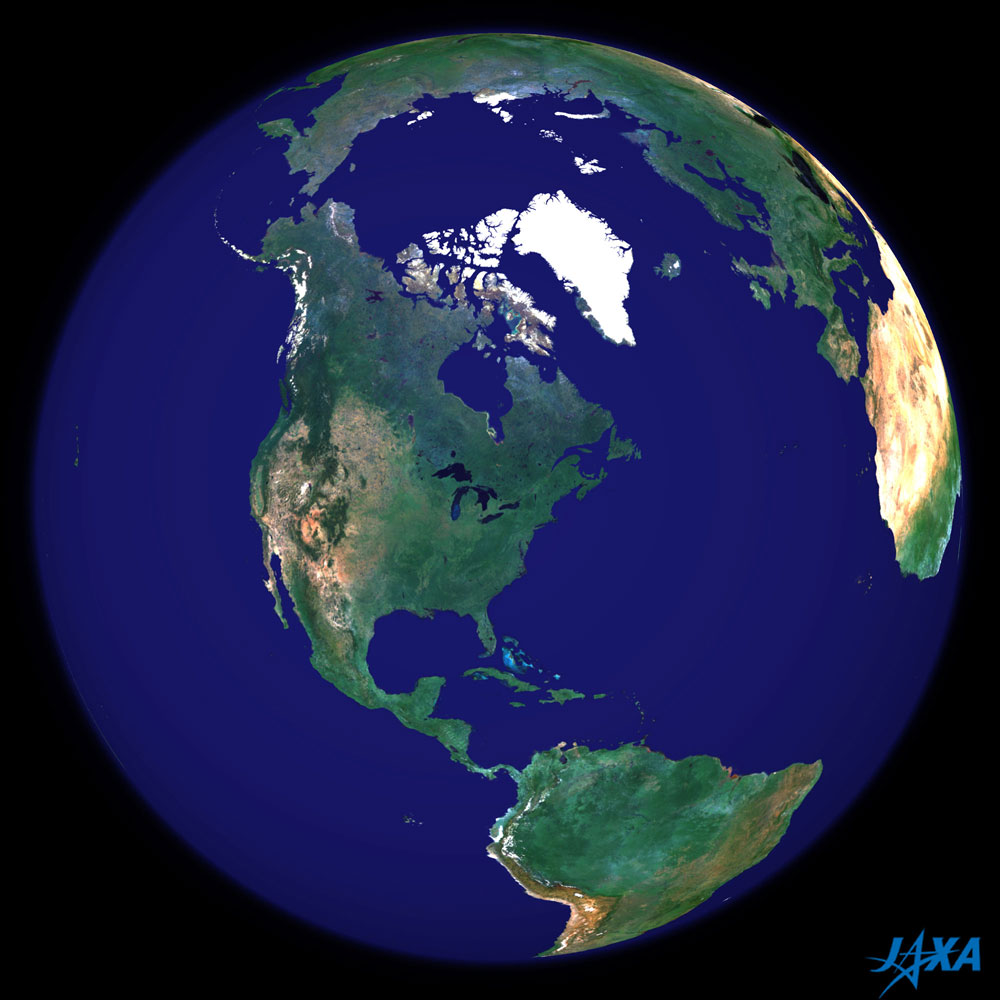
Figures 2 to 4 are spherical projected images using Fig. 1, with the center being Japan, Europe, and North America.

How many days does an Earth-observation satellite require to completely observe the Earth's surface? It depends on the satellite's characteristics, such as orbit and observation mode. ADEOS-II GLI requires about three days.
However, satellites can not obtain the same images every day due to the many clouds. We know the seasonal variations of the Earth's surface, because we can feel them in our daily life.
This image of the Earth is composed of about 2200 low cloud-influenced images chosen from many observation images acquired by ADEOS-II GLI from April to October 2003.


Explanation of the images:
(Figs. 1 to 4)
Satellite: ADEOS-II (Midori-II)
Sensor: GLI: Global Imager
Date: April 15 to October 24, 2003 (193 days).
The color composition was made by using three visible GLI bands: 678nm (band 13) for red, 545nm (band 8) for green, and 460nm (band 5) for blue. As a result, the figures have a true coloring, and appear as though seen with the naked eye.
White or gray represents snow, ice, or cloud areas; green, vegetation; and brown, bare or sparse areas of vegetation. Many parts of the ocean are masked with deep blue.
Figure 1 used Plate Carree projection; Figs. 2 to 4 used Orthographic projection.

本文ここまで。
image:Satellite Navigator
image:Satellite Applications and Operations Center(SAOC)
Earth Data Collection by JAXA Satellites
image:ページTOP