Seen from Space 2005
Kuroshio's Large Meander Continues This Year
| |
 |
 |
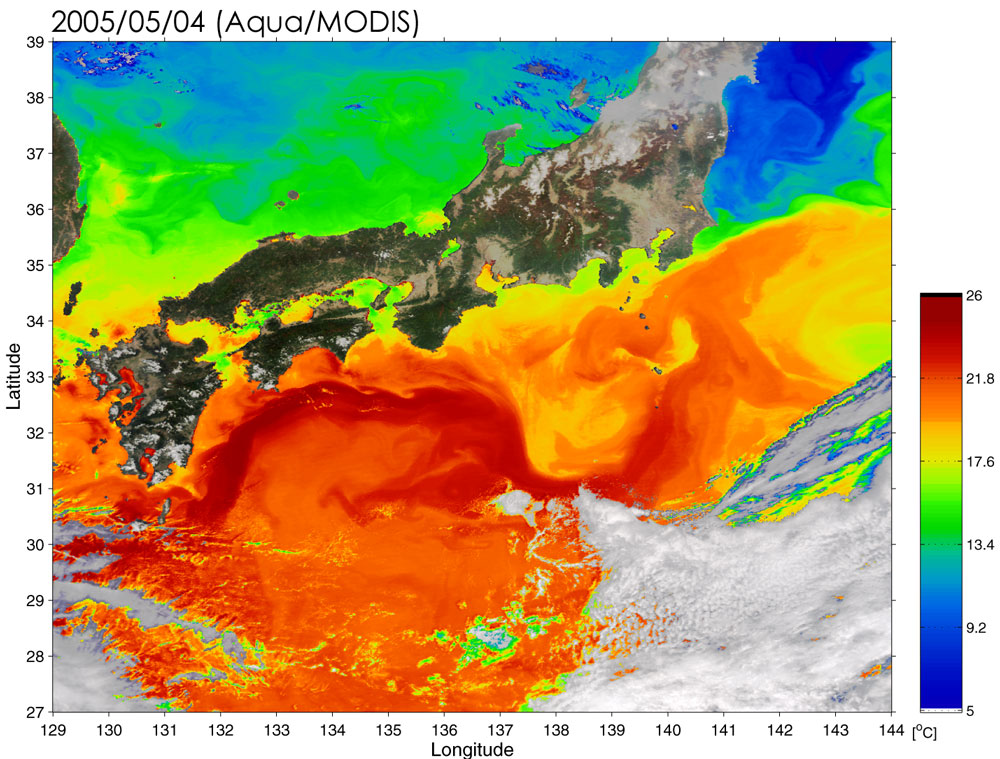
| Fig. 1. Sea-Surface Temperature southwest of Japan observed by Aqua MODIS (May 4, 2005) |
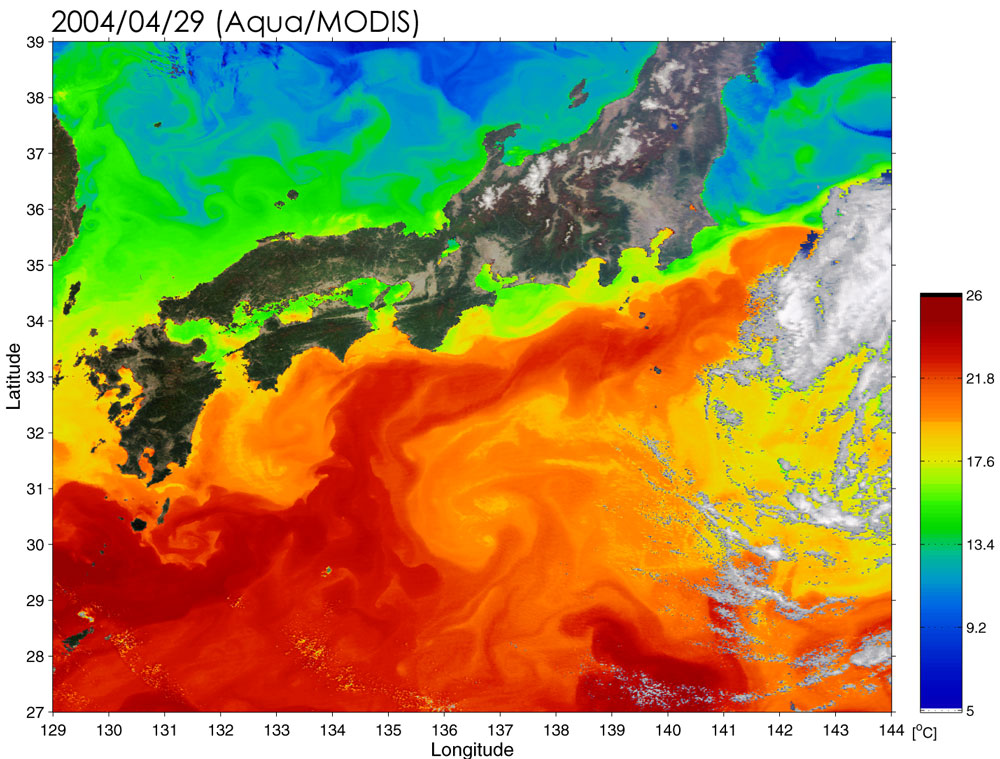
Fig. 2. Sea-Surface Temperature southwest of Japan observed by Aqua MODIS (April 29, 2004) |
The large meander of the Kuroshio Current has continued since last summer after an interval of 13 years (AMSR-E captures Kuroshio's Large Meander). Figure 1 presents the sea-surface temperature (SST) southwest of Japan observed around 1:30pm on May 4, 2005 by MODIS aboard NASA's Aqua satellite. Kuroshio's warm current flowed to the south of Kii Peninsula from off Shikoku, meandered a significant distance to the south offshore Tokai, and then approached the Boso Peninsula. This is quite a difference in distances from Kii Peninsula and Ensyu Coast from the current pattern one year ago (29 April 2004; Fig. 2). These changes of sea level and fishery locations can influence people's lives. For example, it was reported that the bonito catch at Kushimoto fishing port in March 2005 was reduced to less than half of that last year.
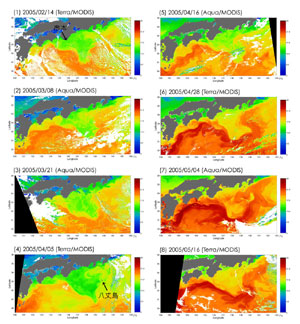 |
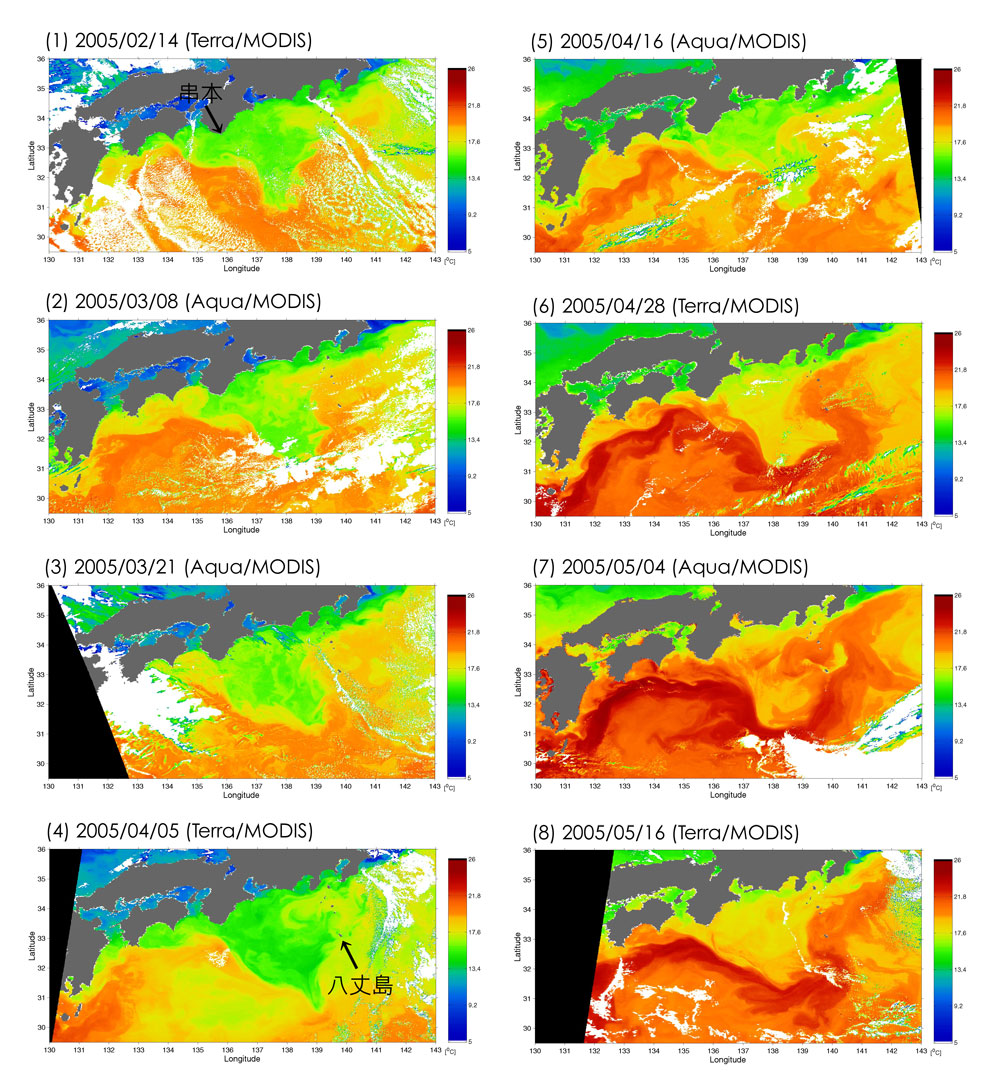
| Fig. 3. Sea-Surface Temperature south of Japan observed by Aqua and Terra MODIS from 14 Feb. to 16 May 2005. |
In April 2005, however, the Kuroshio came a bit closer to the Kii Peninsula, and a report stated that the bonito catch increased compared to the previous month. Figure 3 depicts SST obtained twice a month from February to May 2005 south of Honshu. The Kuroshio Current off Kushimoto and small-scale eddies around Hachijo Island changed considerably in the short term (half of the month). This indicates that a large meander state includes complex changes which influence the people in various aspects.
The SST of Kuroshio Current increased from spring to early summer by approximately 20°C (orange color) in Figs. 3 (1) to (4) and 23°C to 25°C (red color) in Figs. 3 (6) to (8).
Explanation of the images:
(Fig. 1)
| Satellite: |
EOS-Aqua (NASA) |
| Sensor: |
MODIS: Moderate Resolution Imaging Spectro-radiometer (NASA) |
| Date: |
Approximately 01:00 (JST) on May 4, 2005) |
|
(Fig. 2)
| Satellite: |
EOS-Terra (NASA) |
| Sensor: |
MODIS: Moderate Resolution Imaging Spectro-radiometer (NASA) |
| Date: |
Approximately 01:00 (JST) on April 29, 2004 |
|
(Fig. 3)
| Satellite: |
EOS- Terra and Aqua (NASA) |
| Sensor: |
MODIS: Moderate Resolution Imaging Spectro-radiometer (NASA) |
| Date: |
February 14 to May 16, 2005(JST) |
|
|
|
MODIS has 36 channels in its observation spectrum. Based on a JAXA algorithm, sea-surface temperatures are estimated from channel 29 (8.400 to 8.700µm), channel 31 (10.780 to 11.280µm) and channel 32 (11.770 to 12.270µm) for detecting the surface temperature of land, sea and clouds. Spatial resolution of the original data is 1km. In the figure, the deeper red color indicates a higher sea-surface temperature, and the deeper blue, a lower temperature. Please refer to the color bar corresponding tosea-surface temperatures.
In Figs. 1 and 2, the colors of the land and the clouds over the sea were composed by using three of the 36 channels on MODIS: channel 1 (620 to 670 nm) for red , channel 2 (841 to 876 nm) for green, and channel 3 (459 to 479 nm) for blue . As a result, vegetation appears to have a natural coloring as seen with the naked eye. The resolution of the original figure is about 1km. In Fig. 3, the shaded areas are land, white areas are clouds over the sea, and black areas indicate no data.
|
Related sites:
 AMSR-E captures Kuroshio's Large Meander AMSR-E captures Kuroshio's Large Meander
Ocean
MODIS near-real-time images
(Proceed to "1km" then to "SST")
|