Seen from Space 2005
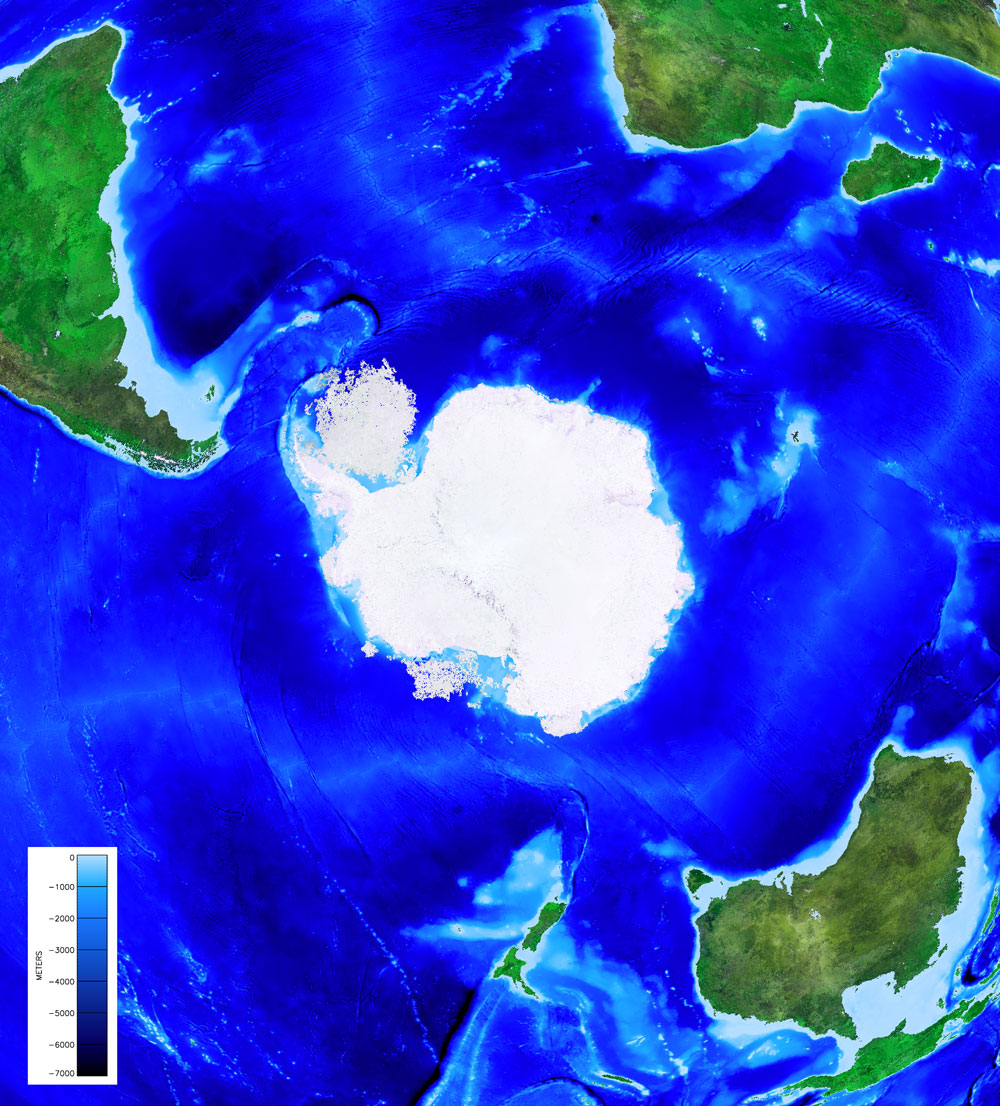
Antarctica-An isolated continent-
This image shows the continents and floating sea-ice cover around the South Pole captured in late summer (Jan. to Mar.) 2003 by MODIS. Antarctica (center), South America (upper left), Africa (upper right), and Australia (lower right) can be seen. Sea depth is also shown by shading of blue for open water areas (NGDC/NOAA ETOPO2 global bathymetry data is used). In this season, sea-ice area around the Antarctic Continent reaches an annual minimum so that the shape of the white continent can be clearly seen together with some floating sea-ice on Weddell Sea (upper left of the continent) and Ross Sea (lower middle). In Antarctica, shrinking sea-ice area, increased glacier flow velocity, and frequent giant icebergs resulting from global warming phenomenon have recently been seen. The cold, white the Antarctic Continent makes a good contrast with brownish desert spread over the Australian Continent and vast green spread over the South American and African Continents. “The Southern Ocean,”an annular deep ocean over 4000m in depth, spreads around the Antarctic Continent, separating the continent from other major continents in the southern hemisphere. A ridge, an area relatively shallower than the surrounding floor, also runs on the seafloor surrounding the Antarctic Continent and extends into the central Atlantic Ocean (upper left) and the Pacific Ocean (left), where plates are moving apart and new crust is created from the mantle. The crust is created faster in the Pacific Ocean (4 to 10cm/yr) than in other oceans (0.5 to 4cm/yr in the Atlantic Ocean and 0.5 to 1cm/yr in the Southern Ocean). This is why the Pacific Ocean is wider than the Atlantic Ocean. The ocean topography around Antarctica is thus significantly different from that in the Arctic region where the Eurasian and the North American Continents are connected through a relatively shallow ocean, as recently introduced in the topic “the Relief of the Arctic.” Actually, a strong ocean current, circulates clockwise around Antarctica and connects the three great ocean basins, Atlantic, Indian and Pacific, allowing water, heat, salt and other properties to flow from one basin to the other.
Related sites: |
||||||||||||||||||||