Seen from Space 2004
Detailed Structure of Typhoon No.21 (MEARI) observed by TRMM/PR
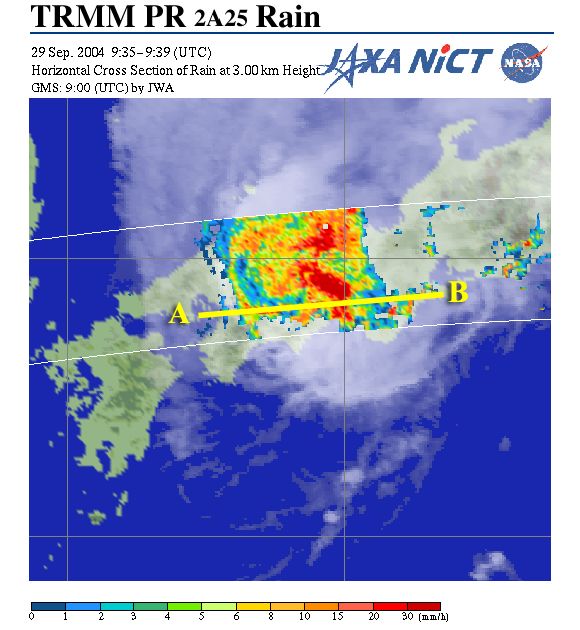
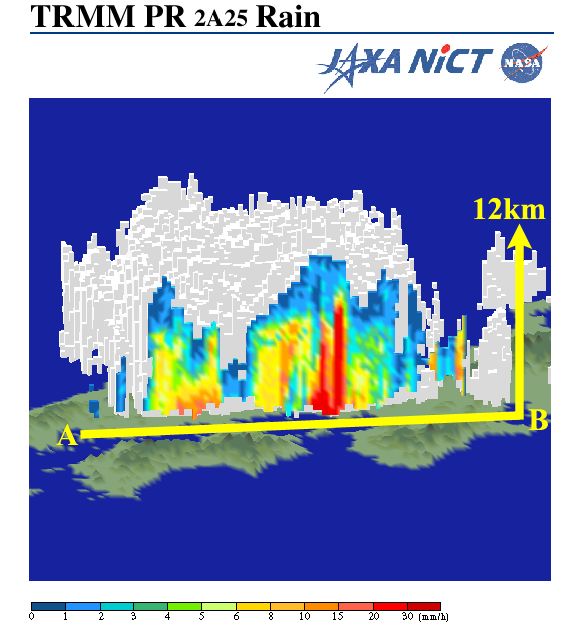
After striking Kushikino City, Kagoshima at 0830 on September 29, 2004, Typhoon No. 21 (MEARI) passed over the Japanese Islands and caused serious damage to Japan. Twenty-seven people were lost or killed by the typhoon. Torrential rain produced more than 130mm an hour over the middle and south of Mie Prefecture. Total rainfall exceeded 900mm over this area and 400mm over some areas of Shikoku and Kinki. The torrential rainfall was caused by the typhoon and an autumnal rain front with merging southerly warm moist flow and easterly flow from the high pressure that was hovering east of Japan. Figure 1 depicts the cloud and rainfall distributions of Typhoon 21 captured around 1830 (JST) on September 29, 2004 by the Precipitation Radar (PR) of the Tropical Rainfall Measuring Mission (TRMM) satellite and GOES-9. The PR can detect the rain rate in the upper atmosphere as well as at the ground surface. Light blue indicates weak rain rates and red indicates strong rain rates. This figure shows a strong rain rate at a height of 3km over the Shikoku area. Even though the typhoon broke up and weakened after striking land , it still had strong rainfall areas. Over Awajishima Island and Hyogo Prefecture near the center of the typhoon, areas of extremely strong rainfall (the red areas) were observed. Figure 2 shows a three-dimensional structure of the typhoon with a vertical cross section along line A-B in Fig. 1. The strong, high rain cloud brought more than 100mm of rainfall in one hour over Awajishima Island.
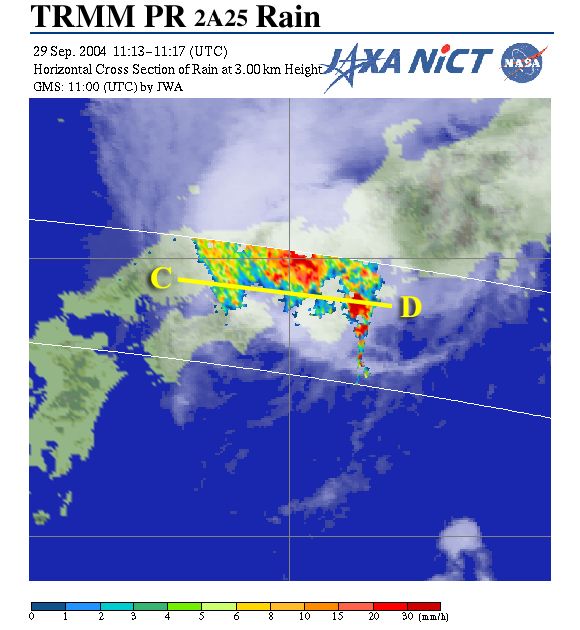
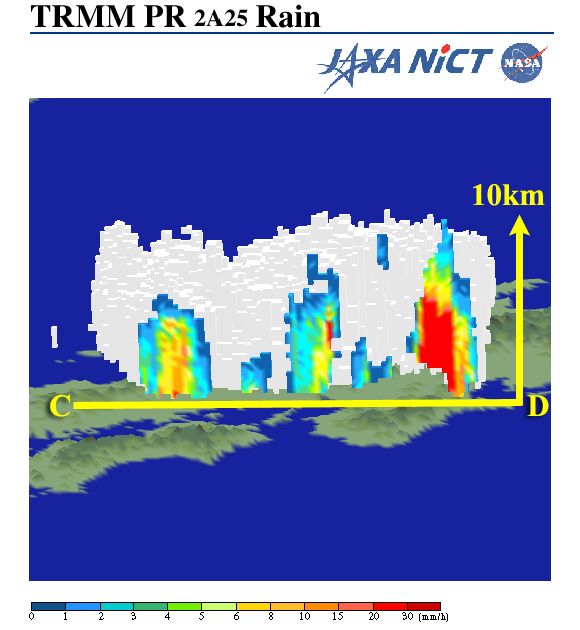
Figure 3 depicts the cloud and rainfall distributions of the typhoon captured around 2000 (JST) on September 29 by PR and GOES-9. The center of the typhoon moved near Biwa Lake and the rain cloud also moved southward. Another area of strong rainfall existed over the middle of Mie Prefecture. Figure 4 illustrates the three-dimensional structure of the typhoon with a vertical cross section along line C-D in Fig. 3. The strong rain cloud existed over the southeastern slope of the Kii Mountains. When typhoons approach the Japan Islands, warm wet air from the southeast is pushed up over the slopes of the mountains in Shikoku and Kii Peninsula and sometimes brings heavy rainfall.
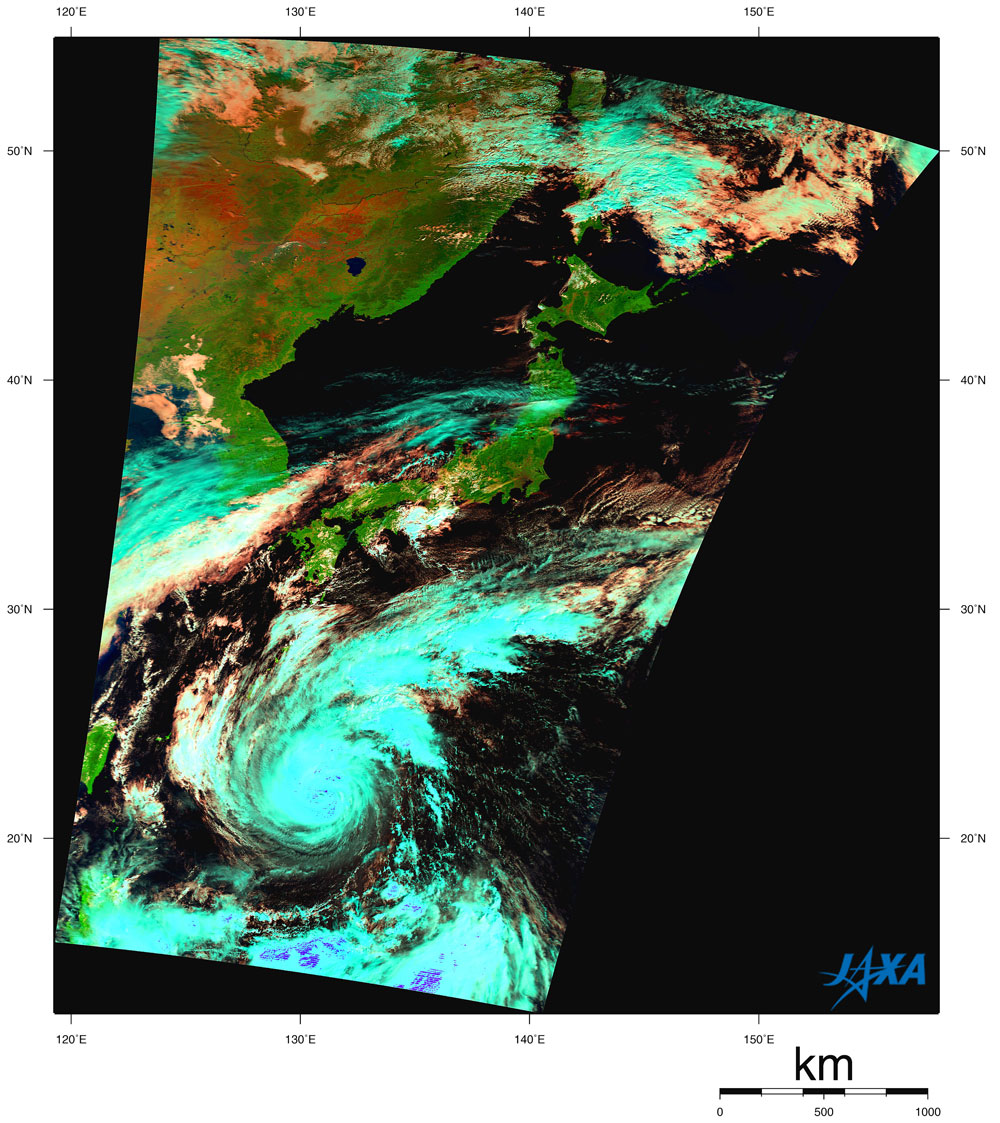
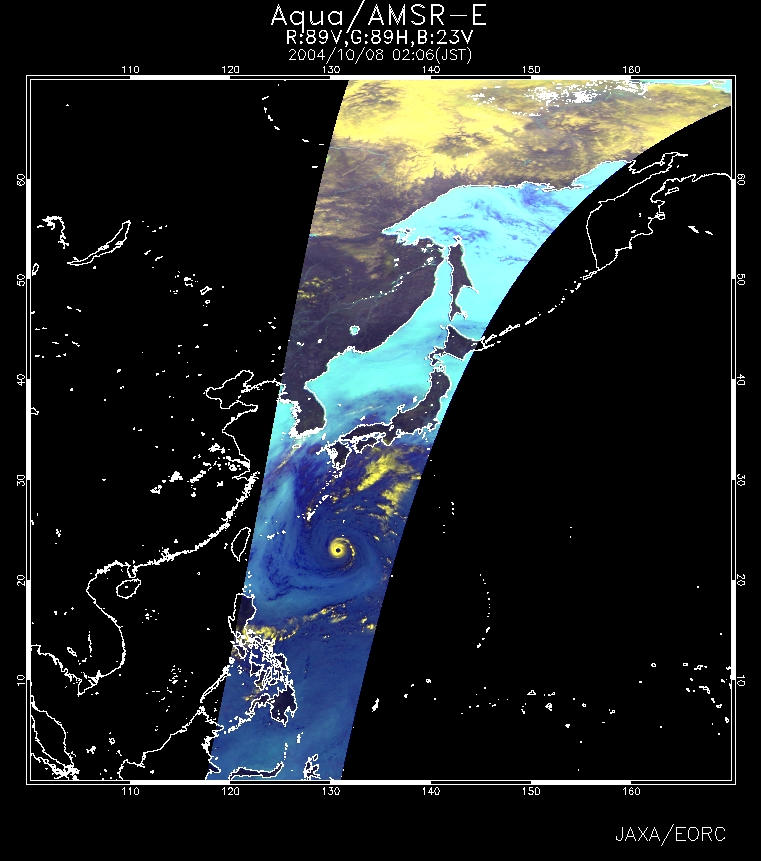
Typhoon No. 22 (MA-ON), the ninth typhoon to touch land this year, struck East Japan on October 9, 2004. Figure 5 presents typhoon No. 22 as observed by MODIS on board the Terra satellite at 1046 (JST) on October 7. A clear spiral cloud was observed around the center of the typhoon. Ice, represented in blue, formed in the high-altitude clouds caused by the typhoon. Figure 6 is an AMSR-E near-real-time image observed at 0206 (JST) on October 8. The dark blue color on the sea surface indicates a large volume of water vapor in the atmosphere. Yellow represents well-developed clouds. You can see that heavy rain fell on the northeast side and around the center of the typhoon.
Related sites: (Please proceed with TRIC or EOC->1 km->RcRefl in a left-hand side window.) |