6.1 Comparison of the PR with Ishigakijima and Okinawa radar.
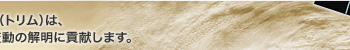
Fig. 6.1
Horizontal pattern of radar reflectivity (attenuation corrected) by the PR (a) and Ishigakijima ground based radar (b) at 2.5km height on May 27, 1998 at around 05:20
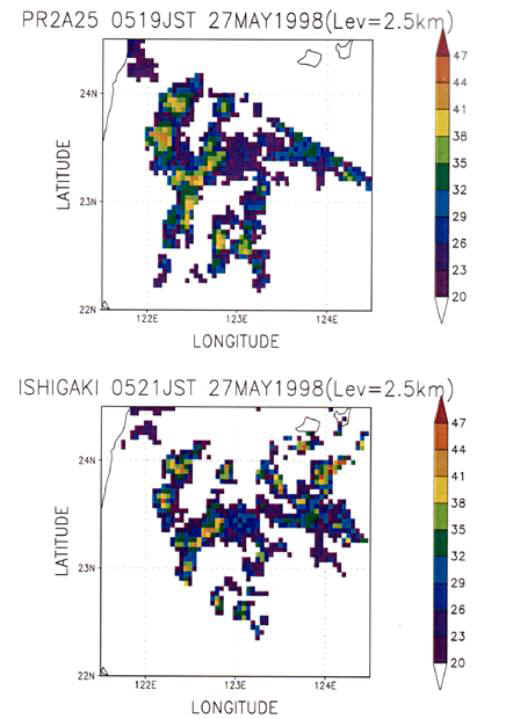
Fig. 6.2
Horizontal pattern of radar reflectivity(attenuation corrected) by the PR (a) and Okinawa ground based radar (b) at 2.5km height on May 27, 1998 around 05:22
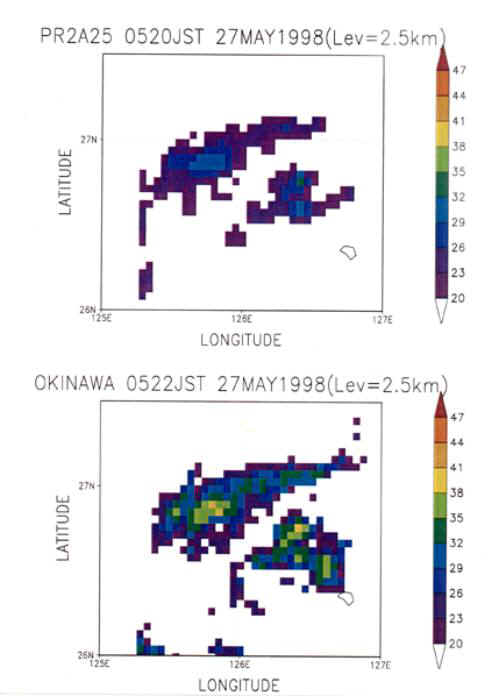
Fig. 6.3
Scatter diagram of the radar reflectivity for the
PR and Ishigakijima radar for the case indicated in the Fig. 6.1
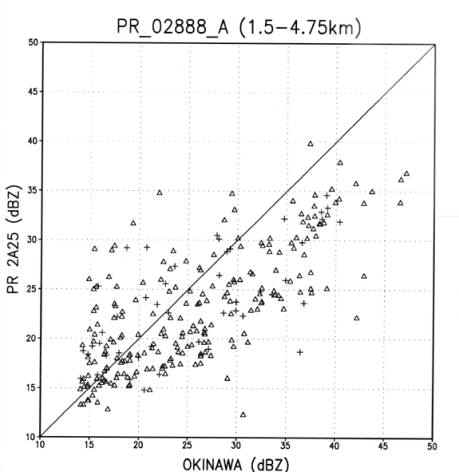
Fig. 6.4
Scatter diagram of the radar reflectivity for the
PR and Okinawa radar for the case indicated in the Fig. 6.2
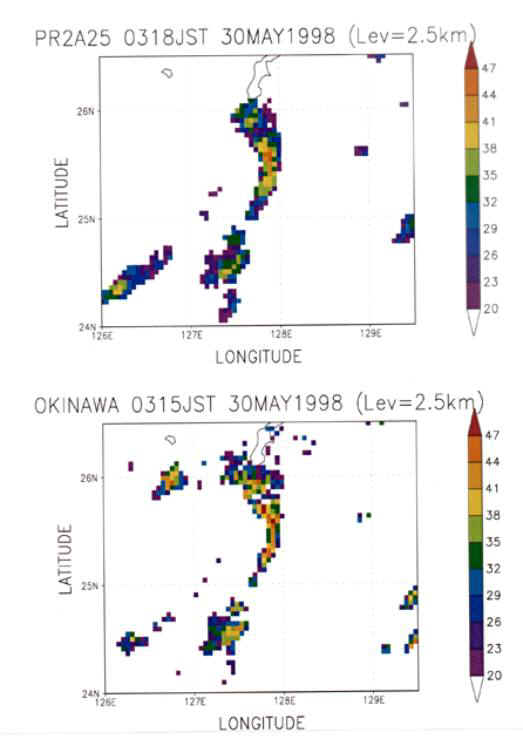
Fig. 6.5
Same as Fig. 6.2 on May 30, 1998 at around 03:17
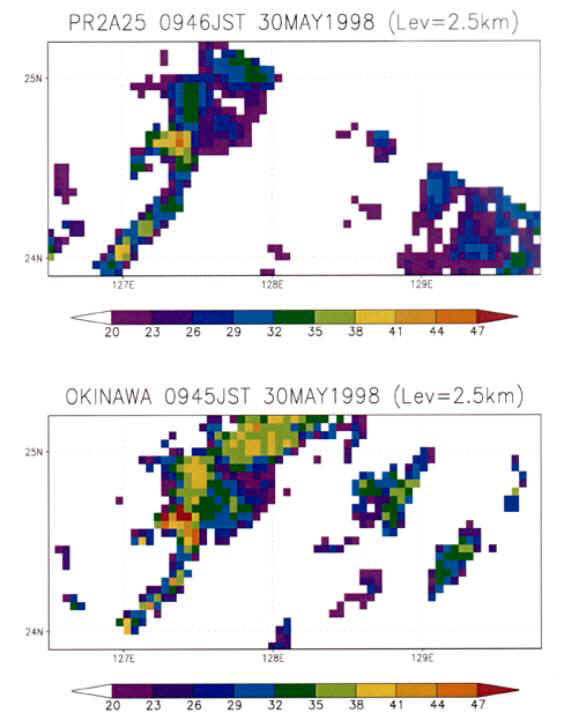
Fig. 6.6
Same as Fig. 6.2 on May 30, 1998 around 09:45
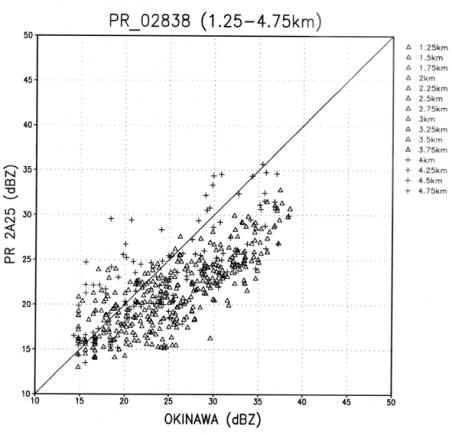
Fig. 6.7
Same as Fig. 6.4 for the case indicated in the Fig. 6.5.
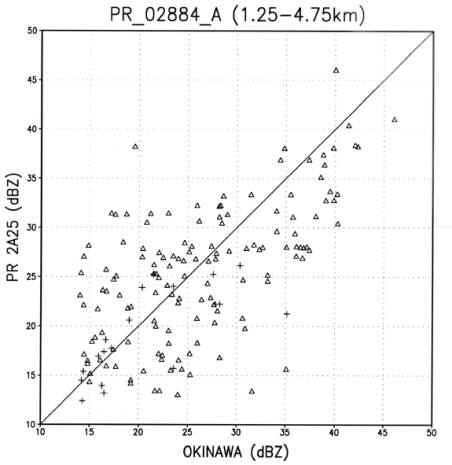
Fig. 6.8
Same as Fig. 6.4 for the case indicated in the Fig. 6.6.
6.2 Comparison of the PR with Keifumaru radar.
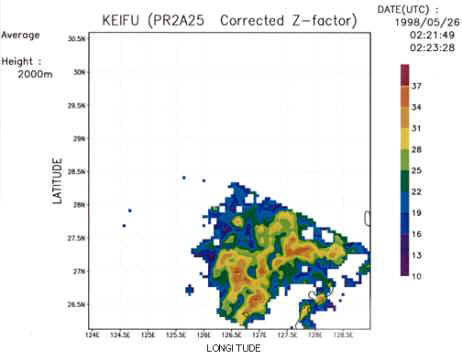
Fig. 6.9
Horizontal pattern of radar reflectivity (attenuation corrected) by the
PR at 2.0km height on May 26, 1998 around 05:23.
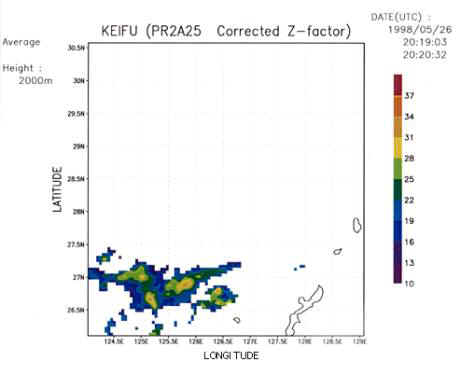
Fig. 6.10
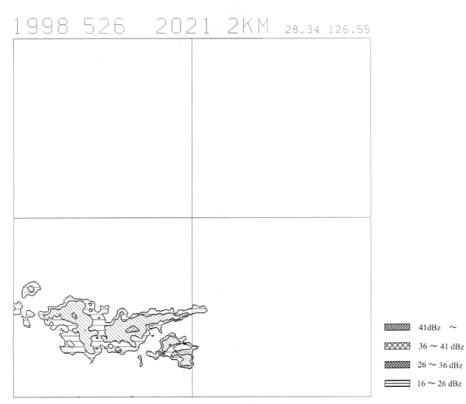
Same as Fig. 6.9 on May 26, 1998 around 20:20.
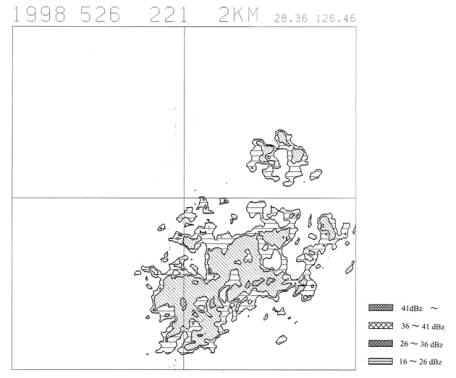
Fig. 6.11
Horizontal pattern of radar reflectivity by Keifumaru at 2.0 km height
on May 26, 1998 around 05:23
Fig. 6.12
Same as Fig.6.11 on May 26, 1998 around 20:20
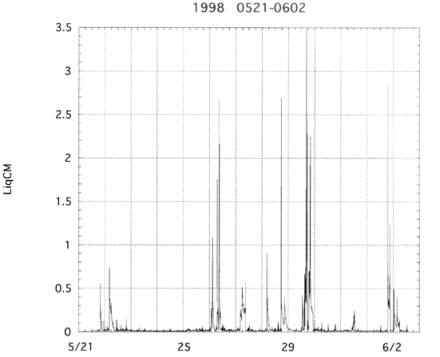
6.3 Microwave radiometer observation.
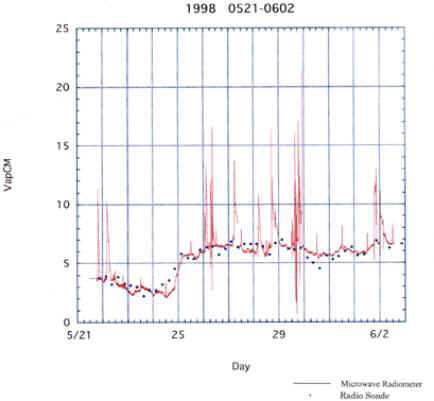
Fig. 6.13
Water vapor content retrieved from the microwave radiometer data and
from upper air sounding at Ishigakijima.
Fig. 6.9
Horizontal pattern of radar reflectivity (attenuation corrected) by the
PR at 2.0km height on May 26, 1998 around 05:23.
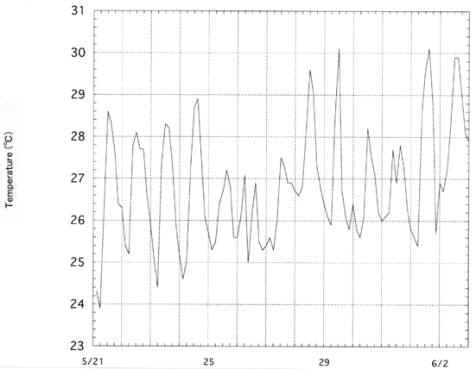
6.4 Surface observation
Fig. 6.15
Surface temperature at Miyakojima meteorological observatory.
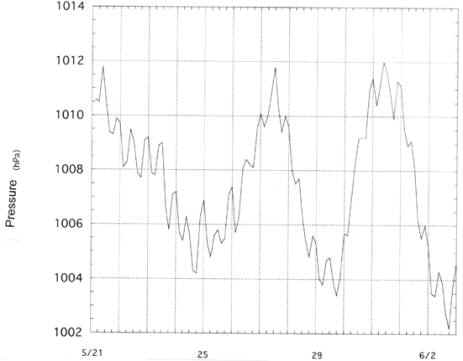
Fig. 6.16
Surface pressure at Miyakojima meteorological observatory.
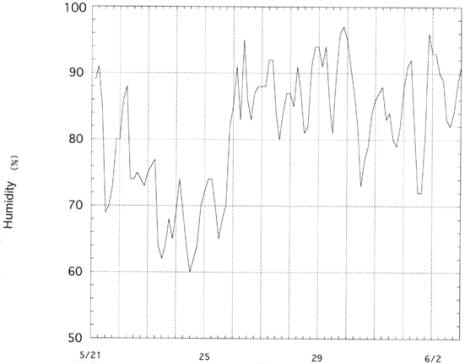
Fig. 6.17
Surface humidity at Miyakojima meteorological observatory.
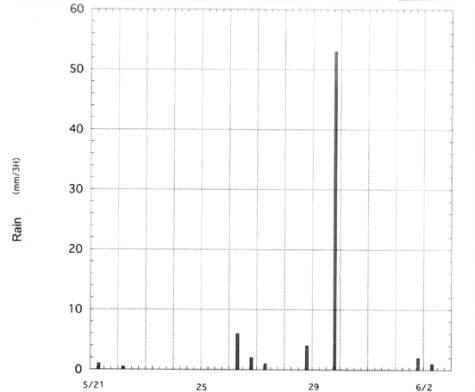
Fig. 6.18
Surface precipitation at Miyakojima meteorological observatory.