Hiroshi Hanado : Communications Research Laboratory
3.1 Outline of CAMPR-D observation flights
During IMCET '98, eleven observation flights were conducted and nine simultaneous rain observations with the PR were achieved. Each flight condition is shown in Table 3.1. CAMPR-D observation parameters are summarized in Table 3.2.
Table 3.1 CAMPR-D observation flights during IMCET '98
| CAMPR-D Observation Flight | Simultaneous Rain Observation with the PR | ||||||
| No. | Date | Objective | Flight Area | Case | TRMM Granule | Time (JST) | Rain Type etc. |
| 1 | May 17 | radar test flight | Around Nagoya | ||||
| 2 | May 23 | Ferry flight #1 | From Nagoya to Tanegashima | (i) | 2779 | 11:47 | Very weak and Small |
| 3 | May 23 | Ferry flight #2 | From Tanegashima to Miyakojima | ||||
| 4 | May 25 | TRMM overpass #1 | Around Ishigakijima | (ii) | 2811 | 12:35 | Small Area |
| 5 | May 26 | TRMM overpass #2 | Around Okinawa | (iii) | 2826 | 11:23 | Large Area Stratiform |
| 6 | May 27 | TRMM overpass #3 | Around Ishigakijima | (iv) | 2842 | 11:46 | Convective |
| 7 | May 28 | TRMM overpass #4 | Around Okinawa | (v) | 2857 | 10:34 | Very Small Single Cell |
| 8 | May 30 | TRMM overpass #5 | Around Miyakojima | (vi) | 2888 | 9:46 | Convective Narrow Rain Band |
| 9 | May 31 | Simultaneous observation with “MIRAI*” | Around Miyakojima | ||||
| 10 | June 25 | TRMM overpass #6 | Around Shikoku | (vii) | 3303 | 17:14 | Large Area |
| 11 | June 26 | TRMM overpass #7 | Around Nagoya | (viii) | 3317 | 14:25 | Small and Weak |
| (ix) | 3318 | 16:02 | Single Cell | ||||
* "MIRAI" is the Japan Marine Science & Technology Center's Oceanographic Research Vessel which has 3-dimensional doppler radar.
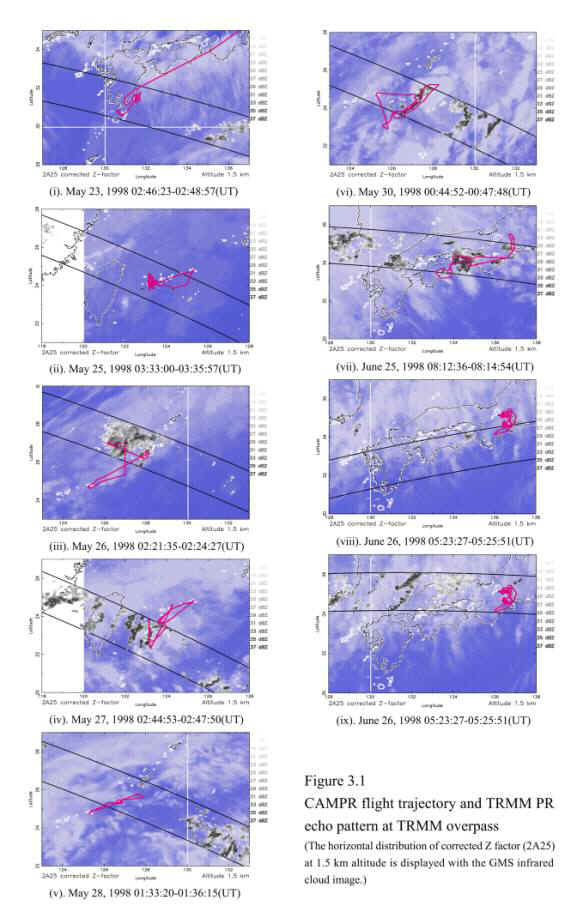
Both CAMPR flight trajectory and the PR rain echo pattern at each TRMM overpass are shown in Figure 3.1. The horizontal distribution of corrected Z factor (2A25) at 1.5 km
Table 3.2 CAMPR-D Observation Parameters at the TRMM Overpass
| Case | Date | TRMM granule | CAMPR | ||||
| Mode | Antenna Scanning | Altitude | Data File Name | Time (JST) | |||
| (i) | May 23 | 2779 | Polarization | -30 to +30 | 8164 m | 0523_09 | 11:37:57-11:54:57 |
| (ii) | May 25 | 2811 | Dual Beam | -30 to +30 | 8666 m | 0525_05 | 12:26:04-12:40:55 |
| (iii) | May 26 | 2826 | Dual Beam | -30 to +30 | 9148 m | 0526_08 | 11:01:15-11:44:14 |
| (iv) | May 27 | 2842 | Polarization | -20 to +85 | 9160 m | 0527_04 | 11:36:20-11:51:35 |
| (v) | May 28 | 2857 | Dual Beam | -45 to +45 | 6245 m | 0528_04 | 10:28:17-10:51:35 |
| (vi) | May 30 | 2888 | Dual Beam | -20 to +85 | 2908 m | 0530_08 | 09:31:02-09:56:16 |
| (vii) | June 25 | 3303 | Dual Beam | -45 to +45 | 9509 m | 0625_05 | 17:01:02-17:18:27 |
| (viii) | June 26 | 3317 | Dual Beam | -20 to +85 | 9213 m | 0626_06 | 14:21:02-14:25:52 |
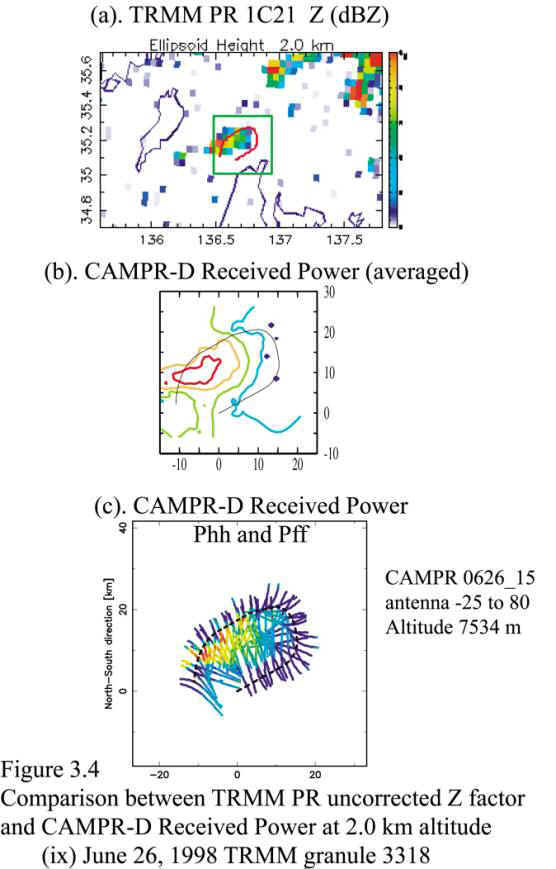
| (ix) | June26 | 3318 | Dual Beam | -25 to +80 | 7534 m | 0626_15 | 15:54:25-16:03:51 |
altitude is displayed with the GMS infrared cloud image. During IMCET'98 (May 23-May30), the weather conditions were not good for simultaneous rainfall observation between the PR and CAMPR-D. At three cases: (i) May 23, (ii) May 25, and (v) May 28, rainfall area was very sparse. In the case (iii) May 26, stratiform rain area was uniformly extended over the East China sea to the west of Okinawa island. At both (iv) May 27 and (vi) May 30 cases, convective rain was observed. During IMCET'98-nagoya (June 25,26), two observation flights were conducted and three simultaneous observations were succeeded. In the case (vii) June 25, large rainfall area was observed over land at the north part of Shikoku. Both (viii) and (ix) June 26 cases were sporadic rain cell.
3.2 Comparison of vertical cross-section
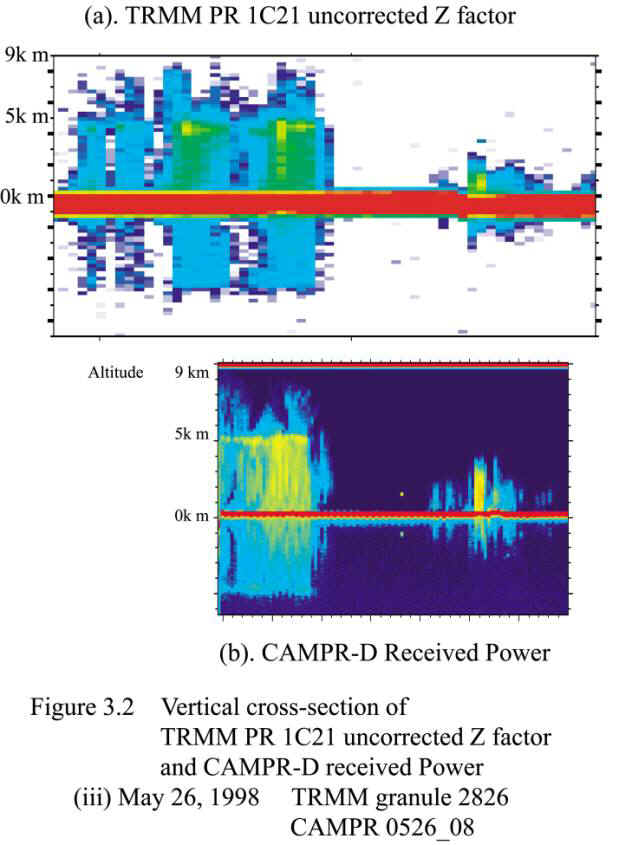
In the Figure 3.2, vertical cross-section of the PR 1C21 uncorrected Z factor (Figure 3.2 (a)) and CAMPR-D received power (Figure 3.2 (b)) are shown. Though the airplane installed CAMPR-D took about 20 minutes to fly along the TRMM track direction, both echo patterns correspond well with each other.
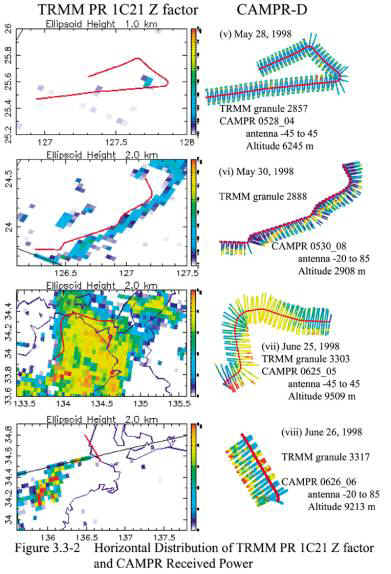
3.3 Comparison of horizontal cross-section
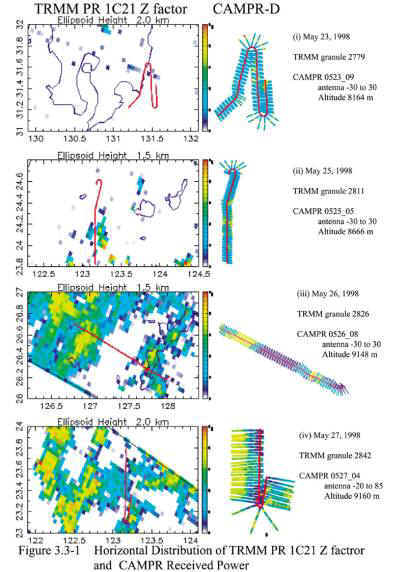
In the Figures 3.3-1, 3.3-2 and 3.4, horizontal cross-section of the PR and CAMPR-D are shown. These images indicate that good correspondence exists between the PR rain echo pattern and that of CAMPR-D. However, the observation area of CAMPR-D is very limited compared with that of the PR, it is not so effective to compare both images directly. Some statistical approach, such as the Contoured Frequency by Altitude Diagrams (CFADs) may be suitable.
 |
 |