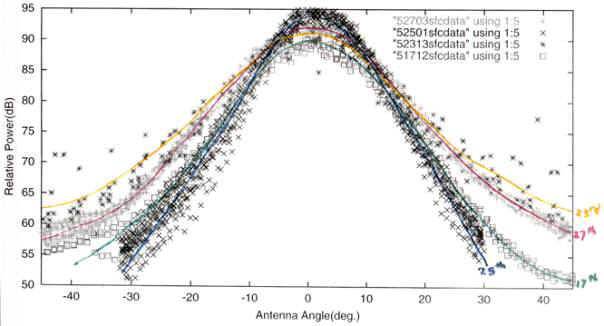
Fig. 2.1 Day-to-day variation in sea-surface characteristics in nearly rain-free areas.
Kenji Nakamura : Nagoya University
2.1 Sea-surface measurement by CAMPR-D
The normalized surface cross section of the ocean surface is one established source for radar system calibration. Weather radars are designed for targets uniformly distributed in pulse volume while the surface is a two-dimensional target. The exact shape of the surface echo itself is thus a complex function. The CAMPR-D antenna is designed to scan from nadir to the near horizon, which enables obtaining surface characteristics over a very wide angle with a constant antenna pattern. The flight measurements were performed on the open sea where the influences of coastlines and the bottom of the sea on the surface conditions may be neglected. The influences of clouds can nearly be neglected. We tried to select data in nearly rain-free areas. The sea-surface backscattering strongly depends on the surface wind conditions, but we do not have wind field data for that location. Furthermore, the sea-surface backscattering depends not only on the wind conditions but also on the incidence angle, polarization and wavelength. It also depends on the sea-surface slope, the swell direction relative to the wind direction, the air-sea temperature, the sea-surface temperature, the surface current, surface slicks, coastline bottom features, and internal waves.
The surface echo can be obtained at the gate with the biggest echo or an average of those gates that intersect the surface. Figure 2.1 shows the day-to-day variations in the sea-surface characteristics in nearly rain-free areas. There is some variation of measured power though the radar parameters (e.g. Pulse Repetition Frequency) are similar. As we mentioned earlier, the ocean surface is roughened by the wind and waves, and even light winds will roughen the ocean sufficiently to cause fluctuations in reflected energy. According to Jones et al. (1977) and Schroeder (1982), the s0 is almost constant for all wind speeds at 10 deg. incidence. CAMPR-D's sea-surface measurements show some agreements with these results. Some data, e.g. on May 17, have systematic reduction (denoted by squares). The reason is not clear. Generally, quasi-specular scattering is considered predominant in this incident angle region (Valenzuela, 1978).
Figure 2.2 (left) shows the peak power measured by CAMPR-D for the integral mode data. Data were obtained by scanning the antenna angle over ± 30 deg. centered at the nadir. Figure 2.2 (right) shows the peak power measured by CAMPR for I, Q mode by scanning the antenna stepwise over ± 45 deg. This corresponds somewhat with integral mode data. According to Masuko et al. (1986), s0 increases with some power of wind speed. As we mentioned earlier, we do not have wind data for that location. Also, the aircraft changes altitude, so the peak surface echo may be poorly estimated. The aircraft roll and pitch also affect surface signatures. In our case, we did some correction for aircraft roll and selected data in nearly rain-free areas. At nadir incidence, we have a greater difference of the measured powers for two observation modes due to saturation of the radar signal for I, Q mode, as shown in Figure 2.3. The range gate '98' is the peak surface bin. For nearly vertical incidence, the strongest backscattering from the sea for the angles of incidence beyond about 20 deg. is governed by Bragg scattering (Uraby, 1982). The ocean surface, wave height and surface roughness can change significantly from day to day. We compared the datasets which are immediately adjacent to each other or same location when rain was absent.
Figure 2.4 shows another example of the variation of the measured relative backscattering cross section s0 as a function of radar incidence angle for CAMPR-D. We assumed a Gaussian antenna pattern in calculating relative s0, but we have some discrepancy. It also shows the backscattering cross section dependence on polarization. According to Masuko et al. (1986), for incident angles smaller than 20 deg., the s0 for HH polarization is slightly larger than for VV polarization because the effective reflection coefficient for HH polarization is larger than that for VV polarization. This agrees well with CAMPR-D relative s0 measurements.
According to Meneghini et al. (1998), the smallest standard deviations of rain-free normalized radar cross section (NRCS) over the ocean occur at incidence angles from 3 deg. to 7 deg. with a minimum of 1.36 dB at 4.26 deg. for the PR. At nadir incidence, the mean value of the NRCS is 12.91 dB with a standard deviation of 2.03. This larger standard deviation seems to be due to wind. Although the PR derived s0 is from global measurements, it corresponds with CAMPR-D sea-surface measurements. Figure 2.5 (a) shows ocean backscattering measurement from the PR 1C21 for the Miyakojima area during IMCET'98. The CAMPR-D antenna scans mechanically to produce a constant antenna pattern over the swath, making calibration easier. In contrast, PR scans electronically in cross-track direction. Electronic scanning generally implies greater complexity as well as difficulties in calibration due to changes in the beamwidth, and therefore changes in the radar constant with incidence angle (Meneghini and Kozu, 1990). Although the scanning direction is different, the PR measured ocean signatures, i.e., profile, are consistent with CAMPR-D sea-surface measurements as shown in Figure 2.5 (b).
2.2 Comparison of CAMPR-D and ground-based radars
We compared the intensities of rain echoes measured by CAMPR-D with those measured by JMA's ground-based radars. We have 2.5 km ´ 2.5 km grid data from the ground-based radars. The horizontal resolution of the PR is nearly 4.3 km at nadir while CAMPR-D has very nice resolution data. Therefore, we have some complications in determining pairs of data for comparisons. We simply selected the pairs by matching their positions in the case of CAMPR-D (nadir) with ground-based radars. For data selection, averaging was performed over CAMPR-D samples which lie within the PR pixel size.
The comparison between Okinawa radar and CAMPR-D is shown in Figure 2.6. There seems some correlation. Figure 2.7 compares Ishigakijima radar and CAMPR-D. These seem to correlate well although there is some temporal mismatching. One reason for the discrepancy in radar comparisons might be the radar calibration factor for CAMPR-D, which was not considered in the radar equation in these analyses.
To summarize the data comparison, we found some correlations between CAMPR-D and ground-based radars.
References
Jones, W. L., L. C. Schroeder and J. L. Mitchell (1977): Aircraft measurements of the microwave scattering signature of the ocean, IEEE Trans. Antennas Propag., AP-25 (1), 52-61.
Schroeder, L. C., D. H. Boggs, G. Dome, I. M. Halberstam, W. L. Jones, W. J. Pierson and F. J. Wentz (1982): The relationship between wind vector and normalized radar cross section used to derive Seasat-A satellite scatterometer winds, J. Geophys. Res., 87 (C5), 3318-3336
Valenzuela, G. R. (1978): Theories for the interaction of electromagnetic and ocean waves - A review, Boundary Layer Meteorol., 13 (1-4), 277-293.
Masuko, H., Okamoto, K., Masanobu, S., Shuntaro N. (1986): Measurement of microwave backscattering signatures of the ocean surface using X Band and K Band airborne scatterometers. J. Geophy. Research, Vol. 91, No. C11, pp. 13065-13083.
Ulaby, F. T., Moore, R. K. and Fung, A. K. (1982): Microwave Remote Sensing Vol. II, Addison-Wesley Pub., 1064pp.
Meneghini, R., Iguchi T., Kozu, T., Okamoto, K., L. Liao, J. A. Jones (1998): Use of the surface reference technique for path attenuation estimates from the TRMM radar. Proc. of Symposium on the Precipitation Observation from Non-Sun Synchronous Orbit, Nagoya, Japan, pp.163-168.
Meneghini, R. and Kozu, T. (1990): Spaceborne Weather Radar. Arctech House, 199pp.
Fig. 2.1 Day-to-day variation in sea-surface characteristics in nearly rain-free areas.
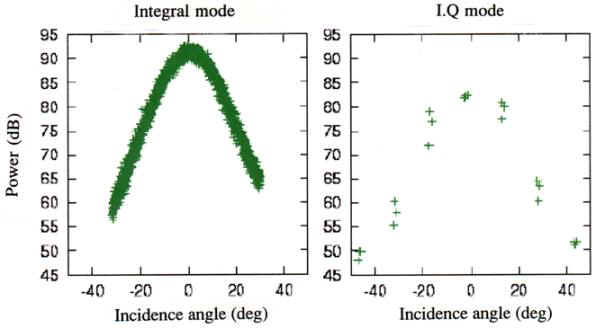
Fig. 2.2 Peak power measured by CAMPR-D; left for Integrated mode and right for I, Q mode.
Datasets are immediately adjacent to each other were compared on 26 May 1998.
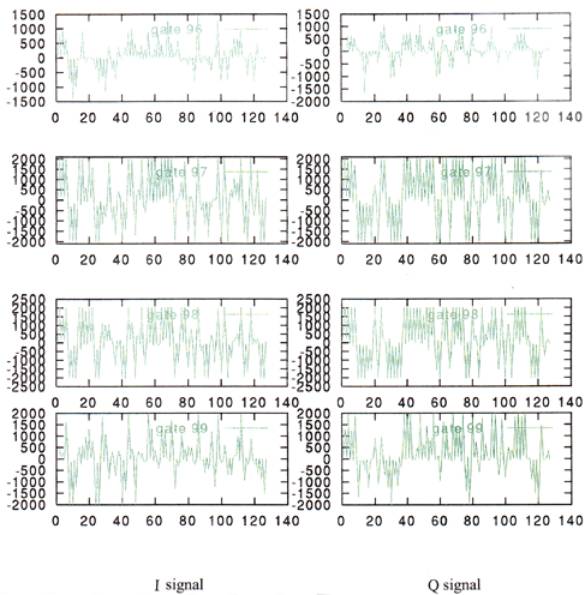
Fig. 2.3 Saturation of I or Q signal at peak surface bin for nadir incidence.
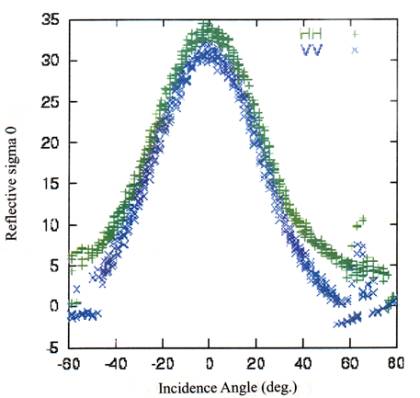
Fig. 2.4 Relative s0 measured by CAMPR-D during IMCET.
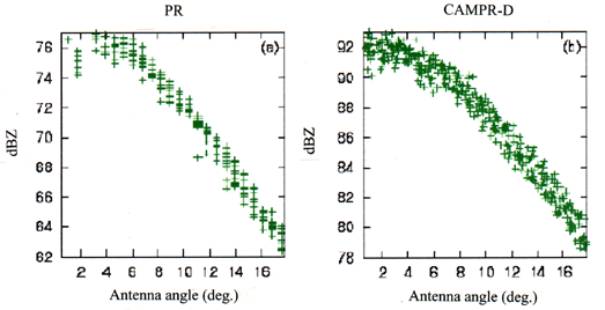
Fig. 2.5 Simultaneous measurements by PR and CAMPR-D.
(a) Peak surface radar reflectivity factor by PR.
(b) Peak surface relative radar reflectivity factor by CAMPR-D on 26 May 1998.
Fig. 2.6 Scatter diagram between Okinawa radar and CAMPR-D on 26 May 1998.
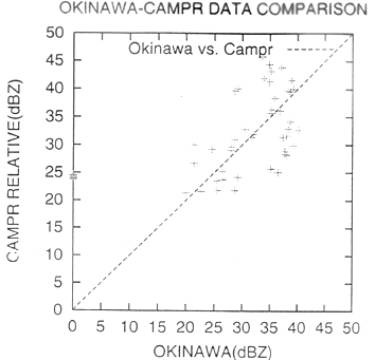
Fig. 2.7 Scatter diagram between Ishigakijima radar and CAMPR-D on 27 May 1998.