What happens when you combine Google Earth and TRMM?
TRMM gets realtime world Typhoon information. And, Google Earth can show this data by image overlays. You can become a Typhoon Chaser by using Google Earth with TRMM.
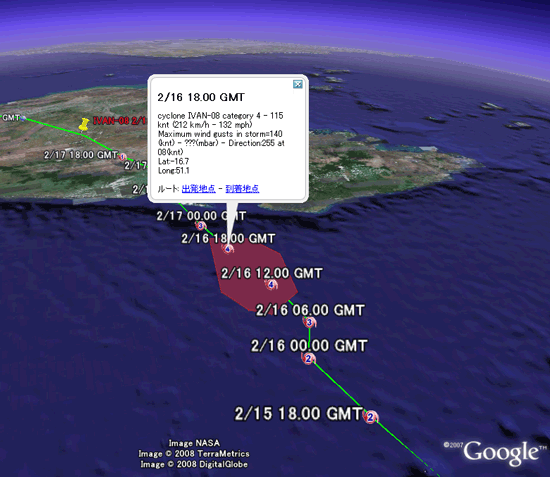
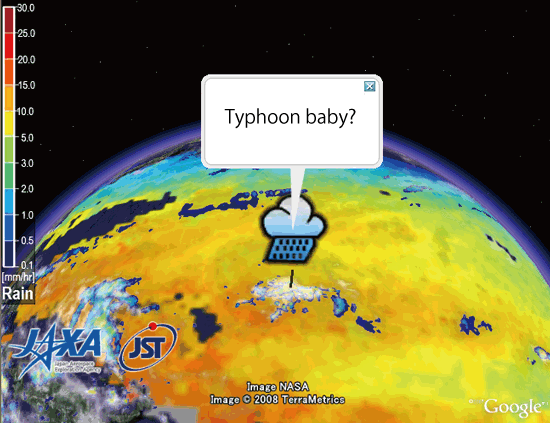
 a) Find a baby typhoon
-
 Where do typhoons come from ?
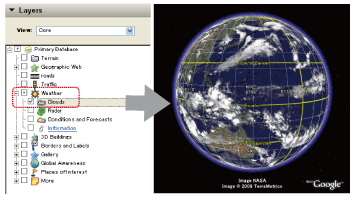
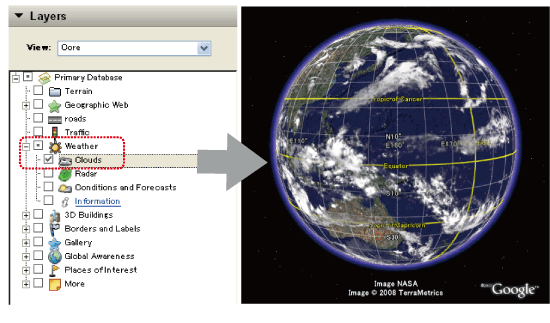
Google Earth has "Weather/Clouds" Layer, which shows the realtime cloud movement of the world. Using this layer, look around where the typhoons likely are.
Where do typhoons come from ?
Google Earth has "Weather/Clouds" Layer, which shows the realtime cloud movement of the world. Using this layer, look around where the typhoons likely are.
- b) Cloud movement
-
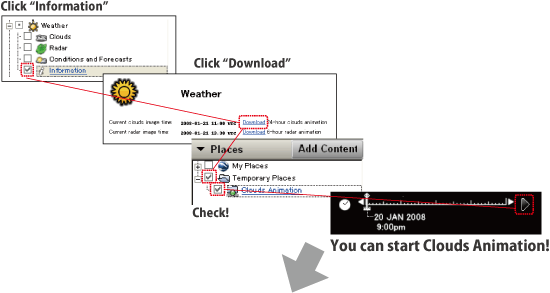
To move the clouds on a time line, get cloud animation KML from Information layer.
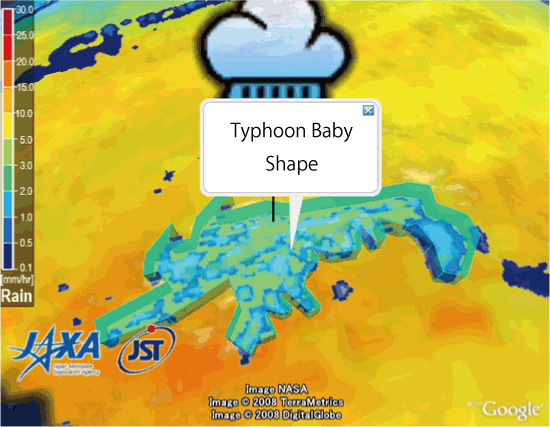
- c) Precipitation structure
-
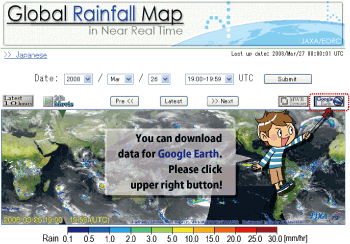
GSMaP (Global Satellite Mapping of Precipitation) shows precipitation information of the world. Check out precipitation map from GSMaP on Google Earth by following those steps...
- d) sea surface temperatures
-
Typhoons get their energy from warm sea areas.
By clicking the following button, check the images of sea surface temperatures. Yellow and orange areas are over 26 degrees C, where babie typhoons can be generated.
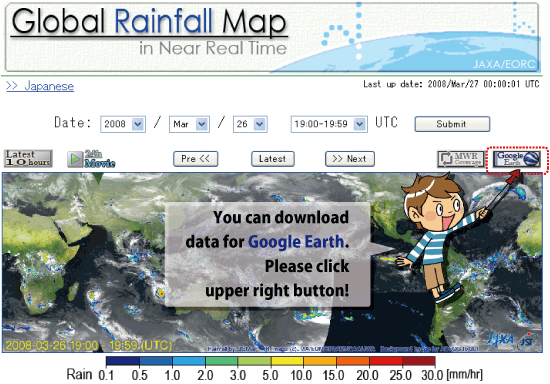
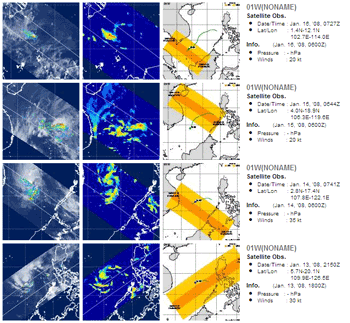
- a) Hurricanes - Live positions
-
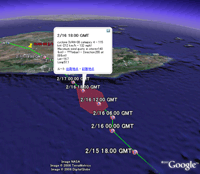
In the last session, you watched clouds, precipitation and sea surface temperature.You may imagine a baby typhoon position from those layers.
To check it, check the following KML files. These will show the positions of typhoons.
 Google Earth can show global positions easily.
Typhoon and Huriicanes has been generated somewhere in the world all year round.
Google Earth can show global positions easily.
Typhoon and Huriicanes has been generated somewhere in the world all year round.
- b) Try to find a baby typhoon
-
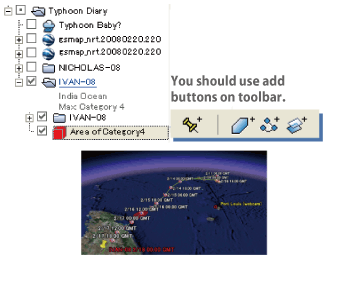
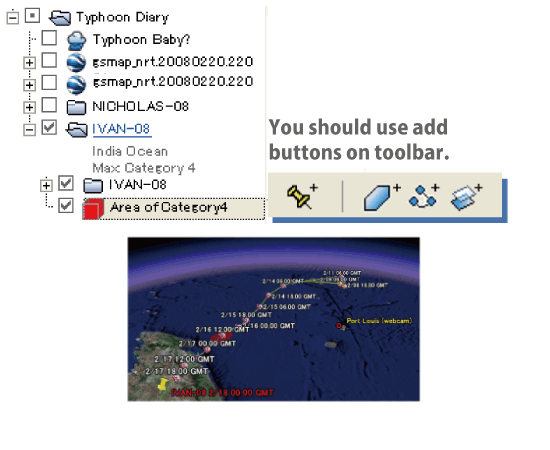
If you can find a baby typhoon, try to add it as a placemark, with your original name for the baby typhoon.
- c) Write some placemarks
-
Google Earth can put your information as a placemark, polygons and lines. Polygons express geo-information as area, and lines express as linear element like a front line. You can add those information in My Places panels.

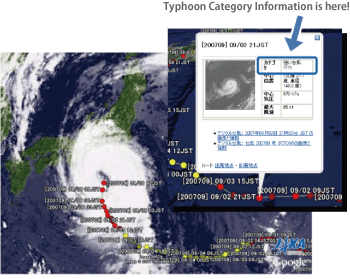
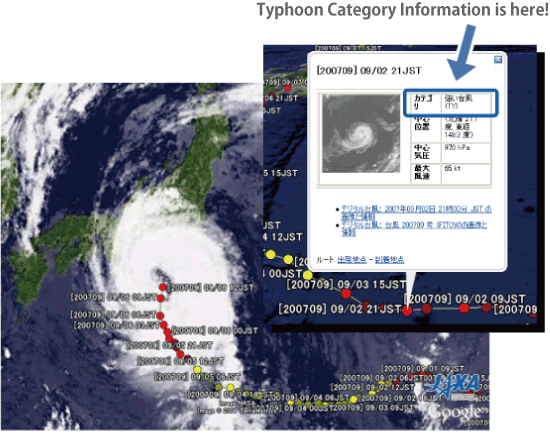
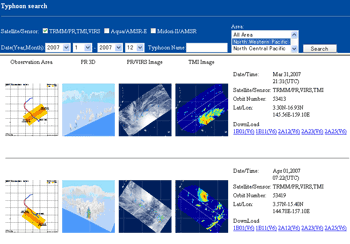
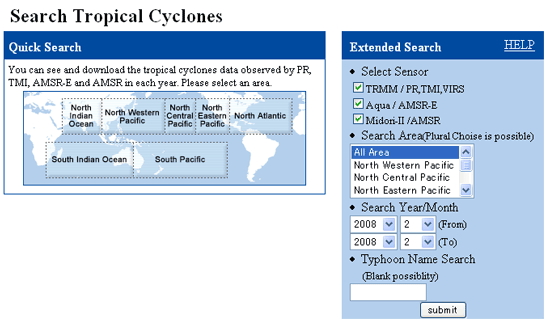
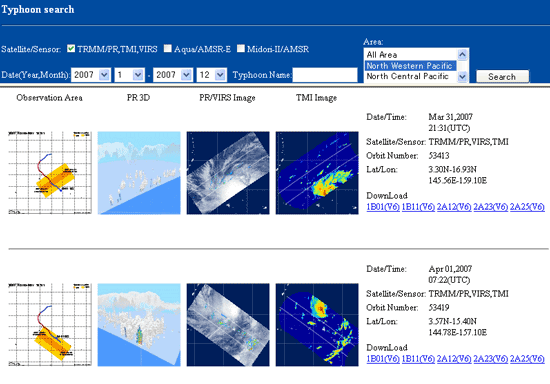
- a) JAXA/EORC Tropical Cyclone Monitoring
-
If your baby typhoon grow to bigger size, it will check by some organization like JAXA/EORC Tropical Cyclones Database. It has provided Latest Images.


Of course, you can use those images for your Typhoon diary.

- b) Digital Typhoon
-
In Japan, There is Digital Typhoon web site. It has archived Typhoon information.
You can also use some data set as KML.
- c) Radar and Precipitation Nowcast: Japan
-
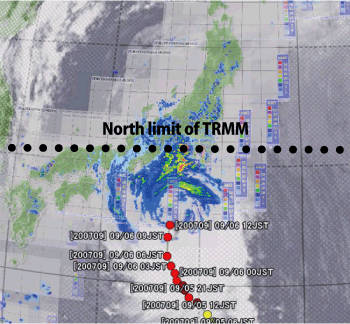
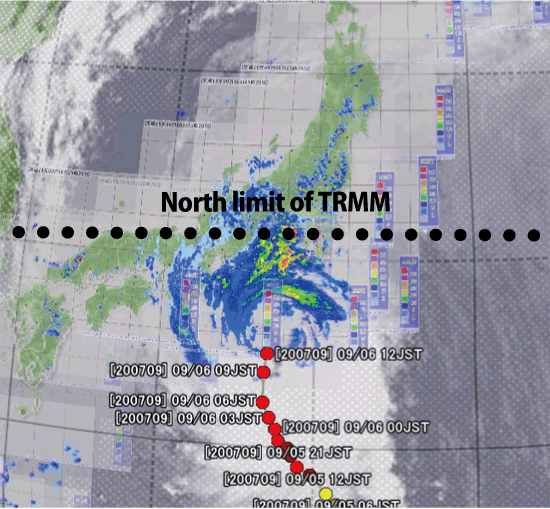
In Japan, We can get the Radar and Precipitation Nowcast data set from Japan Meteorological Agency.
TRMM PR data can't observe North side japan. but Radar and Precipitation Nowcast data can do all Japan.
You can watch precipitation area by both data.
- d) Compare Typhoon and Hurricane
-
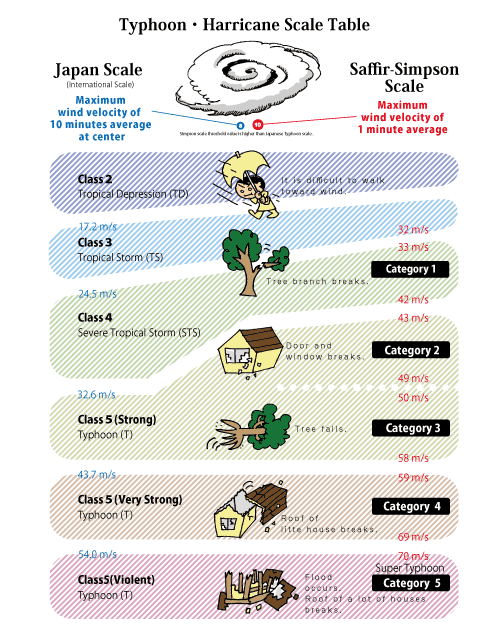
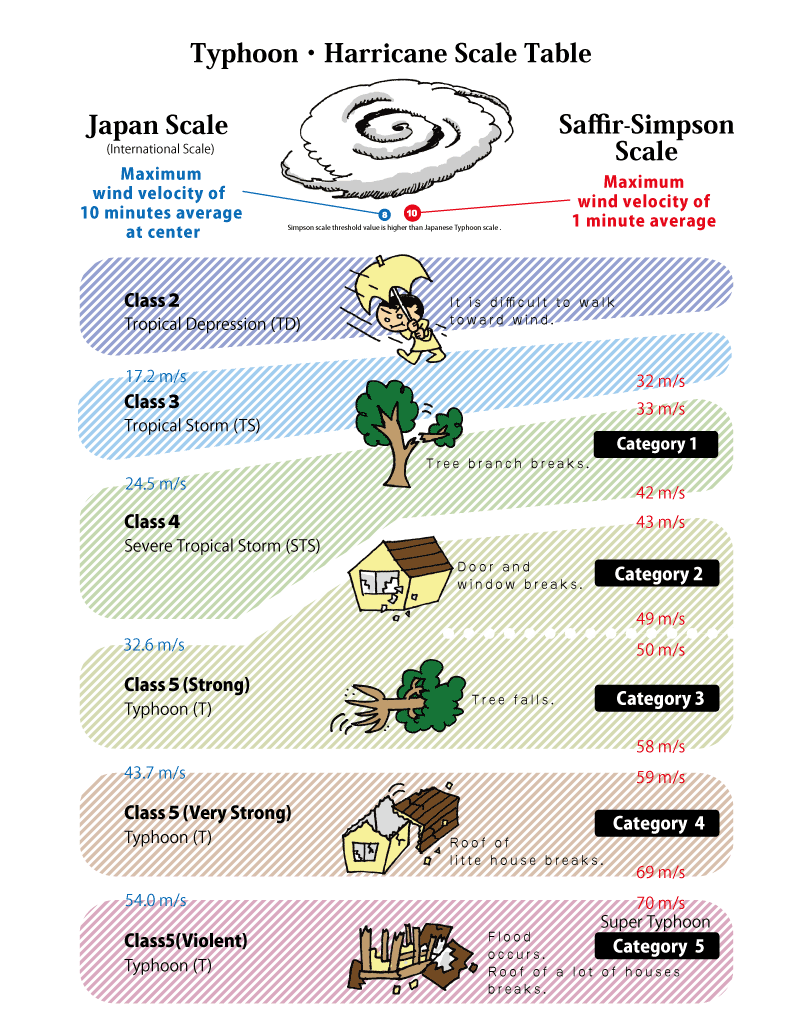
Typhoon and Hurricane have scale of wind speed. But, each units has difference a little. Typhoon scale is Tropical Cyclone Classifications (all winds are 10-minutes averages). Otherwise, hurricane has Saffir-Simpson Hurricane Scale(all winds are 1-minute averages). 1-minute averages is high more than 10-minutes average. You should understand this unit means.

- a) Save as KML
-
You know, Google Earth can write your placemark. And it can save as a KML file. You should save it for your Typhoon diary.
You can save a KML by right-click [Save As] menu.
- b) Compare Typhoon size
-
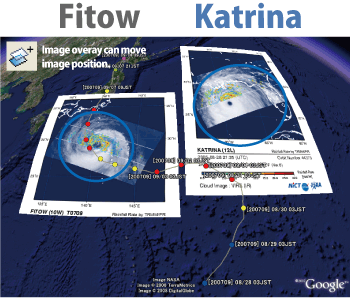
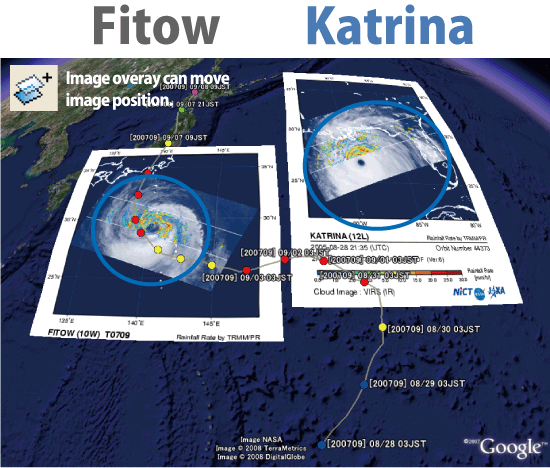
Google Earth can move Typhoon image to other place. So, if you don't understand scale for Typhoon and Hurricanes. You should move it to near area in japan.
Example, you can move the Hurricane Katrina to Japan.
 Hurricane Katrina on Japan area
- c) Complete a Typhoon diary
-
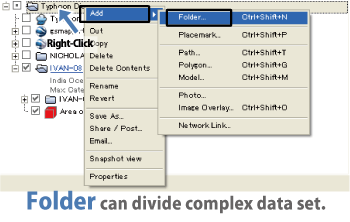
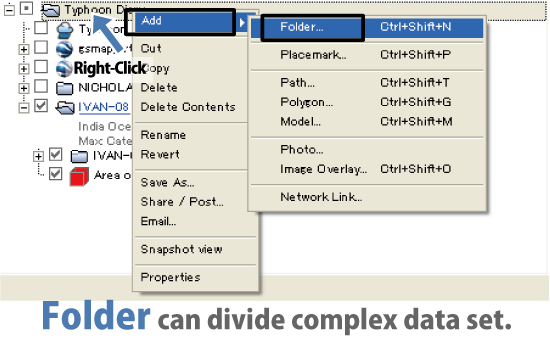
You should make folder for Typhoon diary. And make/modify this folder structure. If you complete a Typhoon diary, You should save a KML file.
- a) Archives since 1997(launch TRMM)
-
EORC Tropical Cyclone Database is a Typhoon information library for archive.
This site can search images and some meta data since 1997. TRMM satellite launched in 1997. You can remember and compare some major past Typhoon.
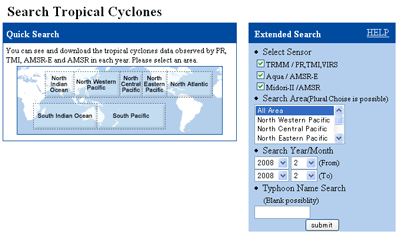
Some data has 3D CG movie. You can show it.
- > b) Archives before TRMM launch
-
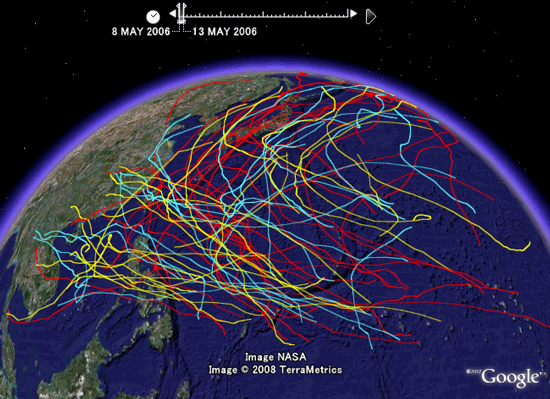
Digital Typhoon web site has archived past Typhoon data since 1951. You can download those data as KML file. And, you can show all Typhoon tracks near in Japan.
Follow figure is past Typhoon tracks, in 2006(Yellow), 2005(Blue), 2004(Red).

Major tracks route is turned right curve. And you can show movie by time scale.
- > c) Unusual Track Archives
-
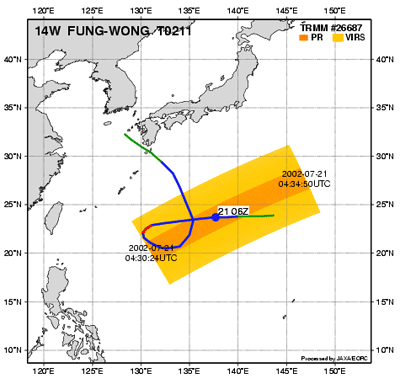
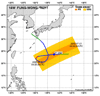
Rotate track "Typhoon FUNG-WONG(14W)"
Typhoon No.11 in 2002 moved anti-clockwise to East China Sea via Yakushima and Tanegashima Islands.
Typhoon FUNG-WONG(14W)
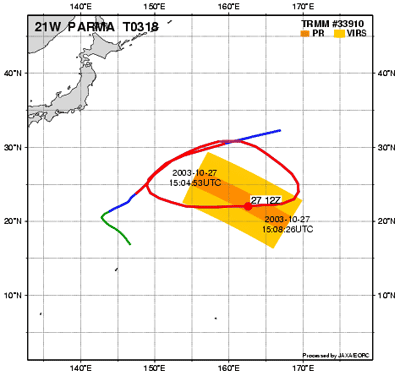
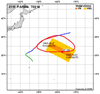
Rotate track "Super Typhoon PARMA(21W)"
Typhoon PARMA in 2003 moved clockwise on Pacific Ocean.
Super Typhoon PARMA(21W)
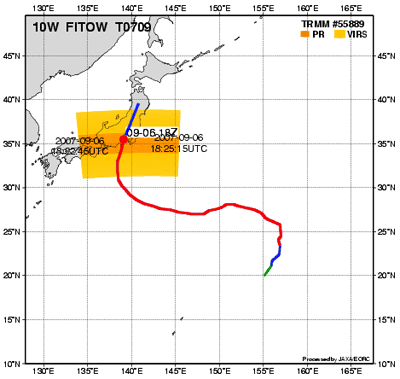
Great S Curve "Typhoon FITOW(10W)"
Typhoon FITOW in 2007 moved to Japan. It was not strong, but it moving speed was very slow. In Japan, FITOW caused many land slide in this year.
Typhoon FITOW(10W)