Research Products
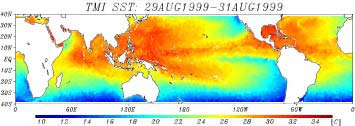
| Sea Surface Temperature | |
 |
|
| Figures are sea surface temperature maps measured by TRMM Microwave Imager (TMI), showing 3-day running mean for Aug 29 to 31, 1999. |
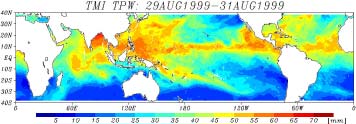
| Total Precipitable Water | |
 |
|
This figure is a global precipitation map measured by TMI, showing three-day running mean for Aug. 29 to 31, 1999.
|
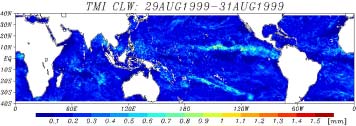
| Cloud Liquid Water | |
 |
|
The figure is a global cloud water map measured by TMI, showing three-day running mean from Aug. 29 to 31, 1999. |
- Standard Products ・・ Samples
- Research Products ・・ Samples
- Comparison of TMI and VIRS Sea Surface Temperature