- Top
- Archives
- Precipitation climatology (10-year mean) observed by the Global Precipitation Measurement (GPM)
- GPM/DPR climatology of surface precipitation distribution
GPM/DPR climatology of surface precipitation distribution

Figure 1: Climatological values of surface precipitation distribution by GPM/DPR. The period is 10 years from March 2014 to February 2024. The unit is mm/30 days.

Figure 2: Climatological values for the Northern Hemisphere winter (December, January, February)

Figure 3: Climatological values for northern summer (June, July, August)
The climatological values of the surface precipitation distribution by GPM/DPR shown in Figures 1-3 show the same pattern as the climatological values by GSMaP. For an explanation of these precipitation distributions, please refer to the GSMaP page. Precipitation Radar (PR) onboard the TRMM satellite has advanced climatological research on precipitation systems in the tropics and subtropics. PR has clarified the diurnal cycle of precipitation, frequently found in the tropics, typical precipitation systems (e.g., height and size) in each region, and statistics on extreme precipitation. The observation area of GPM/DPR has been expanded to mid-to-high latitudes, making it possible to observe snowfall in high latitudes. As a result, it has been possible to capture precipitation distributions in the mid-to-high latitudes that could not be observed by TRMM/PR, such as active precipitation in coastal areas such as the coasts of Chile and Alaska. Global precipitation science is advancing through the observations of GPM/DPR. For details, please refer to the presentation file of Professor Emeritus Y. N. Takayabu of the University of Tokyo. GPM/DPR is characterized by its ability to ① determine precipitation characteristics and ② distinguish rain and snow particles by observing the three-dimensional structure of precipitation using radio waves of two different frequencies. These climatological values are shown below.
① Climatological values of precipitation characteristics
Precipitation that is weak but falls over a long period of time and heavy rain that falls within a few hours have different precipitation characteristics. Precipitation is classified into two types, stratiform and convective, based on the strength of the updraft, horizontal and vertical extent, and time scale. Stratiform precipitation is widespread and persistent, while convective precipitation is localized and temporary. Stratiform precipitation is typically precipitation from nimbostratus clouds that spread ahead of a low-pressure system, while convective precipitation is typically precipitation from developed cumulus clouds and cumulonimbus clouds. The precipitation estimation algorithm of the Dual-frequency Precipitation Radar (DPR) onboard the GPM Core Observatory determines whether precipitation is primarily stratiform or convective based on the vertical profile and horizontal pattern of precipitation measured at two frequencies, and estimates the precipitation intensity taking this into account.
Figures 4 and 5 show the distribution of stratiform and convective precipitation, as determined by the DPR. Figure 6 shows the ratio of stratiform precipitation to the total precipitation, with red indicating areas with more stratiform precipitation and blue indicating areas with more convective precipitation, among the areas with more than 600 mm/year. These figures show that in the tropics, convective rain accounts for a large proportion of rainfall over continents and maritime continents. In particular, convective rain is predominant in the central part of the African continent and the Americas in the summer hemisphere. On the other hand, the contribution of stratiform rain is large over the ocean, and in mid-latitude precipitation (the sea east of Japan and the southern part of the South Pacific), more than 60% of the total precipitation is due to stratiform precipitation. In addition, the Intertropical Convergence Zone (ITCZ) over the Pacific Ocean also has a large contribution of stratiform precipitation.
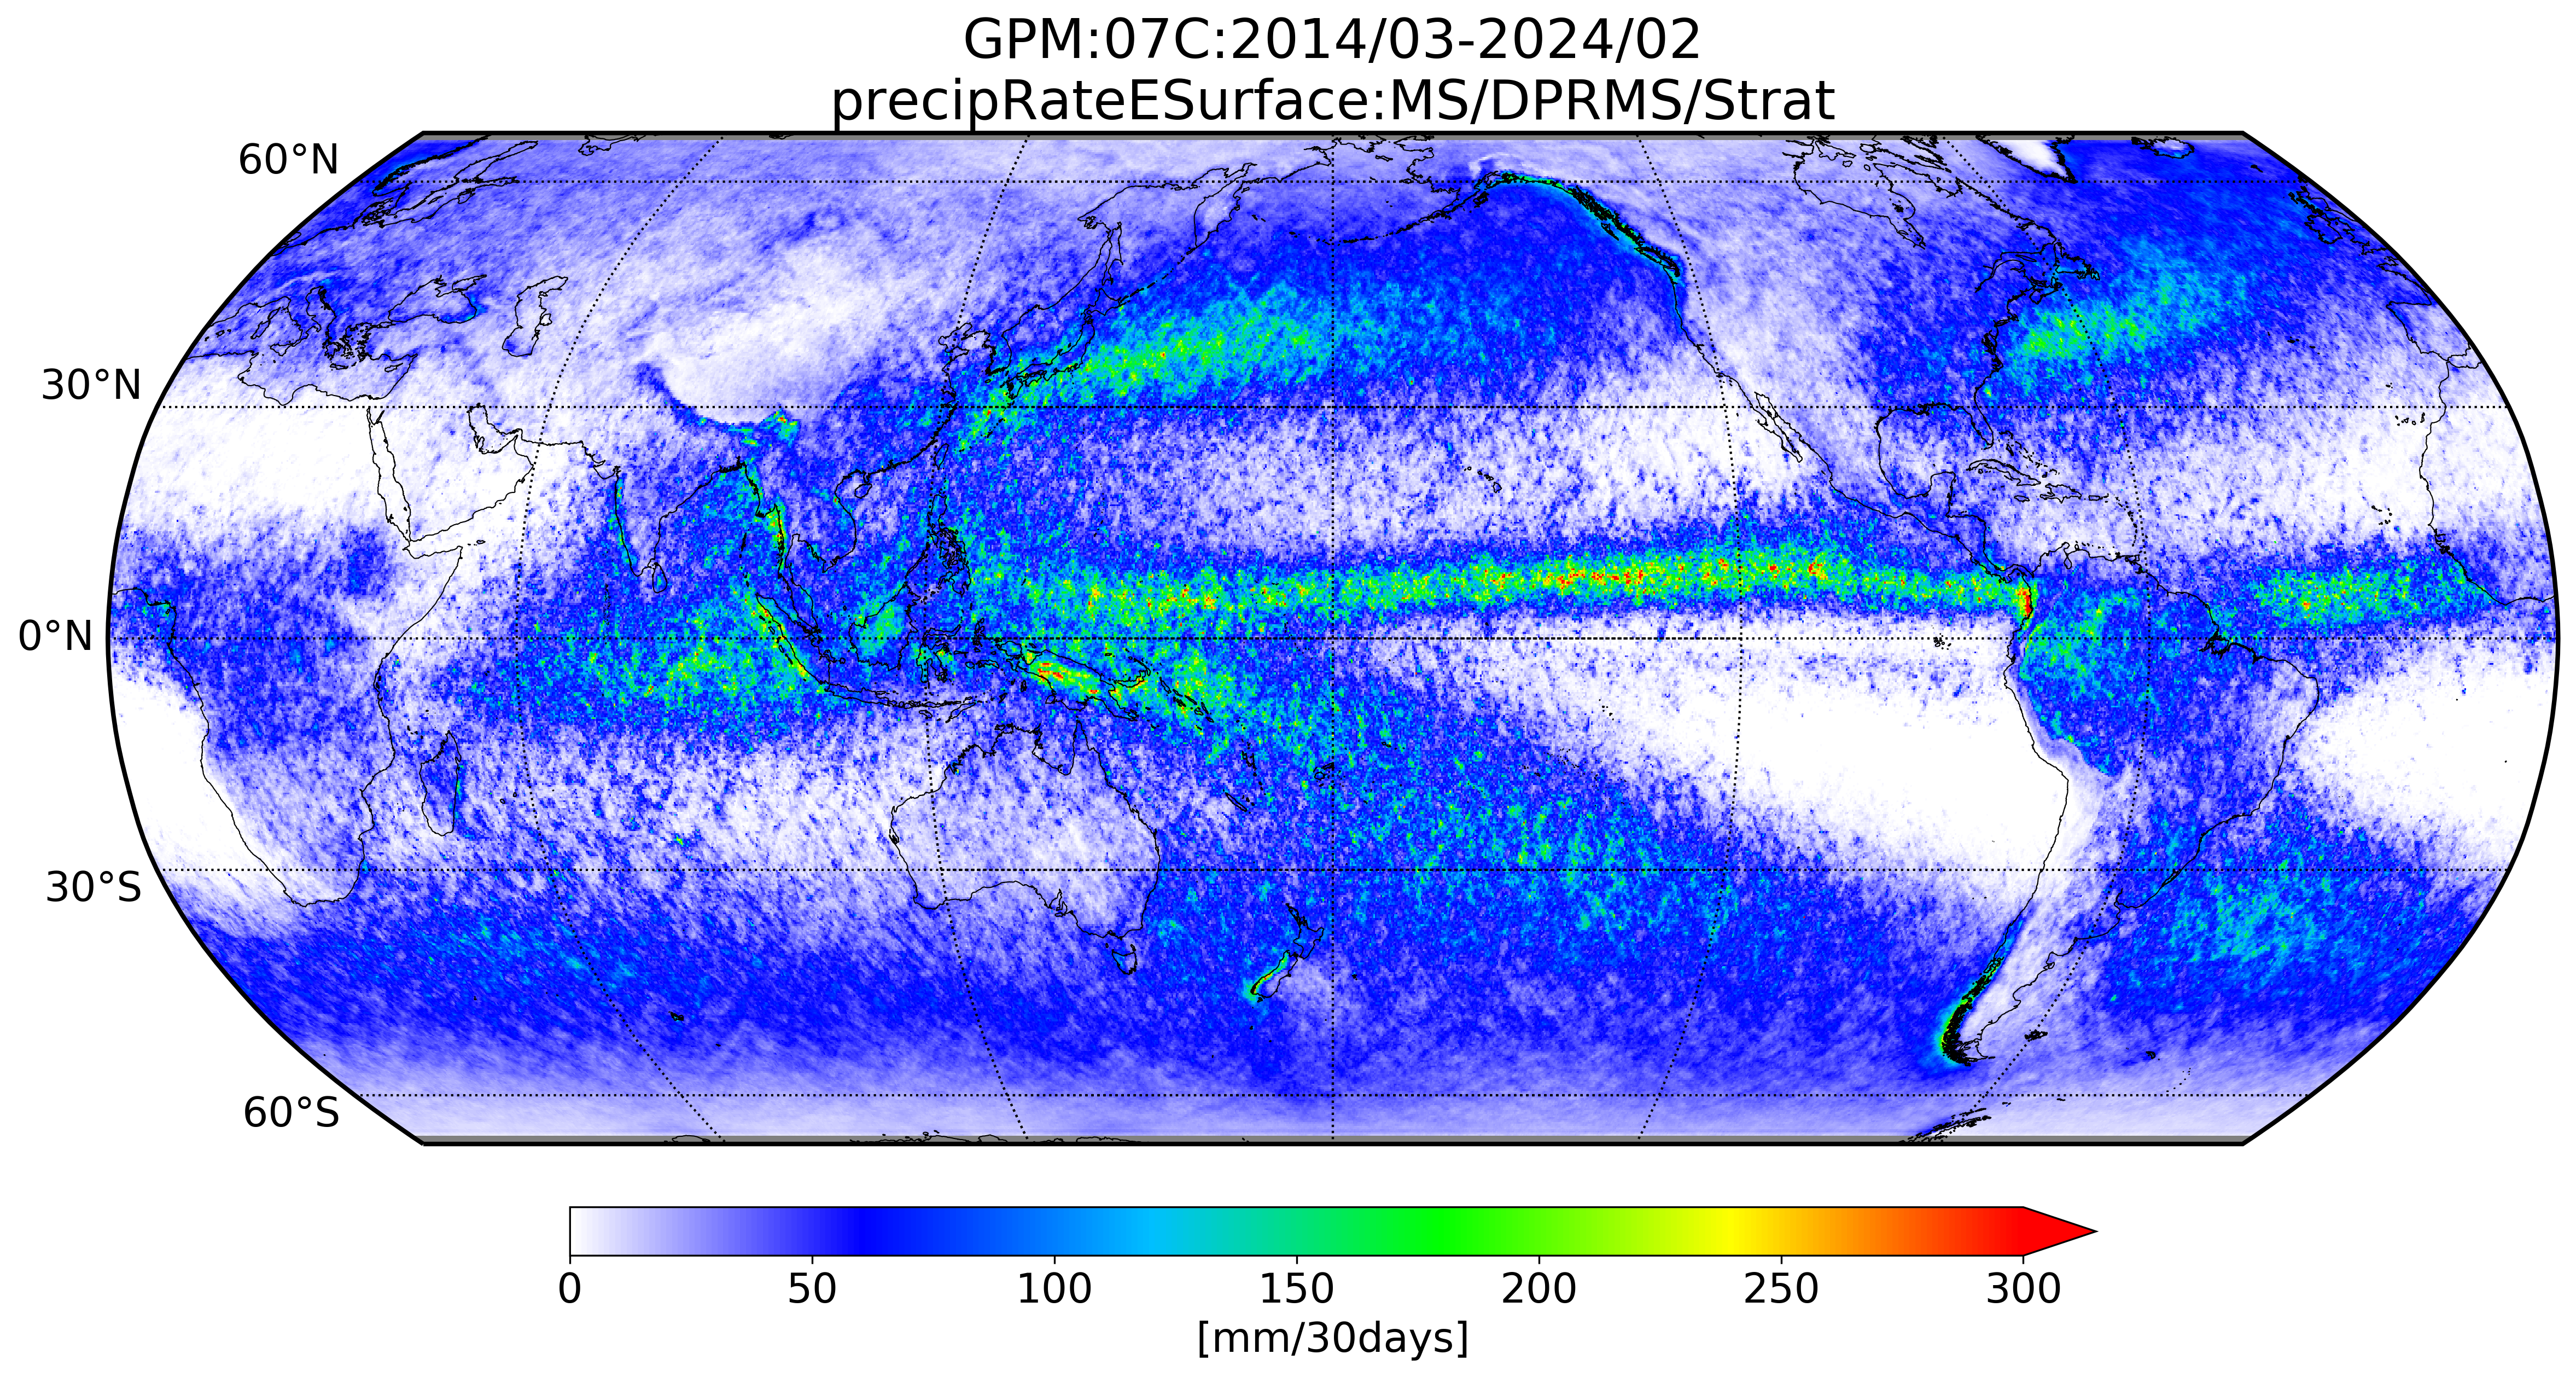
Figure 4: GPM/DPR distribution of stratiform precipitation on the Earth's surface. The analyzed period is 10 years from March 2014 to February 2024. The unit is mm/30 days.

Figure 5: Convective precipitation distribution at the surface by GPM/DPR. The analyzed period is 10 years from March 2014 to February 2024. The unit is mm/30 days.

Figure 6: Percentage of stratiform precipitation to total precipitation, in %. Areas with annual precipitation below 600 mm/year are shown in gray.
② Rain and snow climatology
DPR consists of two radars , Ku-band (13.6 GHz) Precipitation Radar ( KuPR ) and Ka-band (35.5 GHz) Precipitation Radar (KaPR). KaPR, which is designed for high sensitivity, is effective in detecting light rain and snow that KuPR cannot measure. By observing simultaneously with KuPR , which can detect heavy rain , it has become possible to observe precipitation from heavy rain in the tropics to light snowfall in high latitudes with high accuracy. DPR can also distinguish precipitation particles such as rain and snow by observing with radio waves of two different frequencies. Figure 7 shows the climatology of rainfall, and Figures 8-9 show the climatology of snowfall.
Figure 10 shows the ratio of precipitation due to snowfall to the total precipitation, indicating that snowfall is more frequent at high latitudes. It can also be seen that snowfall is observed in the subtropics and mid-latitudes, especially in mountainous areas such as the Tibetan Plateau.

Figure 7: Rainfall distribution near the Earth's surface (at an altitude not affected by contaminations from the Earth's surface) by GPM/DPR. The analyzed period is 10 years from March 2014 to February 2024. The unit is mm/30 days.

Figure 8: Snowfall distribution near the ground surface (at an altitude not affected by contaminations from the ground surface) by GPM/DPR. The analyzed period is 10 years from March 2014 to February 2024. The unit is mm/30 days. The color bar is the same as in Figure 7.

Figure 9: Snowfall distribution near the ground surface (at an altitude not affected by contaminations from the ground surface) by GPM/DPR. The analyzed period is 10 years from March 2014 to February 2024. The unit is mm/30 days. The color bar is different from that of Figure 7 (coloring to emphasize light snowfall).

Figure 10: The proportion of snowfall in the total precipitation observed by GPM/DPR. Darker blue areas indicate heavier snowfall.