 |
| 1.Introduction |
| JAXA/EORC has been monitoring the El Niño / La Niña phenomenon,
using SST:Sea Surface Temperature which estimated by observation of
Advanced Microwave Scanning Radiometer AMSR series. The passive microwave radiometer observes weak microwaves radiated naturally from the earth's surface and atmosphere with multiple frequency bands and
measures geophysical variables related to the global water cycle.
The microwave sensor can continuously monitor SST regardless of day and night, even independently of cloud existence. Please refer to "Terms of Use of Research Data" for the use of images. |
Revision history
| [Jun/09/2025] Since the site was launched, we have used SST provided by the Japan Meteorological Agency for the average annual values, but have switched to SST from the AMSR series. Furthermore, since September 2011, El Niño Watch has been updated to versions 1 and 2, but from June 11, 2025, we will discontinue the version and start publishing with the specifications described in the overview. |
| [Jul/23/2014] AMSR2-based El Niño watch page updated. After the AMSR-E observations were stopped, Windsat data had been used as alternative data. However,Windsat data were replaced by AMSR2 data since July 2012. |
| [Sep/6/2011] Since December 2004, we have continued to operate El Niño Watch. Then, because the Japan Meteorological Agency expanded the El Niño news flash, new page was released as version2 in September 6 2011. El Niño watch page till then keeps updating as version 1. |
| 2.Overview of El Niño Watch |
| The Overview of El Niño Watch is summarized in the following tables. |
| Monitoring regions | (1) El Niño monitoring region-3 (NINO.3) [5S - 5N, 150W - 90W] (2) West Pacific Ocean tropical region (NINO.WEST) [0 - 15N, 130E - 150E] (3) Indian ocean tropical region(IOBW) [20S - 20N, 40E - 100E] |
| Using data | 2002/06/19 - 2011/10/04 : AMSR-E 2011/10/05 - 2012/07/02 : WindSat 2012/07/03 - present : AMSR2 |
| Method of calculating SST |
Latest 5-day mean of descending paths (Data on ascending paths are not used because of the slight positive bias due to solar radiation. ) |
| Normal value | Mean period:2002/10/1 - 2011/9/30(AMSR-E), 2012/10/1 - 2023/9/30(AMSR2) |
| 3.How to use this page | ||
| [SST:Sea Surface Temperature ] | ||
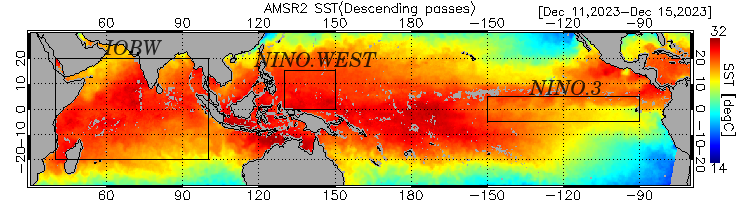 | ||
| SST image represents the latest 5-day mean SST that obtained from AMSR Series. The areas shown in red are high temperature, and the areas shown in blue are low temperature. The gray areas are the land or areas which couldn't be estimated SST because of rainfall. It mean processed in the period on the right of the picture, for example this image was made using the data mean processed between Dec. 11 2023 and Dec. 15 2023. Rectangular lines on the image shows the monitoring region. Then, the following time series graph is the result of monitoring the SST in this region. | ||
| [SST Anomary] | ||
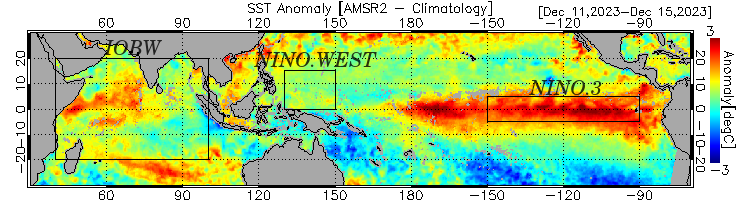 | ||
SST anomalies are calculated as follows. | ||
| [SST anomaly = AMSR SST - Normal value SST] | ||
| The areas colored red are higher than normal SST,
and the areas colored blue are lower than normal SST, in the range from -3℃ to +3℃.
In this example, you can see that is higher than normal SST in the equatorial eastern Pacific Ocean. | ||
| [Time series of SST anomaly] | ||
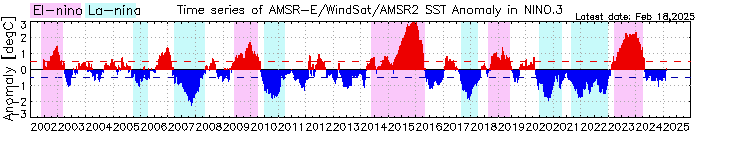 | ||
This graph shows time series of SST anomaly in monitoring region that calculated from SST anomary image. The period colored red are higher than normal SST, and the period colored blue are lower than normal SST. The periods shaded in pink or light blue on the graph indicate periods of El Niño and La Niña phenomenon occurrence, respectively, as announced by the Japan Meteorological Agency. If the 5-month moving mean of the difference between the observed SST and normal SST in Monitor area NINO3 has been higher than 0.5 ℃ for six month or more, it is called El Niño phenomenon. And if it has been lower than -0.5 ℃, it is called La Nina phenomenon.[Japan Meteorological Agency definitions] | ||
| [Time series of SST] | ||
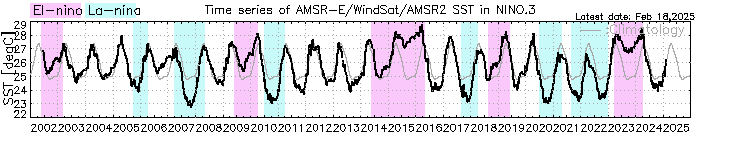 | ||
This graph shows time series of SST mean in monitoring region that calculated from SST image. | ||
Japan Aerospace Exploration Agency Earth Observation Research Center
JAXA EORC ALL RIGHTS RESERVED. | ||