Image Library
Vortex streets developed in the lee of an island by Kuroshio.
-
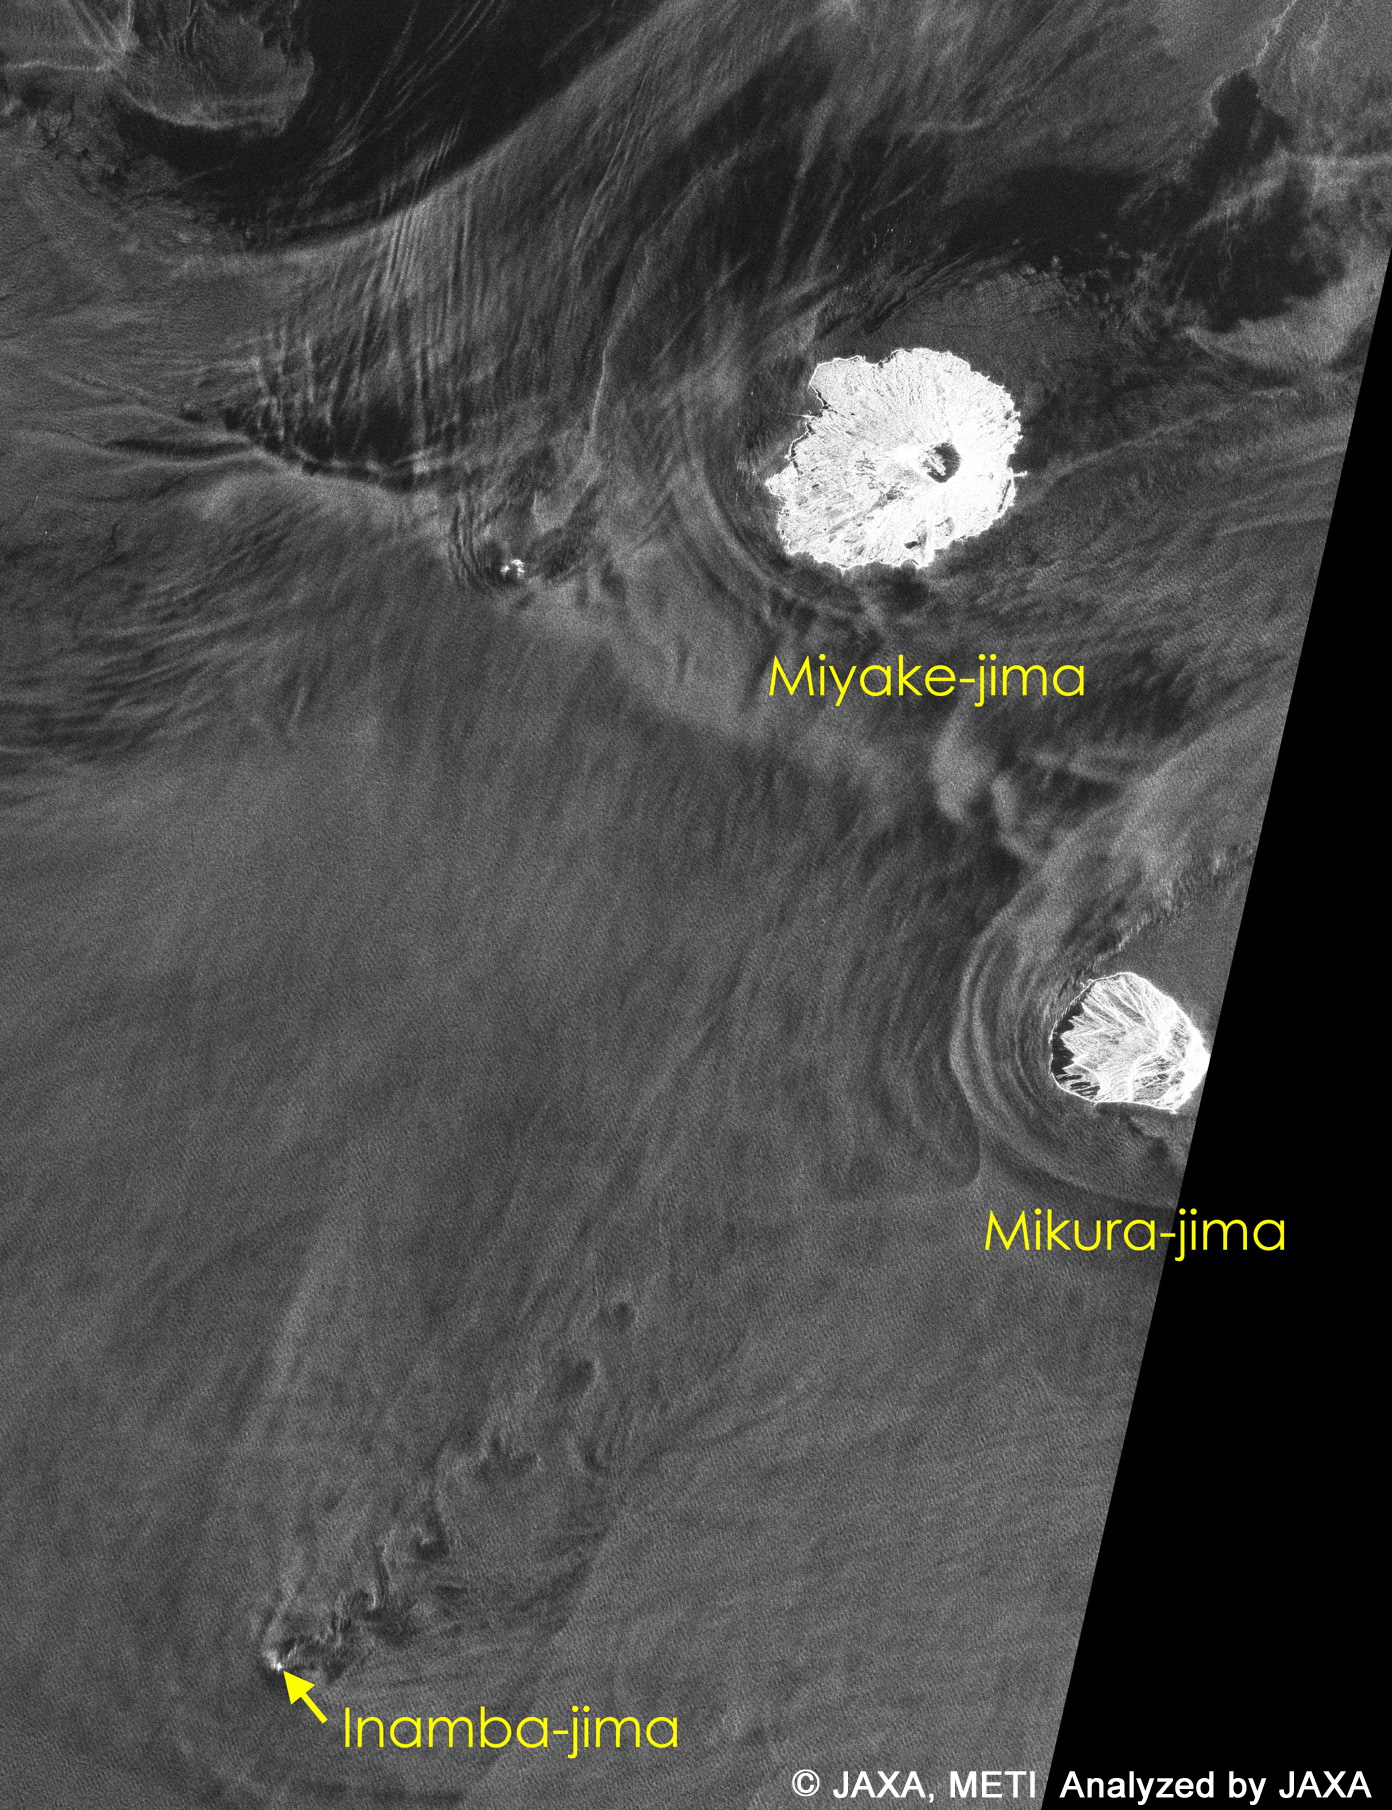 Fig. 1: PALSAR image observed with the fine bean single polarization (FBS) mode on June 12, 2006, around Miyake-jima of the Izu Island chain.(Click to view enlarged image)
 -
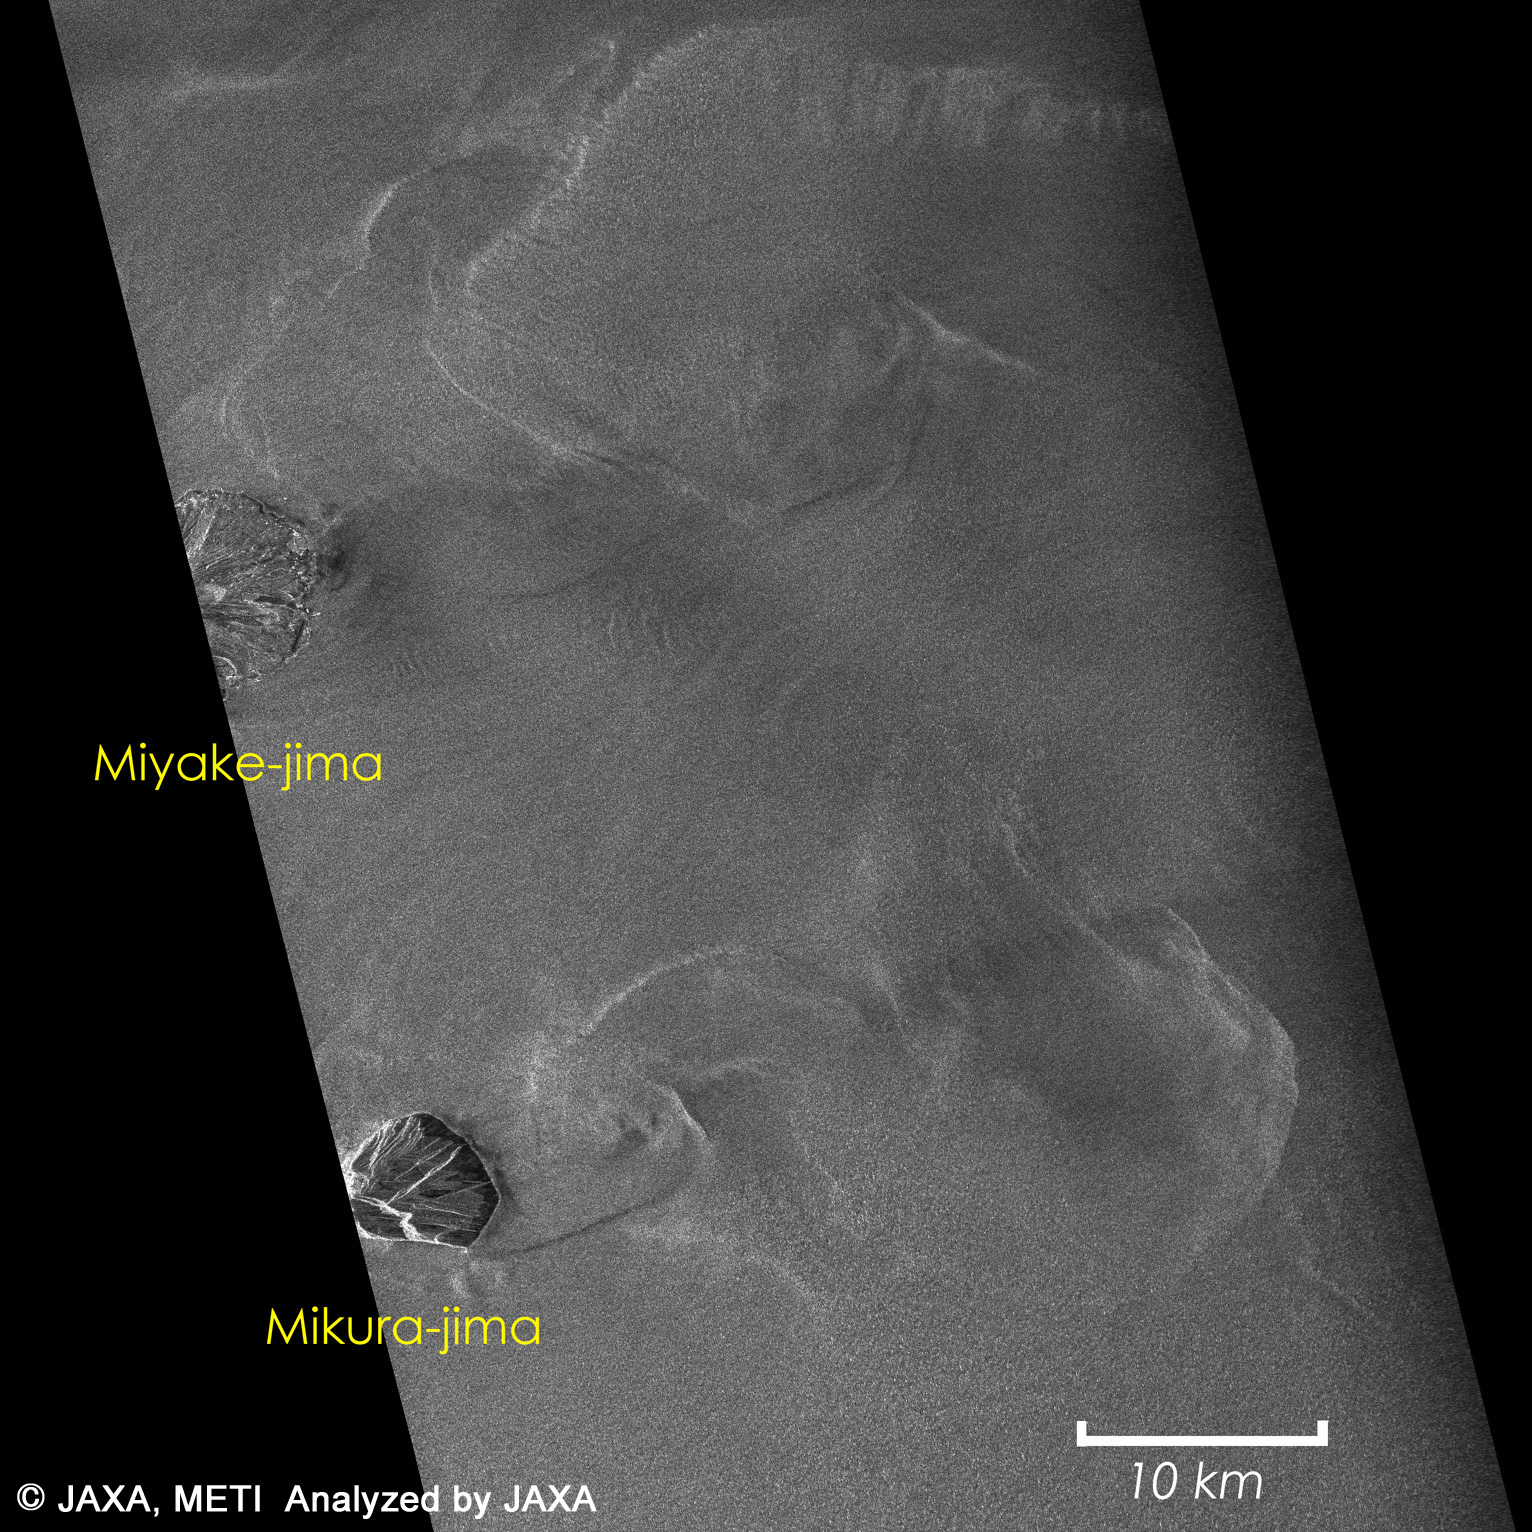 Fig. 2: PALSAR image observed with the polarimetric mode on June 12, 2006, around Miyake-jima of the Izu Island chain.(Click to view enlarged image)
Figure 1 shows an ALOS/PALSAR image observed with the fine bean single polarization (FBS) mode on June 12, 2006, around Miyake-jima of the Izu Island chain. Vortex streets are well developed from Inamba-jima, spreading northeastward over 20 km. Also shown in Figure 2 is a PALSAR image observed with the polarimetric mode on June 18, 2006. You can see larger vortex pairs in the lee of Mikura-jima. These vortex streets visualized in the PALSAR images are similar to Karman Vortex Streets. Generally, when a flow impinges on a columnar object, it gets caught in the lee of the object, forming vortex streets.
Concerning the Karman Vortex Streets formed by winds (air flows), it is well known that it develops in the lee of Cheju island in Korea under the condition of strong northwesterly winter monsoon. These vortex streets are visualized as a cloud pattern, which is often seen in visible images of GMS and NOAA.-
 Courtesy of JAXA/TOKAI UNIVERSITY
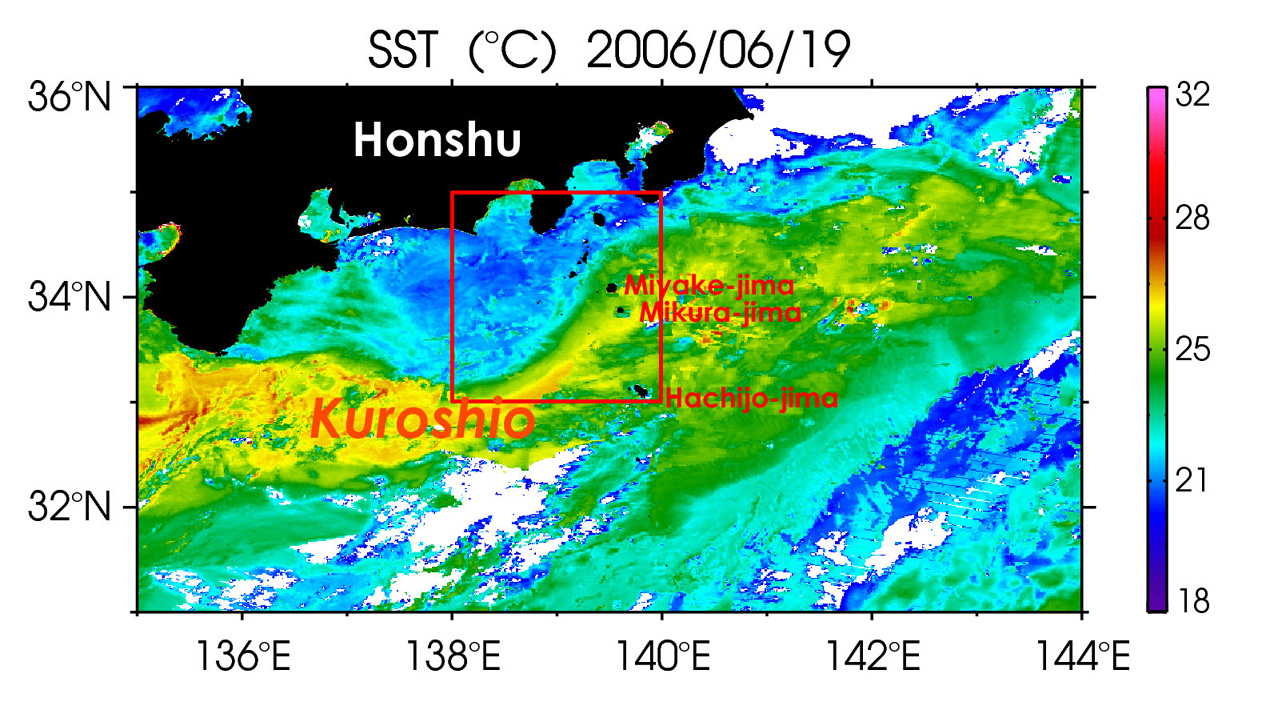
Fig. 3: MODIS-observed sea surface temperature (SST) fields on June 17-19, 2006.(Click to view enlarged image) -
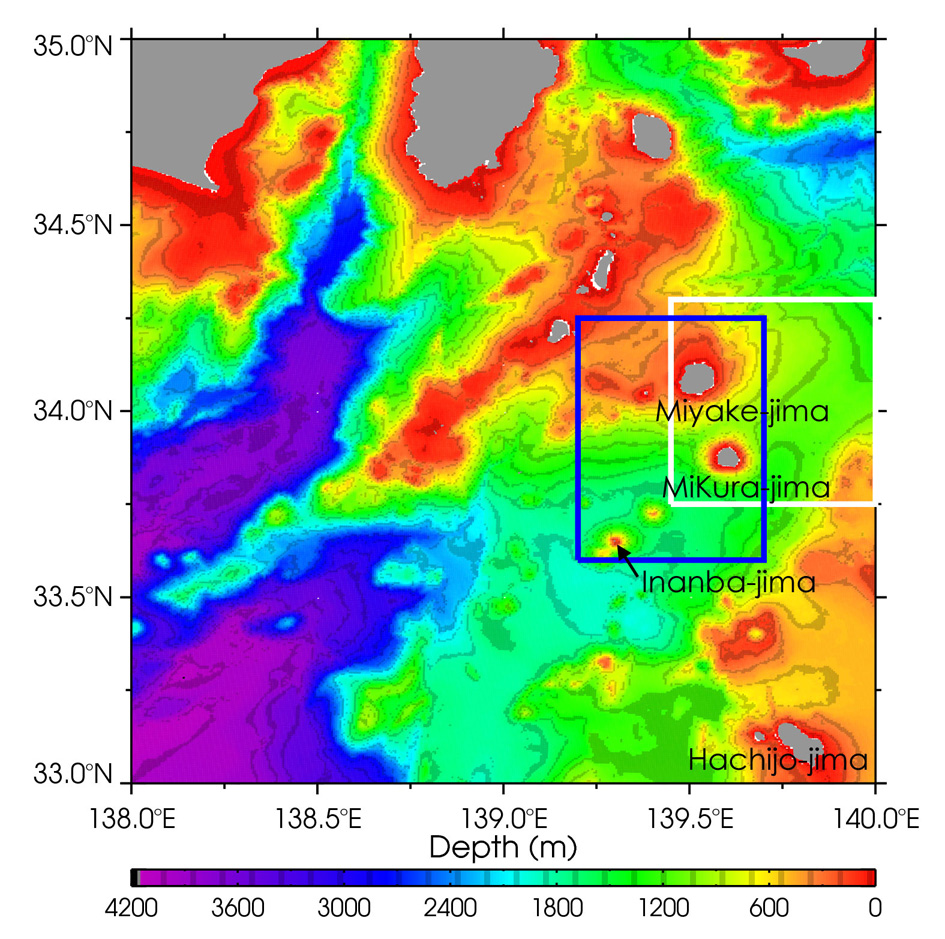 Fig. 4: Bottom topography around the Izu Island chain, the region framed in by the red square in Figure 3.(Click to view enlarged image)
The vortex streets seen in the PALSAR images are developed by ocean currents (Kuroshio). Figure 3 shows a MODIS-observed sea surface temperature (SST) field on June 17-19, 2006. The Kuroshio visualized as a high SST band flows east-northeastward in the vicinity of Miyake-jima and Mikura-jima. It has been reported that the Kuroshio, whose width is about 100 km and velocity is 1-2 m/s, is the second strongest and fastest current after the Gulf Stream in the Atlantic.
Figure 4 shows bottom topography around the Izu Island chain, the region framed in by the red square in Figure 3. The blue and white squares in Figure 4 indicate the regions of Figures 1 and 2, respectively. Because Inamba-jima and Mikura-jima, which are associated with the development of the vortex streets, are close to conically-shape undersea mountains isolated from the surrounding mountains, these seem to be better suited for the developing of the vortex streets. It is thus concluded that a combination of 1) the Kuroshio's persistent currents and 2) the suitable bottom topography makes it possible to develop the vortex streets in the lees of Inamba-jima and Mikura-jima. The effects of these vortex streets on oceanic environment near the islands are of great interest, which will be one of research issues for coastal oceanography.