Image Library
Red Tide around Japan from spring to early summer in 2006 captured by AVNIR-2
Red Tide is a coloring phenomenon of ocean by marine plankton's abnormal proliferation. It is caused often in the coastal area where the water tends to stagnate when the solar radiation increases and air temperature goes up in spring and summer, and environment changes caused by the Red Tide often influence the man activities of the fishery and cultivation, etc.
Red Tide can be detected from the satellite sensors as coloration of sea surface. However, its color varies depending on the type and the amount of dominant planktons, and its signal is made invisible by the cloud, aerosols, and surrounding water color.
We investigate six cases of the ocean coloration in the Japanese coast in the spring and early summer of 2006 captured by AVNIR-2 with four channels, blue (460nm), green (560nm), red (650nm), and near-infrared (825nm) with 10m spatial resolution.
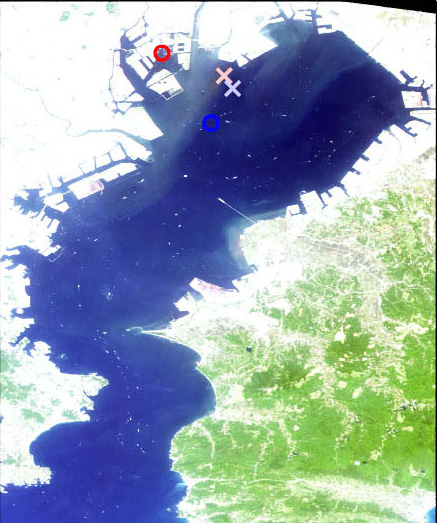
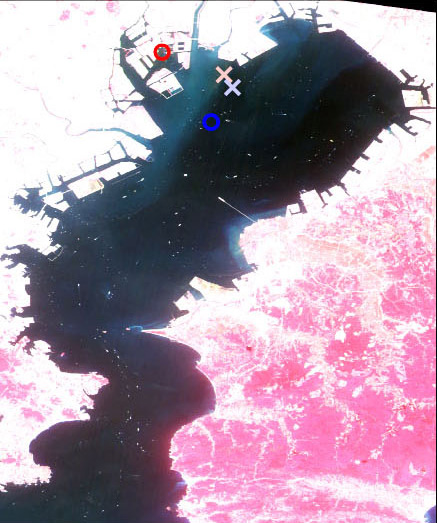
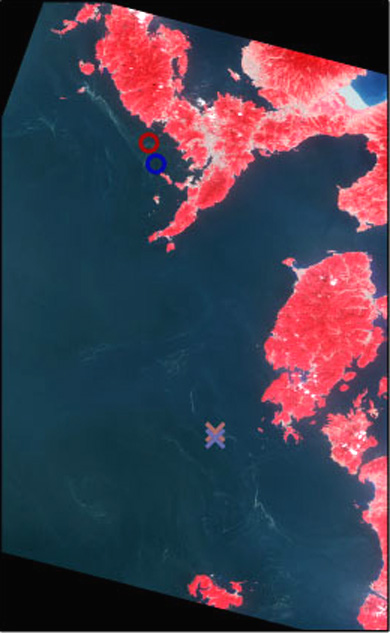
Case 1) Tokyo Bay on June 1, 2006
In the image June 1, 2006 of AVNIR-2, colored areas are appeared in Tokyo Bay over the Yokohama and Chiba ports. It is reported that the redtide caused by Dinoflagellates(Prorocentrum minimum) was distributed large-scale in the Tokyo Bay from April to the late-May (Yokohama Institute of Environmental Sciences).
The near infrared reflectance was increased obviously in the discoloration region.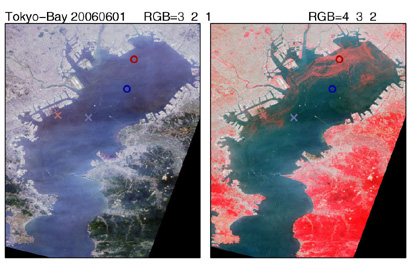
(a) and (b) are natural and false RGB images.
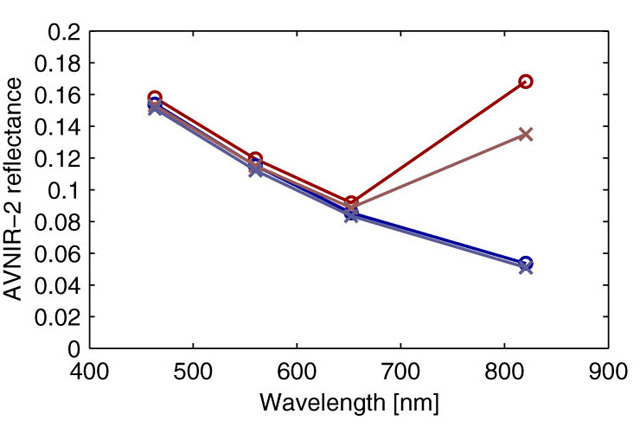
(c) spectral plots at two discoloration (red) and two non-discoloration areas (blue). Horizontal axis shows wavelength and vertical AVNIR-2 reflectance. Circle and cross markers show locations in the left figures.
Case 2) Tokyo Bay on May 21, 2006
Figure 2 shows Tokyo bay before the large-scale redtide appears. We can find small areas where colored red a little in the Tokyo port (oval light blue in figure).
AVNIR-2 spectrum shows that red and near infrared reflectance increased a little in the colored region though the amount are smaller than Figure 1.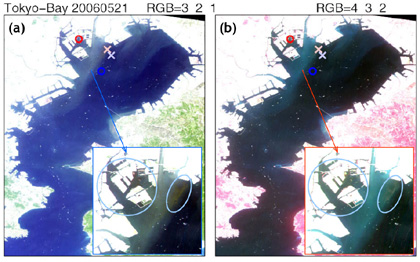
(a) and (b) are natural and false RGB images.
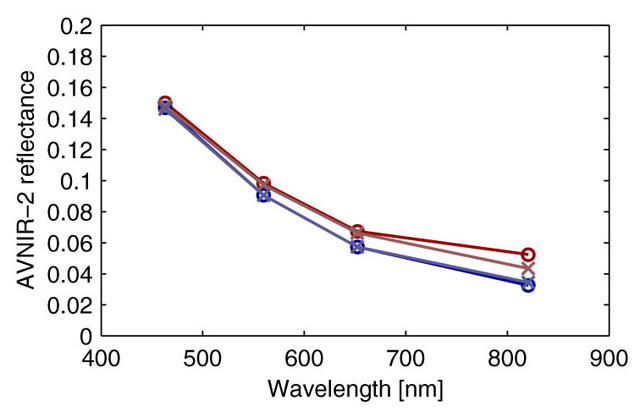
(c) spectral plots at two discoloration (red) and two non-discoloration areas (blue). Horizontal axis shows wavelength and vertical AVNIR-2 reflectance. Circle and cross markers show locations in the left figures.
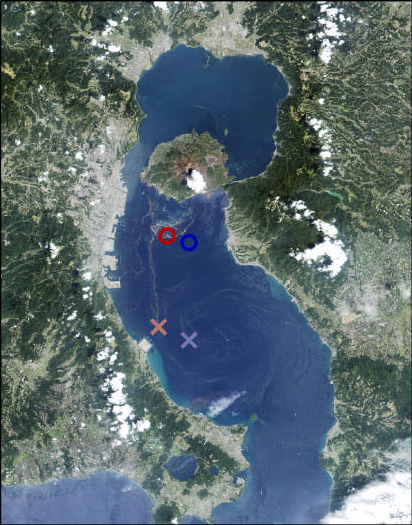
Case 3) Kagoshima Bay on April 7, 2006
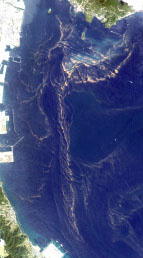
Figure 3 shows Kagoshima bay on April 7, 2006, red stripes were observed in the south of Sakurajima by AVNIR-2. It was reported by Kagoshima Fishery technology Development Center that the redtide by Noctiluca scintillans is appeared in this area.
Red reflectance was increased than near infrared one in the redtide area. The feature of this kind of redtide makes vivid red by person's eyes.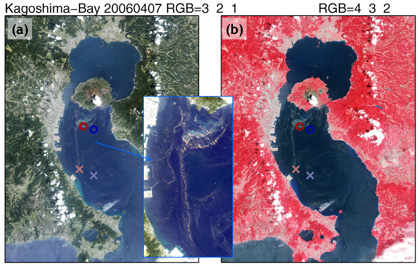
(a) and (b) are natural and false RGB images.
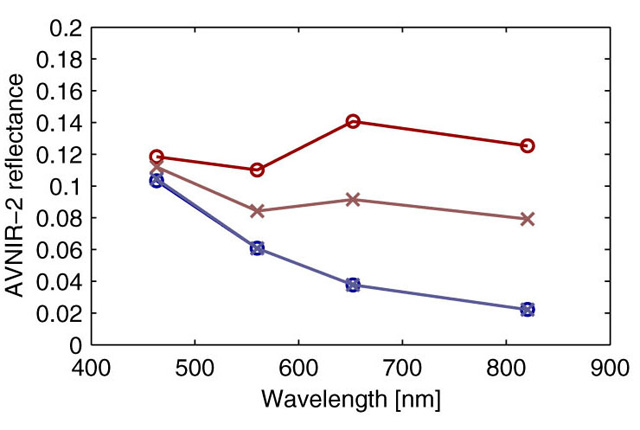
(c) spectral plots at two discoloration (red) and two non-discoloration areas (blue). Horizontal axis shows wavelength and vertical AVNIR-2 reflectance. Circle and cross markers show locations in the left figures.
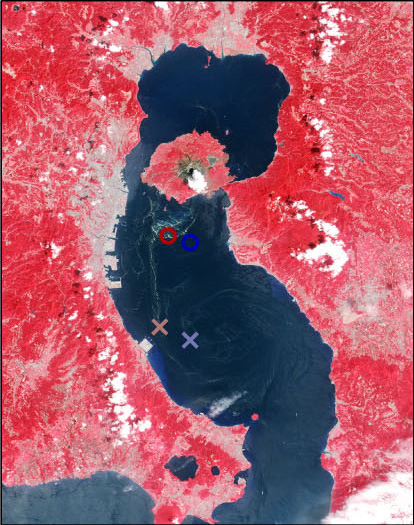
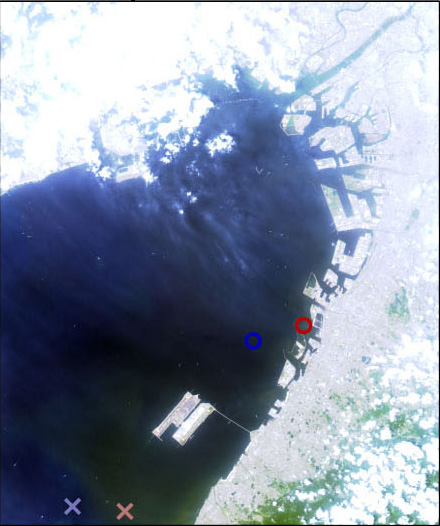
Case 4) East coast of Osaka Bay on May 24, 2006
It was reported by Osaka prefectural Fisheries Experiment Station that Redtides of diatoms (Skeletonema costatum) are appeared in the Osaka bay from Sakai to Izumi-Otsu City from late-May to the beginning of June in 2006.
Red and near infrared reflectance increased slightly in the above area, but we cannot identify the colored area clearly in this AVNIR-2 image.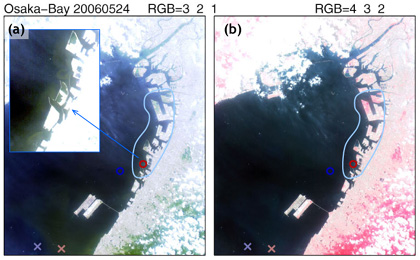
Figure 4: Osaka Bay on May 24, 2006 observed by AVNIR-2.
(Click to View Enlarged Image)
(a) and (b) are natural and false RGB images.
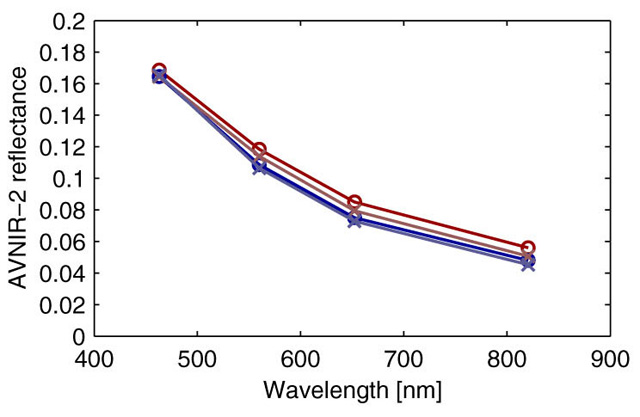
(c) spectral plots at two discoloration (red) and two non-discoloration areas (blue). Horizontal axis shows wavelength and vertical AVNIR-2 reflectance. Circle and cross markers show locations in the left figures.
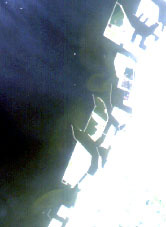
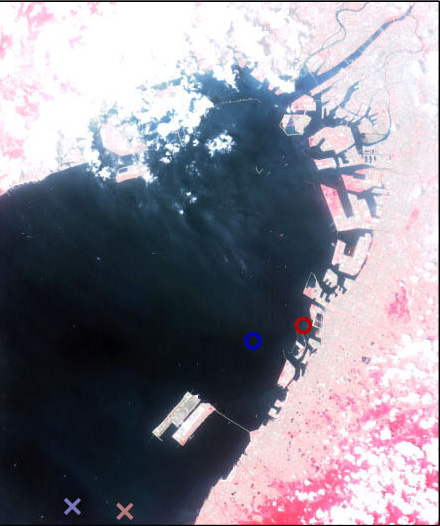
Case 5) Ise Bay on May 25, 2006
Ise bay is an area where the redtide is frequently generated as well as Tokyo Bay and the Osaka bay. A brown sea area is seen in the west shore of the Ise bay, and some colored area were seen along Chita Peninsula in fig. 5(b) (indicated by light blue lines).
AVNIR-2 reflectance shows that red and near infrared reflectance were a little bit high in the west shore of Ise Bay, and near-infrared reflectance was very high in the colored region in the coast of Chita Peninsula. The latter was possibly an underwater plant such as the marine forests, because the image was obtained at the time of the ebb tide.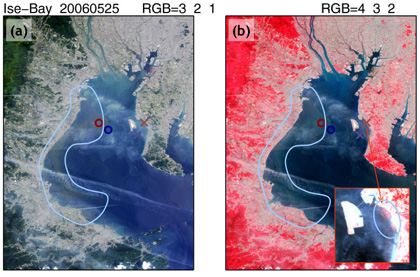
Figure 5: Ise Bay on May 25, 2006 observed by AVNIR-2.
(Click to View Enlarged Image)
(a) and (b) are natural and false RGB images.
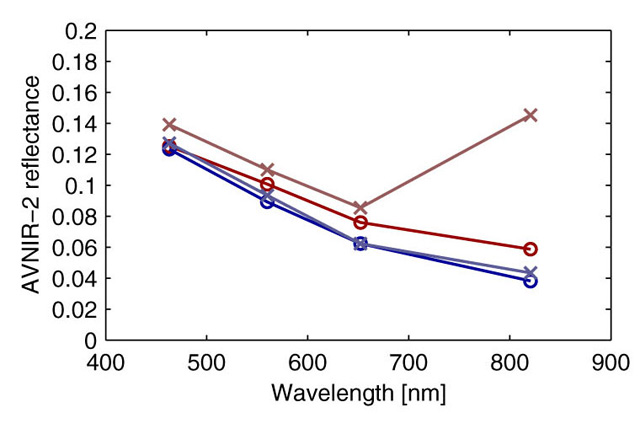
(c) spectral plots at two discoloration (red) and two non-discoloration areas (blue). Horizontal axis shows wavelength and vertical AVNIR-2 reflectance. Circle and cross markers show locations in the left figures.
Case 6) Amakusa on May 4, 2006
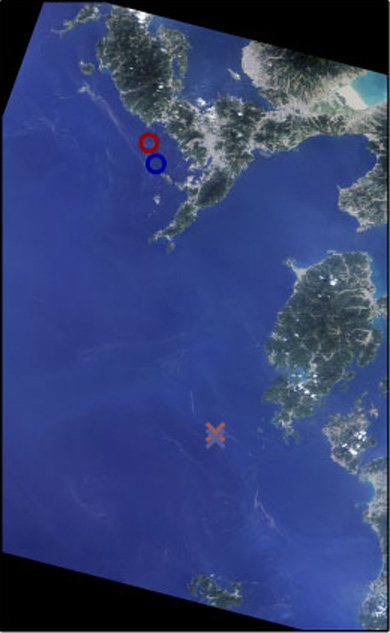
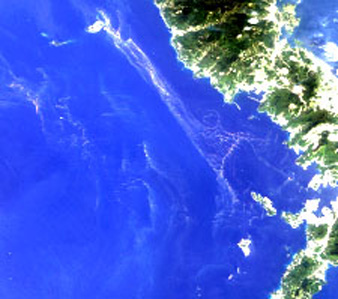
Figure 6 shows seas around the Amakusa Islands observed by AVNIR-2 on May 4, 2006. We can see red-colored lines from the offshore of Nagasaki to the west of Amakusa Islands.
AVNIR-2 reflectance shows that red and near infrared reflectance were increased much at the colored areas. The line-structure and spectrum are similar to ones in Kagoshima Bay on April 7, so we can assume that they were redtides mainly caused by noctiluca (Noctiluca scintillans).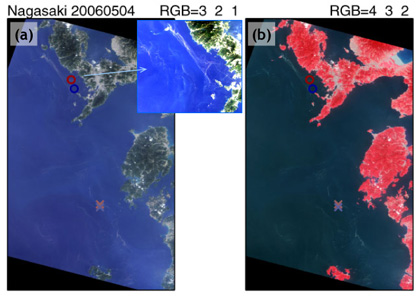
Figure 6: Seas around the Amakusa Islands observed by AVNIR-2 on May 4, 2006.
(Click to View Enlarged Image)
(a) and (b) are natural and false RGB images.
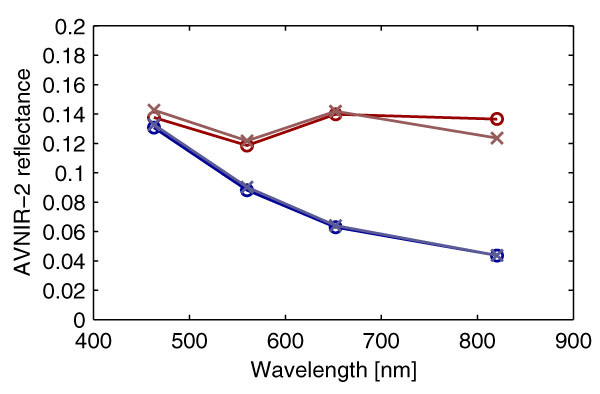
(c) spectral plots at two discoloration (red) and two non-discoloration areas (blue). Horizontal axis shows wavelength and vertical AVNIR-2 reflectance. Circle and cross markers show locations in the left figures.
Redtide around Japan from spring to early summer in 2006 captured by AVNIR-2; summary
Satellite observation has an advantage of obtaining wide-ranging distribution at a time in the Red Tide monitoring, however, the following problems exist.
- We cannot estimate neither the type nor the amount of redtide from the "Color".
- It is difficult to identify the redtide area when the difference between background ocean color and the redtide color is small.
- It becomes difficult for the situation of high sunglint and thick aerosol.
- Observations are limited by satellite sensor operation schedule and cloud cover.
For problem 1), it might become possible by analyzing a lot of satellite observation data with in situ observations to estimate some species and amount of redtide plankton from the satellite data. For problems 2) and 3), we have to know and notice about strong and weak points of the satellite observations. It is important to combine two or more satellite data of different spatial and temporal resolutions and in situ data for the problem 4).
It is expected to construct effective monitoring system and improve our knowledge about redtide by accumulating redtide data including in situ and satellite data such as AVNIR-2, and developing data analysis techniques.