Image Library

Detection of oil spill caused by a sunken tanker by using PALSAR

An oil spill from a sunken tanker was detected using Daichi/PALSAR. The disaster occurred on August 11, 2006, near the central Philippines island of Guimaras, and emergency observations were conducted twice, on August 25 in ScanSAR mode (observation swath 350km, polarization HH, Fig. 1-left) and on August 27 in Polarimetry mode (observation swath 30km, polarization HH HV VH VV, Fig. 1-right). The red point in the figures represents the ship accident location, and the oil spill appears as a black streak extending from that point (within a blue polygon). The black stripe in Fig. 1-right is considered to be an internal wave*1 because it exhibits a periodic pattern. The black area near the land in Fig. 1-left represents small waves area, where the land block the strong wind. However, it is not clear if the other black area is caused by calm water or the oil spill.
Fig. 1. Oil spill detected with PALSAR.
METI, JAXA
Fig. 1. Oil spill detected with PALSAR.

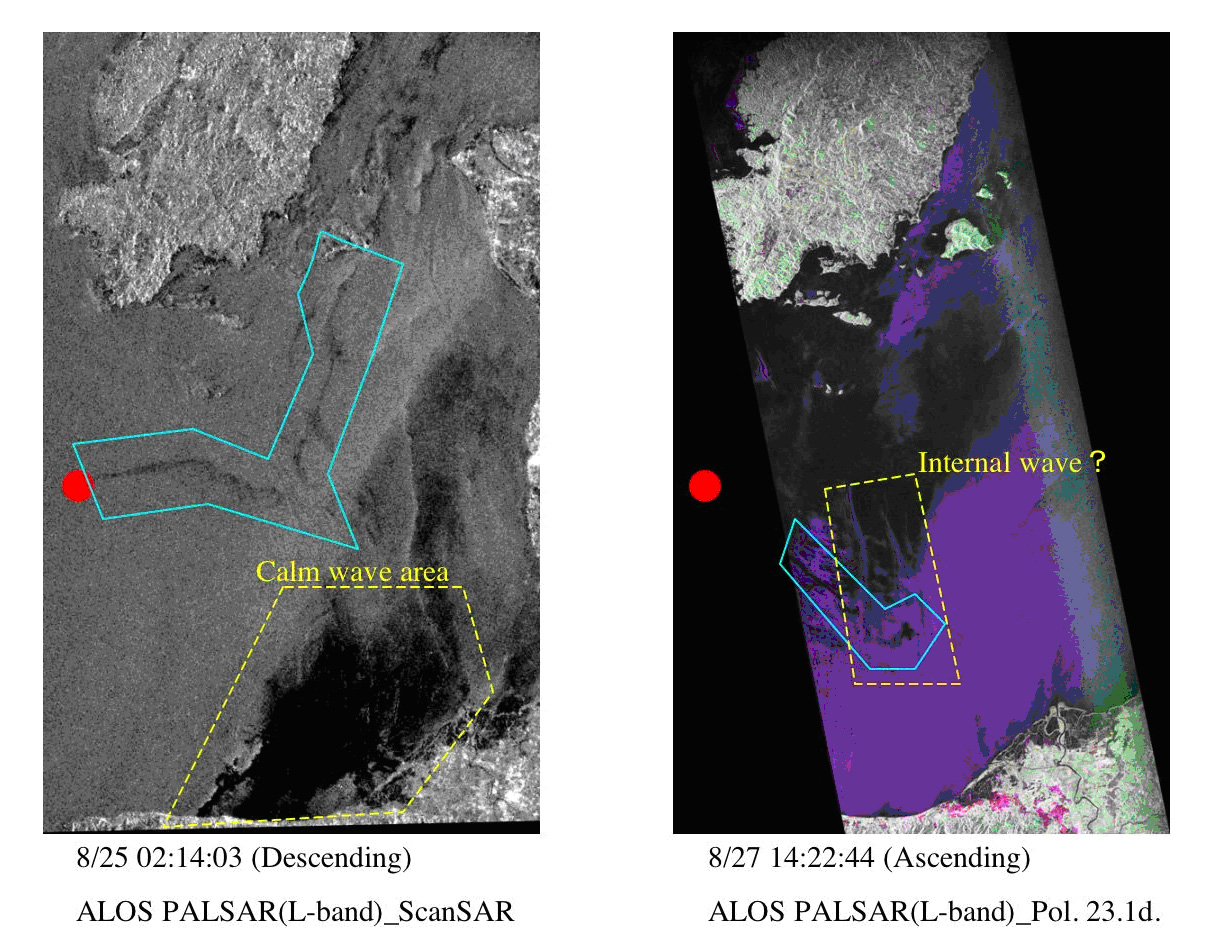
Left - ScanSAR image. Right - Polarimetry image (HH, Red; HV, Green; VV, blue)

(Click to view enlarged image)

Fig. 2-left presents a decomposition image made from the polarimetry data. Intensity of four polarizations (HH, HV, VH, VV) and phase information are used to determine the scattering mechanism. Red indicates double-bounce scattering from ground-building, ground-tree trunk, and so on. Green represents volume scattering, in which multiple radar reflections occur in the tree canopy. Blue represents surface scattering, in which radar is scattered by rough surfaces, such as ground and sea waves. In the decomposition image, forest areas appear green, buildings and paddy areas appear red, and bare soil and sea waves appear blue. The oil spill on the sea appears black because the oil suppresses the waves, making the surface smoother.

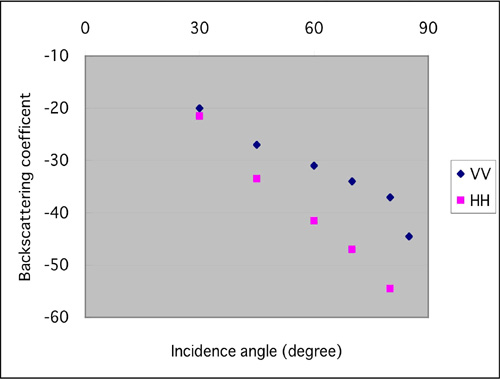
Figure 2 middle and right are intensity images taken with HH and VV polarization and depict the same pattern. This indicates that the scattering process on the sea is the same. To determine the best mode to detect the oil spill, intensity ratios between dark (blue square) and bright (yellow square) sea areas are examined in the two polarization images. The ratio is 3.0 for the HH image and 4.2 for the VV image, indicating a clear contrast. This means that the VV image is better for detecting the oil spill.
  • Fig. 2

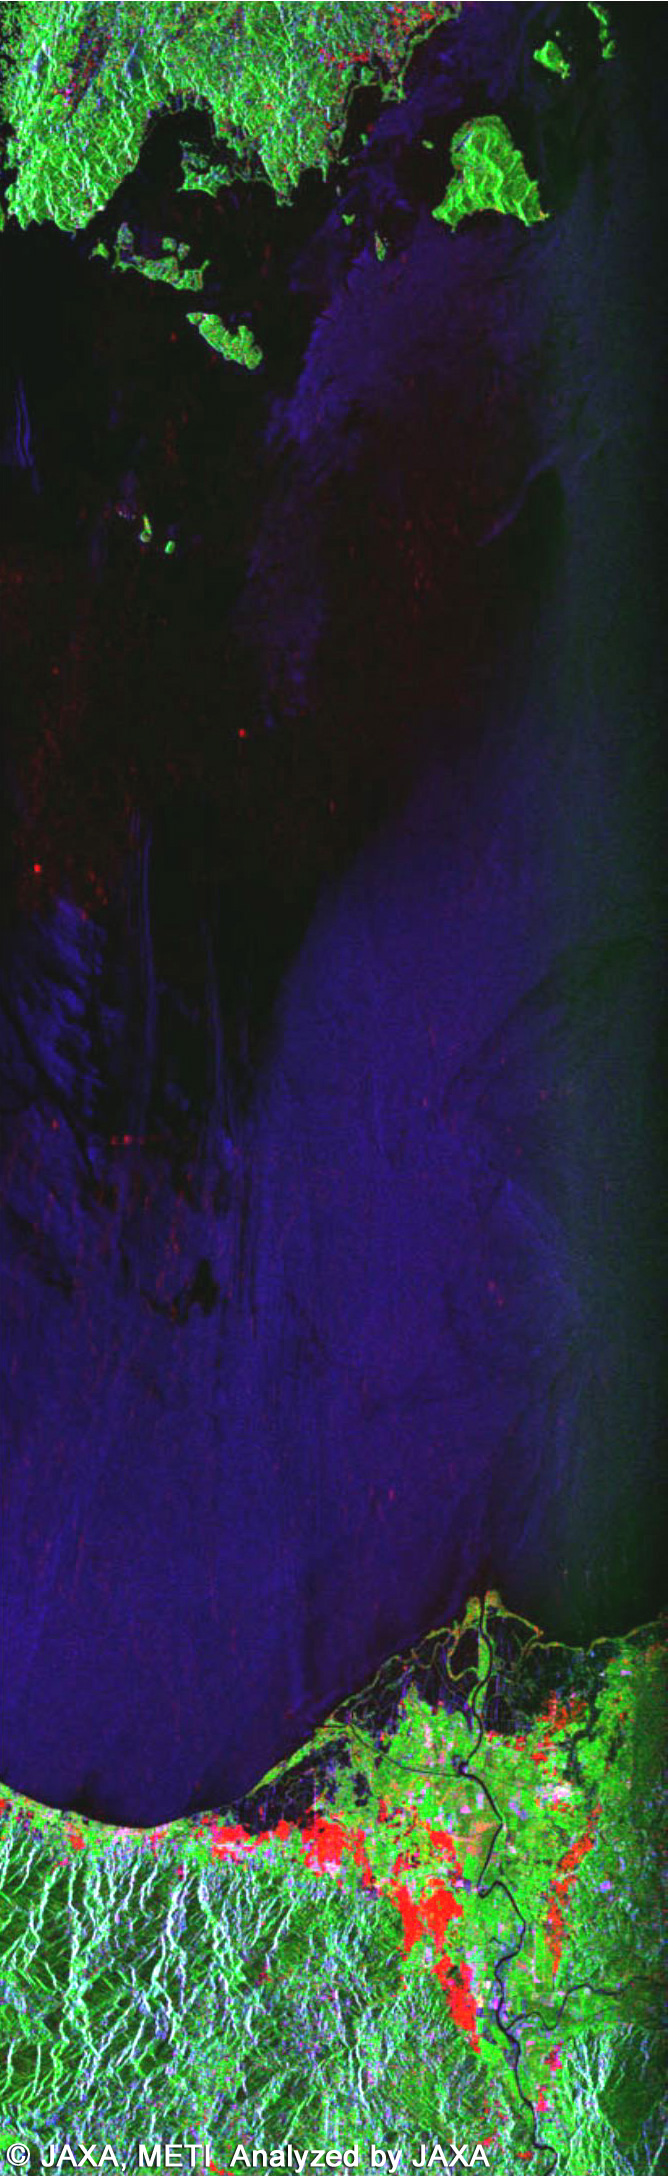
    Three-component decomposition image.

  • 図2: HH偏波画像

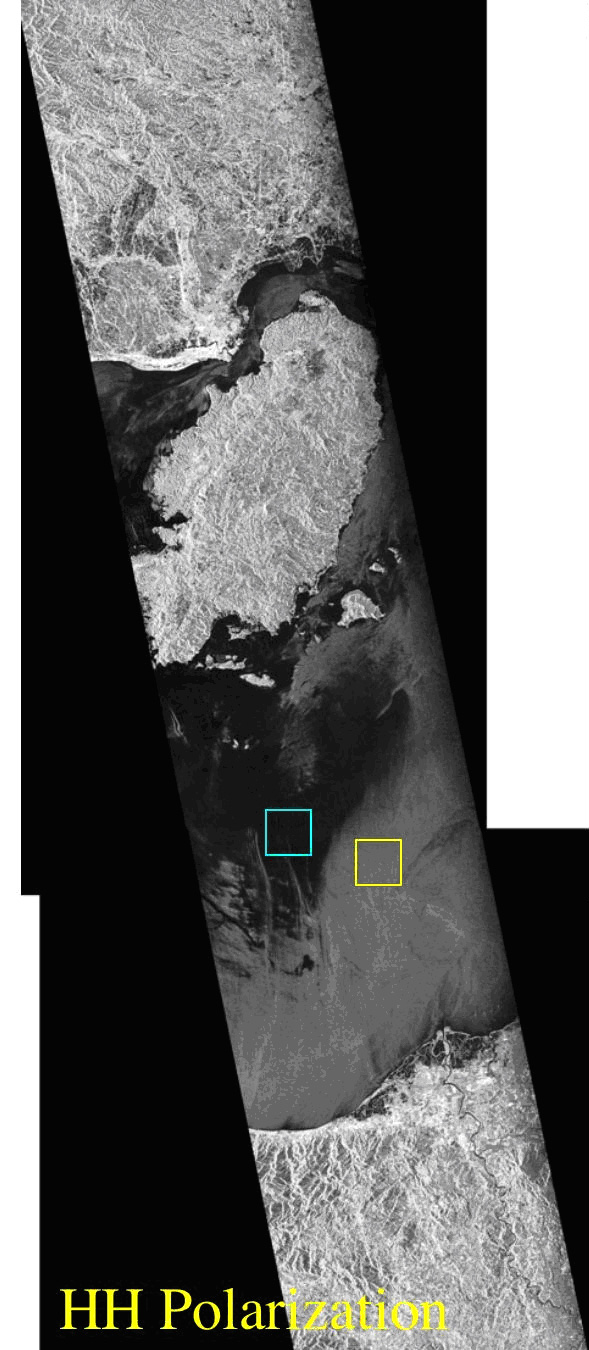
    HH polarization image.

  • 図2: VV偏波画像

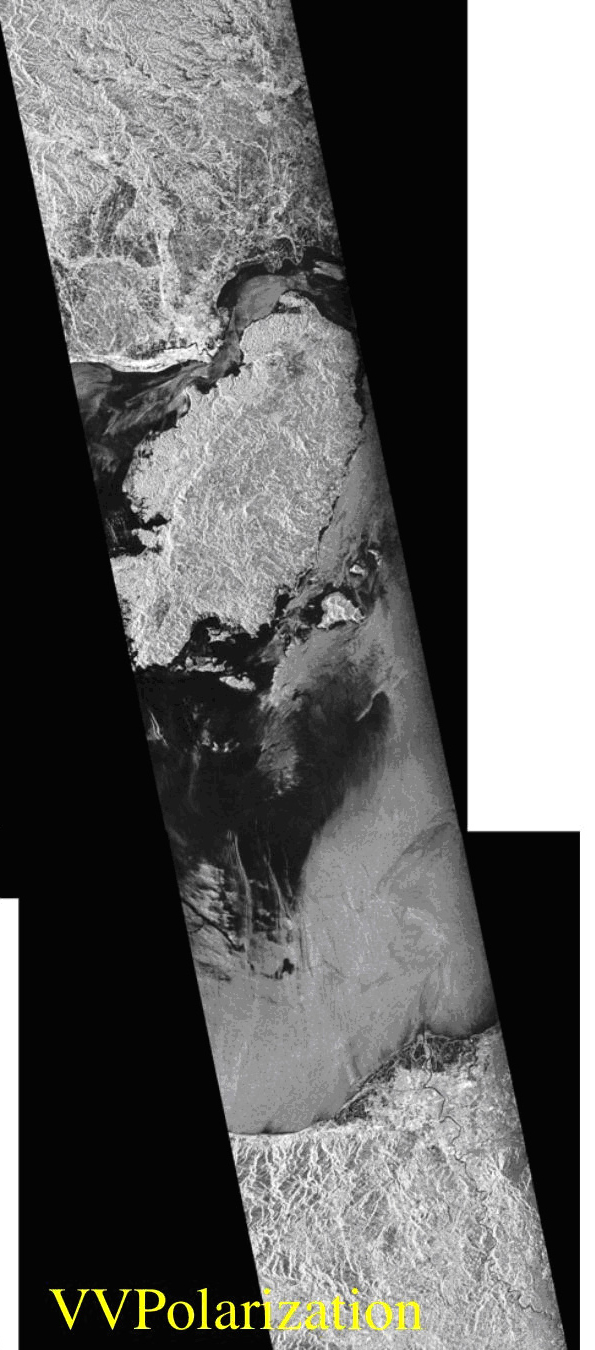
    VV polarization image.

Fig. 2
(Click to view enlarged image)
Fig. 3 shows incidence angle dependency against backscattering coefficient in case that sea wave is observed by a L-band SAR (Daley et al.*2,Wind speed: 5 knots, wave height: 3 feet, upcoming wind). If the off-nadir angle is the same, the intensity of the VV polarization is higher than that of HH polarization, and this is consistent with the results derived this time. If the incidence angle is large, the backscattering coefficient becomes small for both HH and VV polarizations. However, the dependency of HH polarization on the incidence angle is greater than that of VV polarization. This means that if the incidence angle is small, the difference in intensity between HH and VV polarization is small, but if the incidence angle is large, the VV image in the sea is brighter than the HH image. This suggests that the VV image is better for detecting oil spills.
Fig. 3. Incidence angle dependency on backscattering coefficient for sea waves detected by L-band SAR.

*1:A wave made between two different sea layers with different densities. Typical wave height is 10 to 100m.

*2:J.C. Daley, W.T. Davis, and N.E. Mills, "Radar Sea Return in High Sea States," Naval Research Laboratory Report 7142, September 25, 1970.

RELATIVE SITE

METI, JAXA