On March 11, 2011 (UTC), a magnitude 9.0 huge earthquake occurred off the Pacific coast of Tohoku-Kanto district in Japan (38.32°N, 142.37°E, 32 km in depth; Hypocenter information from USGS Web site), accompanied by a massive tsunami. The Japan Aerospace Exploration Agency (JAXA) performed an emergency observation on March 20 using the Phased Array type L-band Synthetic Aperture Radar (PALSAR) installed on the Advanced Land Observing Satellite (ALOS). In this report, we conduct differential interferometric SAR (DInSAR) processing to detect crustal deformation associated with the earthquake using PALSAR data acquired before (February 2, 2011) and after (March 20, 2011) the earthquake. Moreover, we detected local crustal deformation caused by another inland earthquake on March 19, 2011, in the northern Ibaraki Prefecture.
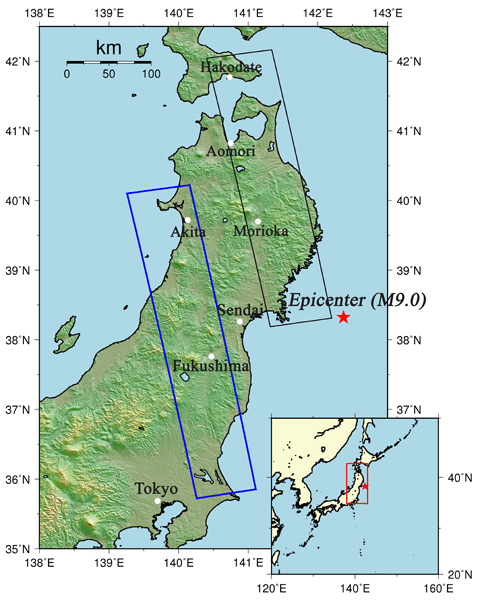
Fig.1: An overall view of the observation area (We refer to SRTM3 as terrain data).
(Click to View Enlarged Image)
The blue rectangle indicates the observation area shown in Fig. 2, and the black rectangle indicates an area of the previous emergency observation in March 15. The red star represents the epicenter of this earthquake.
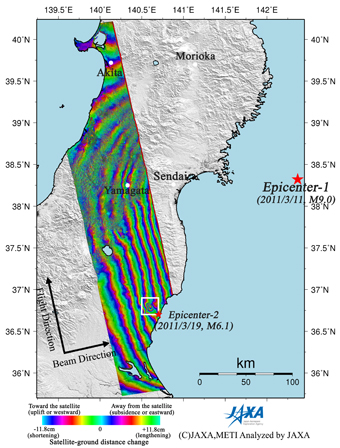
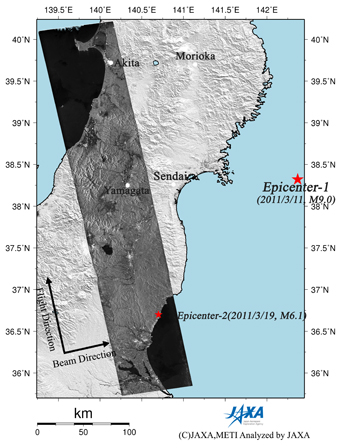
Fig.2: PALSAR interferogram indicating crustal deformation (left) and PALSAR amplitude image observed after the earthquake (March 20, 2011) (right).
(Click to View Enlarged Image)
The white square in the left figure indicates the area shown in Figure 3. Epicenter-1 and epicenter-2 indicate those of the M9.0 earthquake on March 11 and the M6.1 earthquake on March 19, respectively.
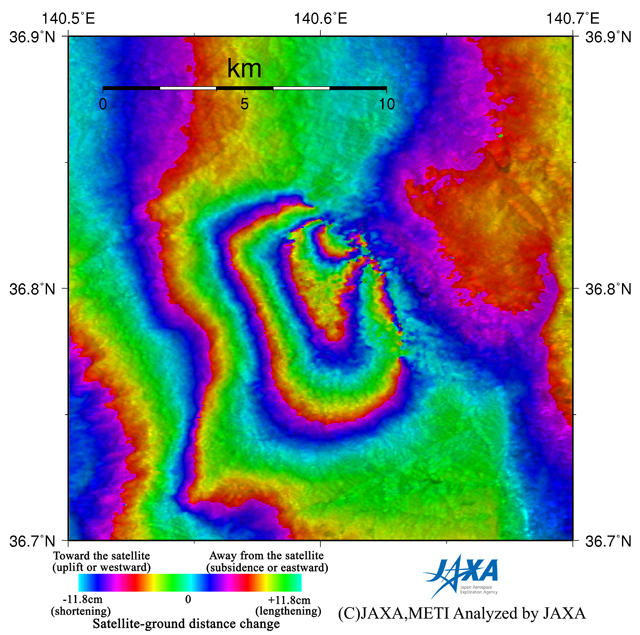
Fig.3: Enlarged interferogram enclosed by the white square in Fig.2 (left).
(Click to View Enlarged Image)
Figure 2 left is an interferogram generated from PALSAR data acquired before and after the earthquake using the DInSAR technique. A color pattern illustrates changes of satellite-ground distance for the period. Figure 2 right is a PALSAR amplitude image acquired after the earthquake indicating an observation field of about 450 km from south to north. In the interferogram (Fig. 2 left), there are so many color fringes over the whole area in the image. This suggests an extensive crustal deformation caused by the huge earthquake. Even in the city of Yamagata, where is about 150km away from the epicenter, ground movements of at least 60cm (including eastward displacement) is detected. In the enlarged interferogram (Fig. 3), we can find local fringes that are obviously different from the surrounding fringe pattern. This shows the crustal deformation associated with the M6.1 earthquake on March 19, 2011, in the northern Ibaraki Prefecture. We interpret that ground movements of 30-40cm occurred in the city of Takahagi in the north part of Ibaraki.
JAXA plans to continue ALOS observations of the afflicted area.
* The color changes from blue to red, yellow, green, and back to blue indicate an extension (and an opposite pattern indicates a shortening) of the satellite-ground distance. One color cycle is equal to 11.8 cm.
©JAXA EORC
Copyright©1997- JAXA EORC All rights reserved.