On September 4, 2010 (UTC), a magnitude 7.0 earthquake occurred inland (43.53° S, 172.12° E, 5 km in depth) on New Zealand's South Islands. The Japan Aerospace Exploration Agency (JAXA) performed an emergency observation on September 11 using the Phased Array type L-band Synthetic Aperture Radar (PALSAR) installed on the Advanced Land Observing Satellite (ALOS). In this report, we conduct differential interferometric SAR (DInSAR) processing to detect crustal deformation associated with the earthquake using PALSAR data acquired before (March 5, 2008) and after (September 11, 2010) the earthquake. ALOS/PALSAR observed the epicentral area including Christchurch where was damaged by the earthquake.
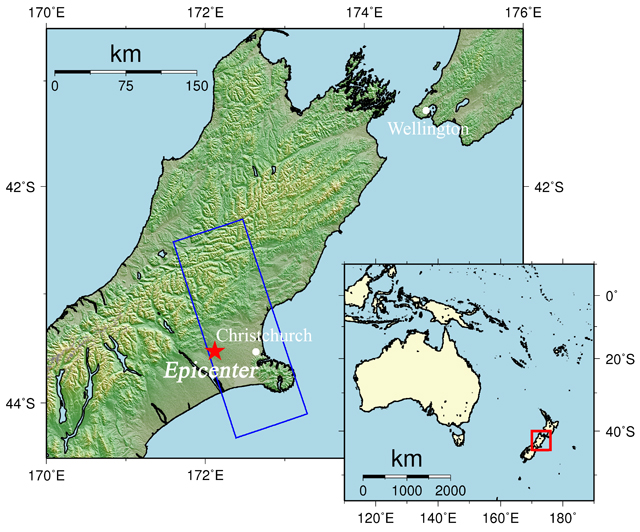
Fig.1: An overall view of the observation area (We refer to SRTM3 as terrain data).
(Click to View Enlarged Image)
The blue rectangle indicates the observation area shown in Fig. 2 and the red star represents the epicenter.
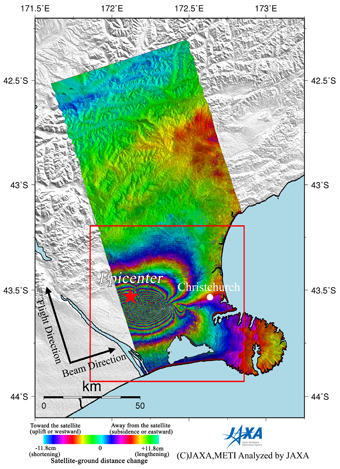
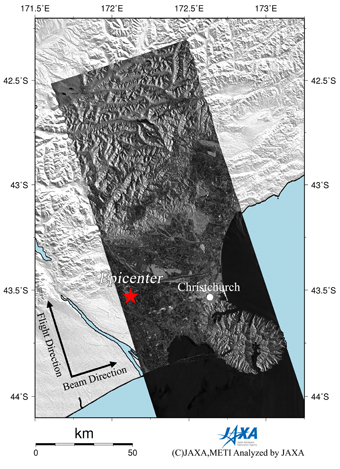
Fig.2: PALSAR interferogram indicating crustal deformation (left) and
PALSAR amplitude image observed after the earthquake (2010/9/11) (right).
(Click to View Enlarged Image)
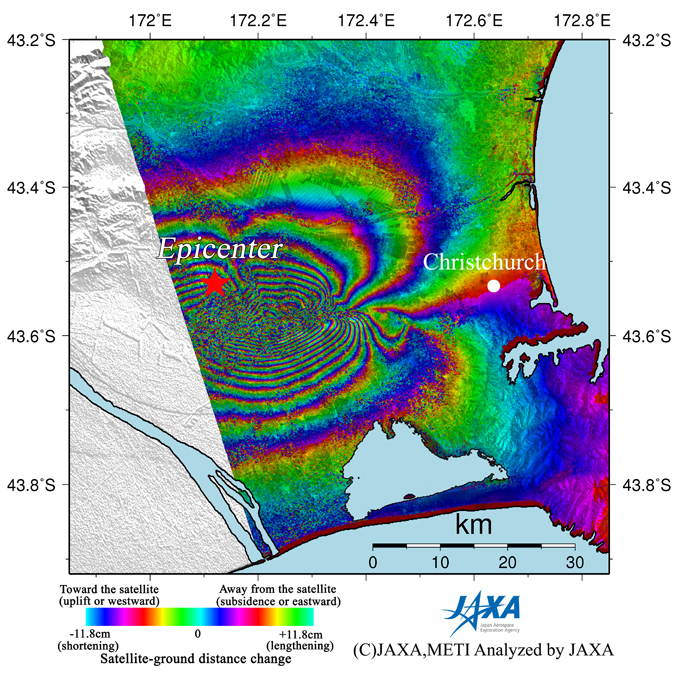
Fig.3: Enlarged interferogram enclosed by the red square in Fig. 2 (left).
(Click to View Enlarged Image)
Figure 2 (left) is an interferogram generated from PALSAR data using the DInSAR technique. Figure 2 (right) is a PALSAR amplitude image acquired after the earthquake. In the interferogram of Figure 2 (left), there are many color fringes in the epicentral area. A color fringe illustrates changes of satellite-ground distance, meaning crustal deformation along a slant range, for the period. The resultant interferogram indicates an extensive crustal deformation (more than 1.6 m at its maximum) caused by seismic faulting. In Figure 3, we found a low coherence area south of the epicenter extending east-west and a discrepancy of the color pattern between the area to the north and south. These indicate crustal deformations away from the satellite in the northern part and towards the satellite in the southern part, and suggest that this earthquake was caused by a right-lateral strike-slip faulting with a strike in the east-west direction. Figure 3 also shows a small deformation in Christchurch.
JAXA plans to continue ALOS observations of the afflicted area in the New Zealand.
* The color changes from blue to red, yellow, green, and back to blue indicate an extension (and an opposite pattern indicates a shortening) of the satellite-ground distance. One color cycle is equal to 11.8 cm.
©JAXA EORC
Copyright©1997- JAXA EORC All rights reserved.