On December 20, 2010 (UTC), a magnitude 6.5 earthquake occurred in southeastern Iran (28.49° N, 59.12° E, 11.8 km in depth). The Japan Aerospace Exploration Agency (JAXA) performed an emergency observation on December 31 using the Phased Array type L-band Synthetic Aperture Radar (PALSAR) installed on the Advanced Land Observing Satellite (ALOS). In this report, we conduct differential interferometric SAR (DInSAR) processing to detect crustal deformation associated with the earthquake using PALSAR data acquired before (September 30, 2010) and after (December 31, 2010) the earthquake.
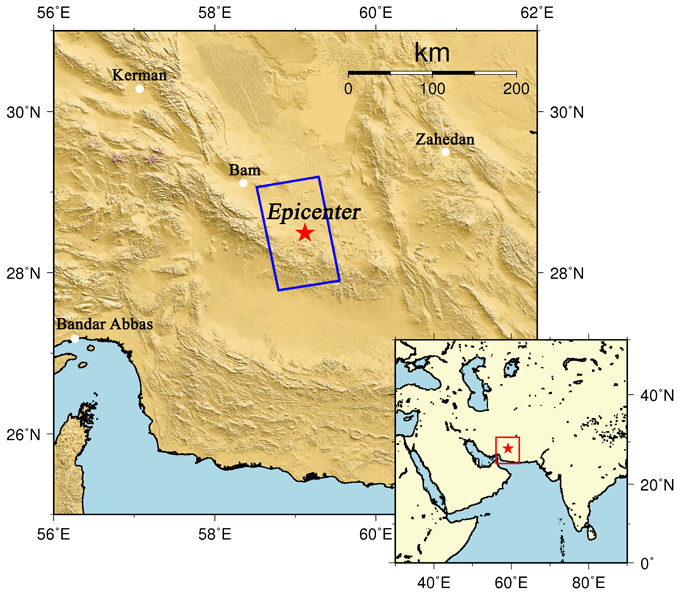
Fig.1: An overall view of the observation area (We refer to SRTM3 as terrain data).
(Click to View Enlarged Image)
The blue rectangle indicates the observation area shown in Fig. 2 and the red star represents the epicenter.
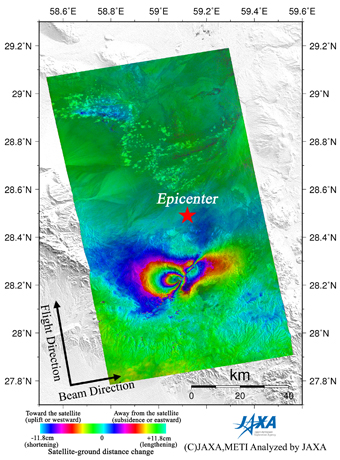
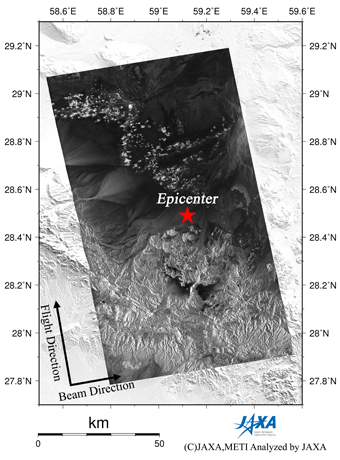
Fig.2: PALSAR interferogram indicating crustal deformation (left) and
PALSAR amplitude image observed after the earthquake (2010/12/31) (right).
(Click to View Enlarged Image)
Figure 2 (left) is an interferogram generated from PALSAR data using the DInSAR technique. Figure 2 (right) is a PALSAR amplitude image acquired after the earthquake. In the interferogram (Figure 2 left), there are obvious color fringes which illustrate changes of satellite-ground distance, meaning crustal deformation along a slant range caused by seismic faulting. The resultant interferogram suggests that this earthquake was caused by a right-lateral strike-slip faulting with a strike in the northeast-southwest direction.
* The color changes from blue to red, yellow, green, and back to blue indicate an extension (and an opposite pattern indicates a shortening) of the satellite-ground distance. One color cycle is equal to 11.8 cm.
©JAXA EORC
Copyright©1997- JAXA EORC All rights reserved.