On February 27, 2010 (UTC), a magnitude 8.8 earthquake occurred off the coast of middle Chile, in the South America. The Japan Aerospace Exploration Agency (JAXA) had performed emergency observations since the main shock using the Phased Array Type L-band Synthetic Aperture Radar (PALSAR) installed on the Advanced Land Observing Satellite (ALOS) to determine the state of damage caused by the earthquake. These observations were made on 9 adjacent satellite paths in total (p111-119) from ascending orbits with same observation mode (Fig. 1), and we conducted differential interferometric SAR (DInSAR) analysis to detect crustal deformation associated with the earthquake.
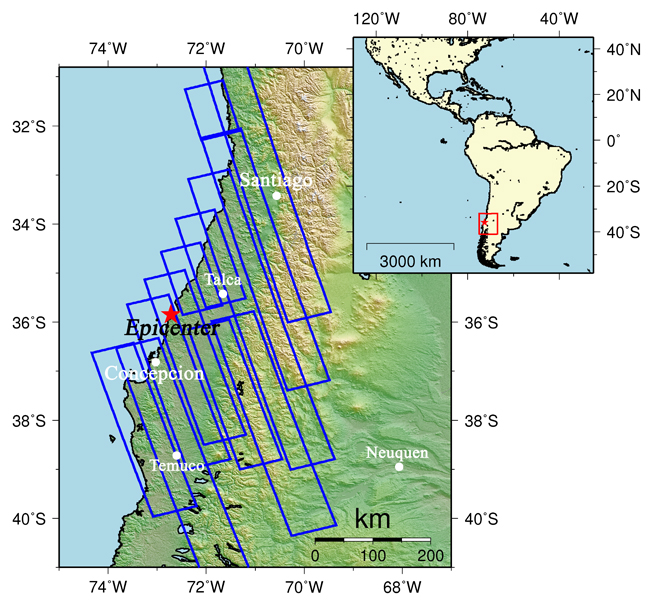
Fig.1: An overall view of the observation area (we refer to SRTM3 as terrain data.)
(Click to View Enlarged Image)
The blue rectangle indicates observation areas shown in Figures 2 and 3, and the red star represents the epicenter.
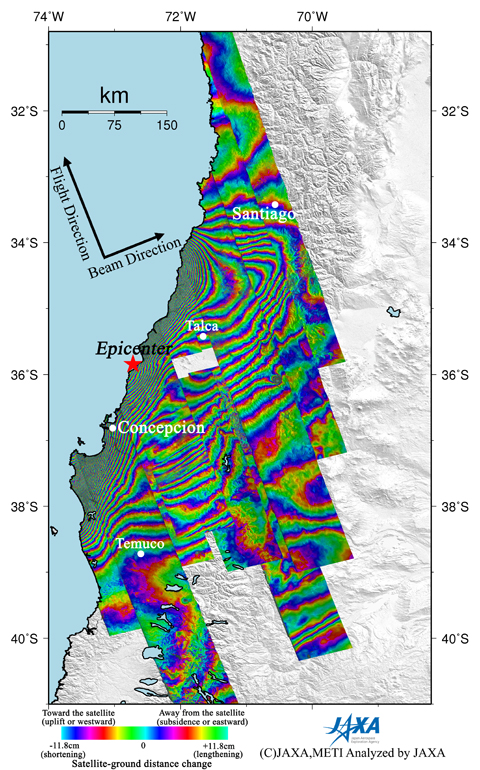
Fig.2: Mosaicked PALSAR interferogram showing deformation map.
(Click to View Enlarged Image)
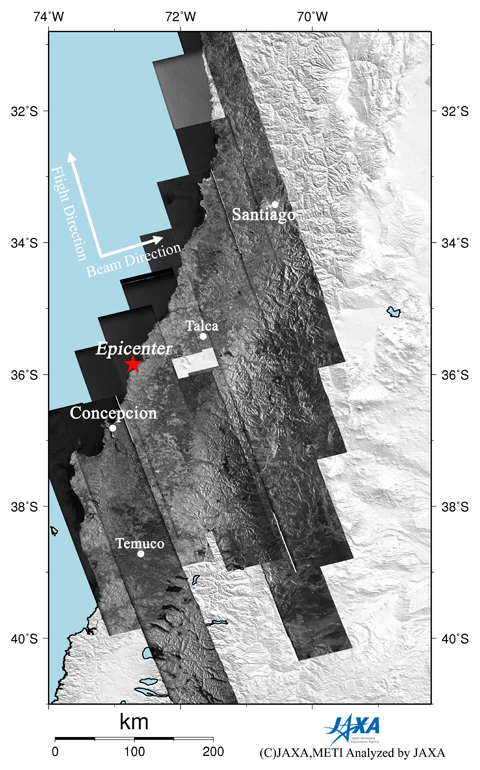
Fig.3: Mosaicked PALSAR amplitude image.
(Click to View Enlarged Image)
Figure 2 is a mosaicked interferogram generated from PALSAR data of 9 contiguous paths (p111-119) acquired before and after the earthquake using the DInSAR technique. A color pattern illustrates changes of satellite-ground distance for the period. Figure 3 is a mosaicked PALSAR amplitude image acquired after the earthquake indicating an observation field of 1000 km from south to north. In the interferogram (Fig. 2), there are so many color fringes along the coast and obvious fringes even in inland area around Santiago. It is interpreted that quite large and extensive ground movement was caused by a seismic faulting. Considering a mechanism of this earthquake, most of color pattern along the coast indicate an uplift or westward displacement.
* The color changes from red, blue, green, yellow and back to red indicate an shortening of the satellite-ground distance, and one color cycle = 11.8cm.
©JAXA EORC
Copyright©1997- JAXA EORC All rights reserved.