Dataset
High-Resolution Land-Use and Land-Cover Map of Vietnam for 2020
(Released in September 2023 / Version 23.09)
Download product
User registration is required to download the data. Please click here about download and user registration details.
1. Summary
- Higher overall accuracy
- Used time series of satellite data (Sentinel-2, Sentinel-1, PALSAR-2/ScanSAR with 6 seasons)
- Applied CNN approach which spans over time and features dimensions
- A better spatial detail compared to previous versions.
- Added Aquaculture category and remove Evergreen Needleleaf Forest category.
2. Data used for classification
- Data 1: Sentinel-2 Level-2A (*1)
- Data 2: Sentinel-1 Level 1 (*1)
- Data 3: ALOS-2/PALSAR-2/ScanSAR Level 2.2
- Data 4: ALOS/PRISM/DSM
- Data 5: OpenStreetMap (road networks) (*2)
*1: Google Earth Engine
*2: OpenStreetMap © OpenStreetMap contributors
3. Classification algorithm
3.1 Preprocessing
- Sentinel-2: masking cloud, creating median composite using multiple years data, creating vegetation indices (NDVI, EVI, GNDVI, GRVI, NDWI, GSI)
- Sentinel-1: angular-based radiometric correction, speckle noise filtering, creating indices (VH-VV, VH/VV)
- PALSAR-2/ScanSAR: speckle noise filtering, creating indices (HH-HV, HH/HV, NDI, NLI)
*NDVI: Normalized Difference Vegetation Index, EVI: Enhanced Vegetation Index, GNDVI: green normalized difference vegetation index, GRVI: Green and Red ratio Vegetation Index, NDWI: Normalized Difference Water Index, GSI: Grain Size Index, NDI: Normalized Difference Index.
3.2 Algorithm
Convolutional Neural Network classification with convolutional process was conducted over time and feature dimension. The source code of the algorithm was inherited from the SACLASS-2 with some modifications to compatibility with 6-season data.
4. Data format
| Period of coverage | In the year 2020 |
|---|---|
| Coordinate system | Geographic latitude and longitude coordinates (WGS84) |
| Tile unit | 1 degree × 1 degree, (11,133 pixels × 11,133 lines) |
| Mesh size | (1 / 11,133) degree × (1 / 11,133) degree (corresponding to approx. 10 m × 10 m) |
| Directory and file naming convention |
2020VNM_v23.09 |--
(In the above case, the product created for the Vietnam area in the year 2020, released in September 2023, refers to a range of 22 to 23 degrees north latitude and 105 to 106 degrees east longitude.)- N08E104: indicates 8 to 9 degrees north latitude and 104 to 105 degrees east longitude - 2020: indicates the year of the LULC map - v23.09: indicates the version of the product, including the year (2023) and the month (09-September), in which the map was pub lished - 10m: indicates the spatial resolution of the map is 10 meters |
| Format | GeoTIFF format |
| Number of files | 60 × 1 period |
The value of each pixel is the ID number of the category for classification as follows:
- #1: Water
- #2: Urban/Built-up
- #3: Rice
- #4: Other Crops
- #5: Grass/Shrub
- #6: Woody Crops/Orchards
- #7: Barren
- #8: Evergreen Forest
- #9: Deciduous Forest
- #10: Plantation Forest
- #11: Mangrove Forest
- #12: Aquaculture
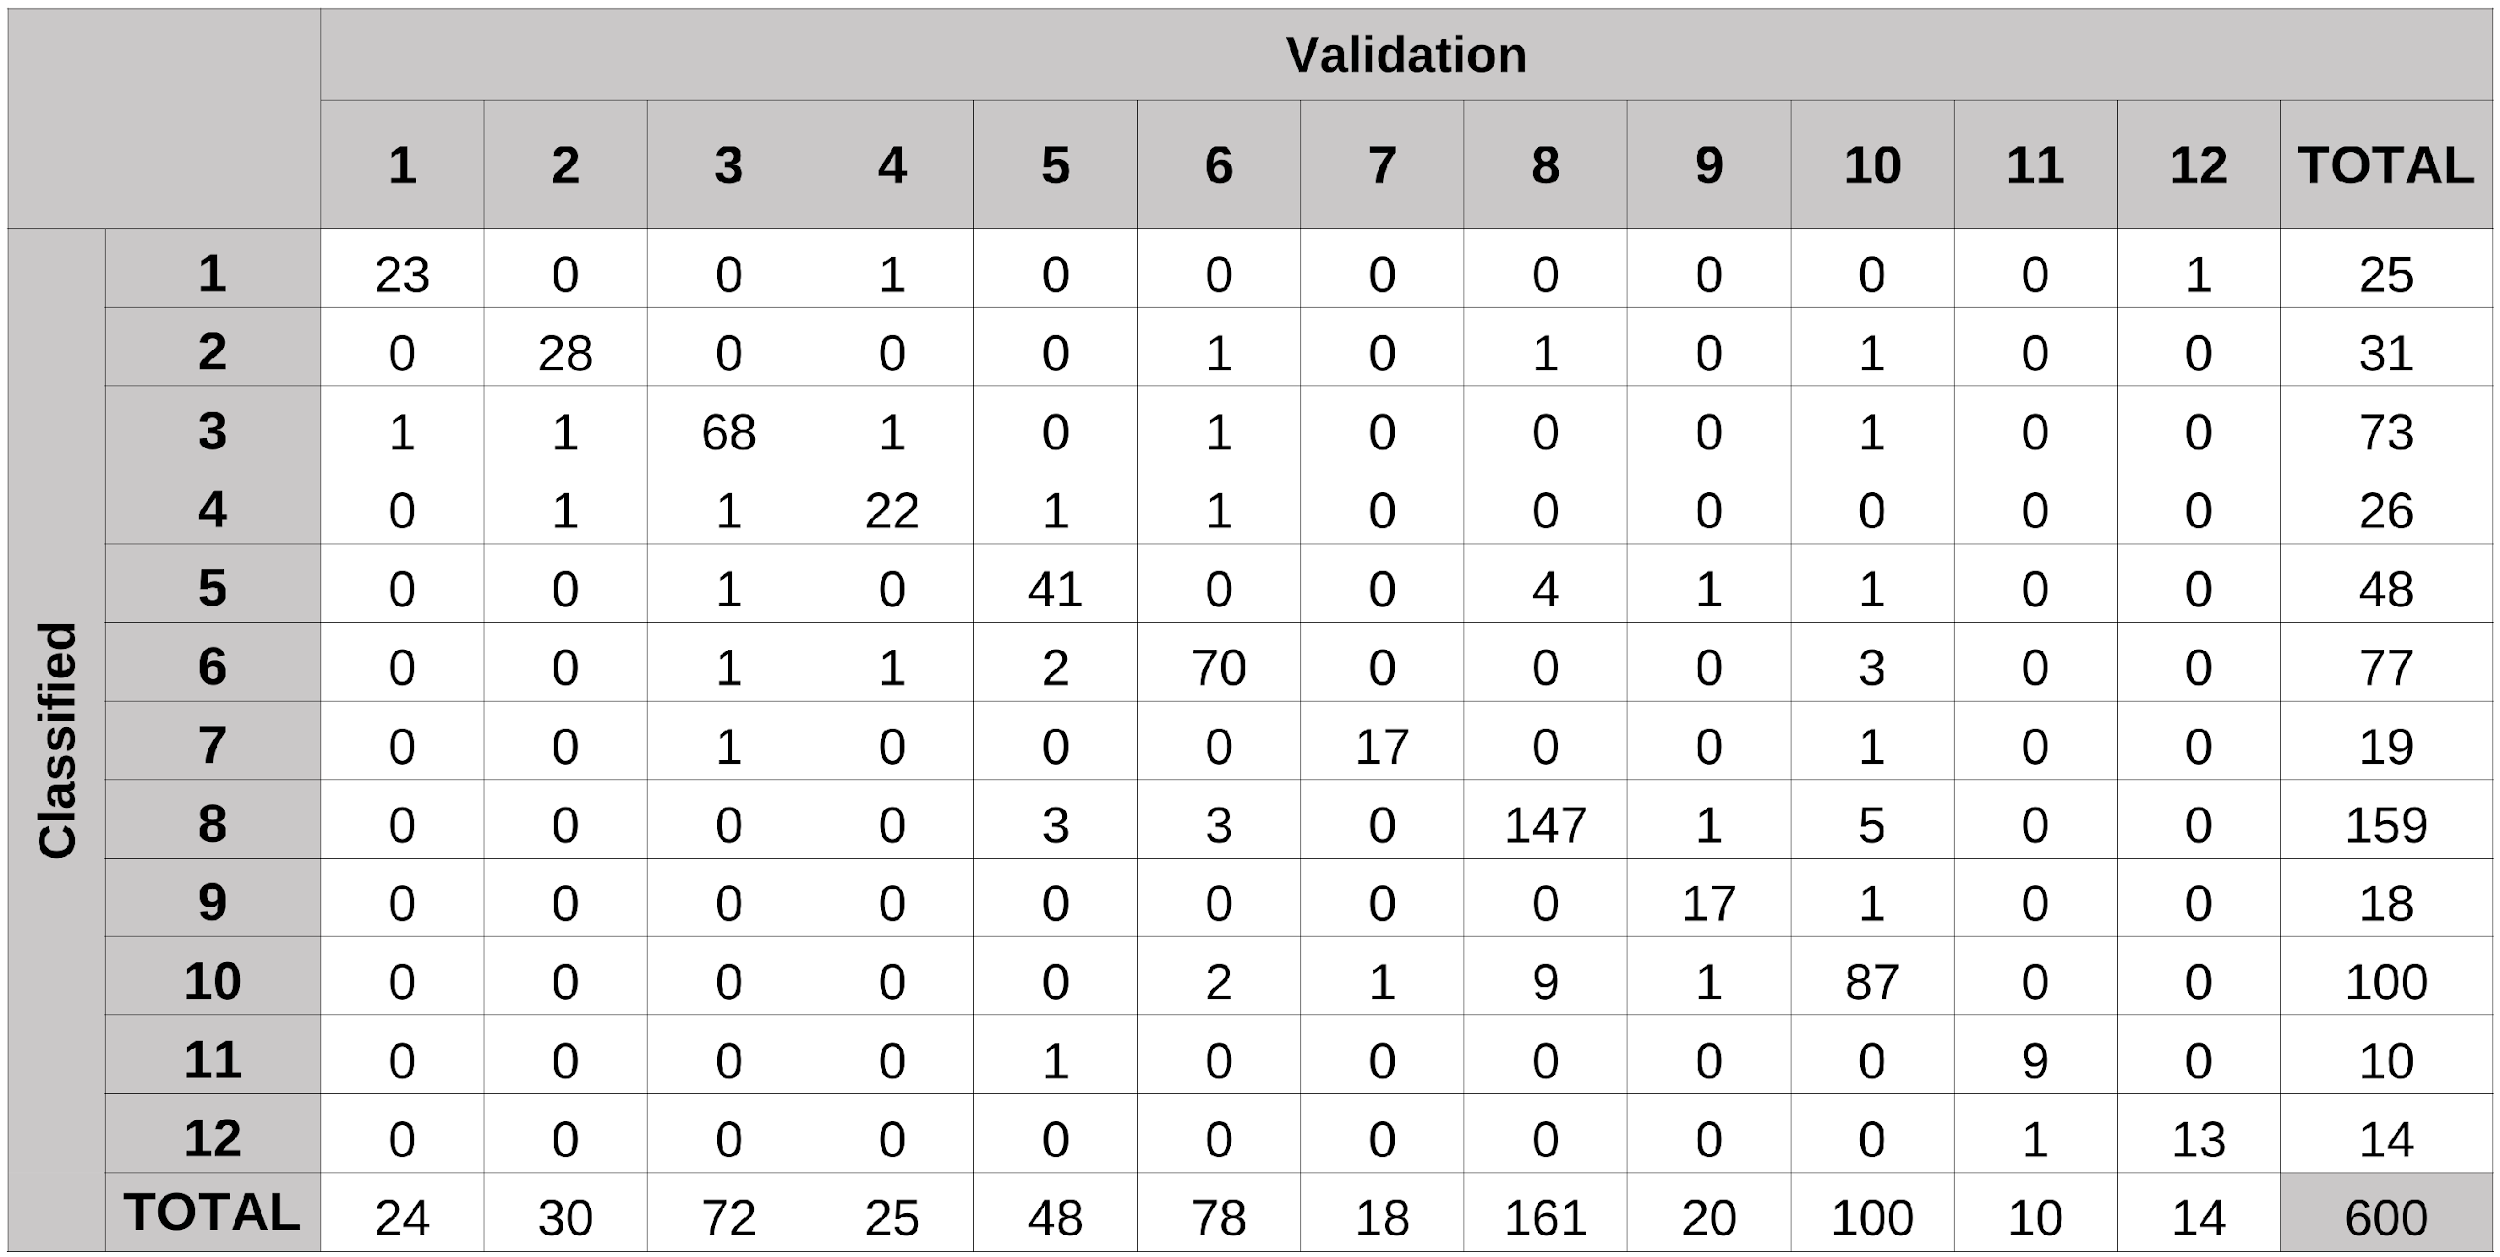
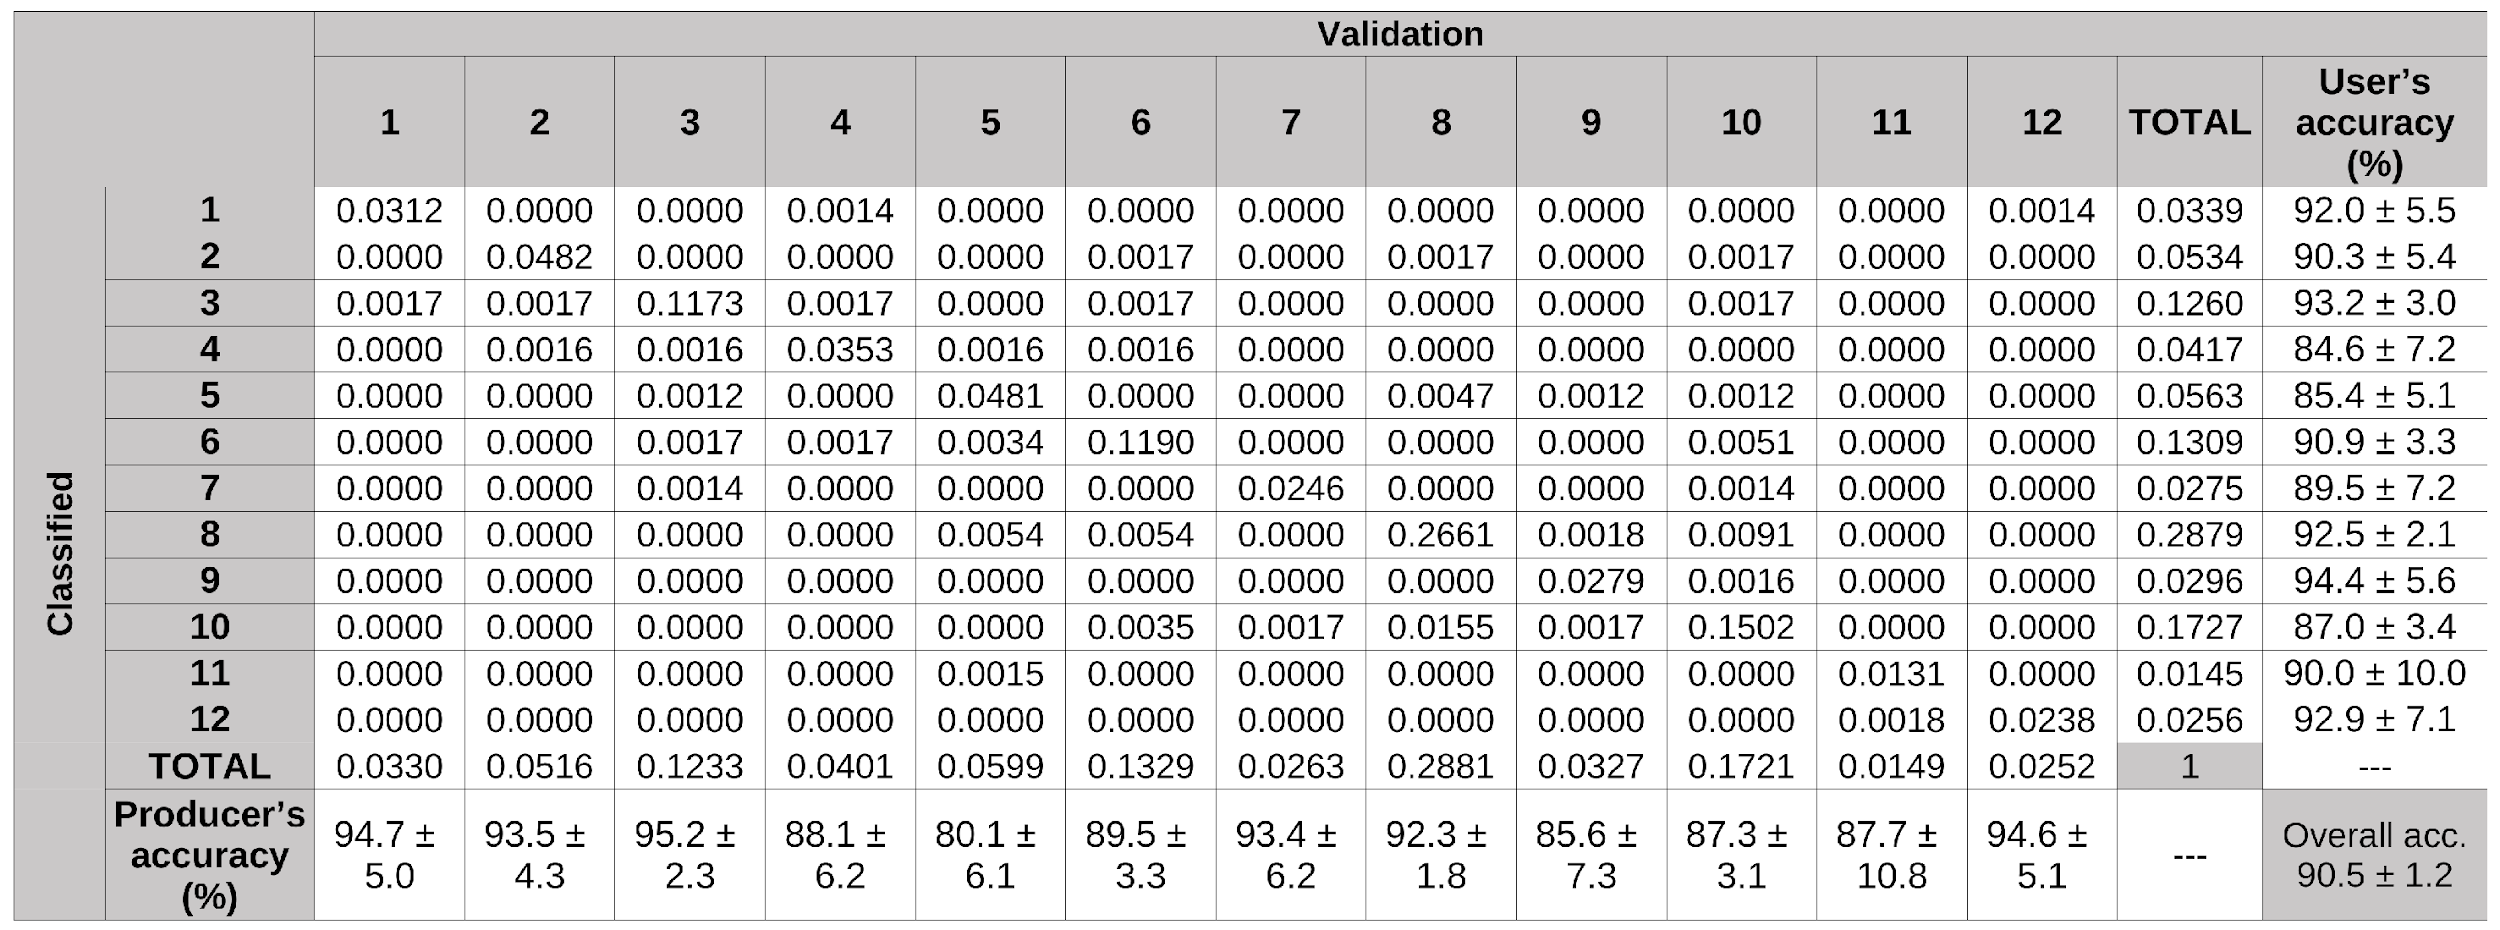
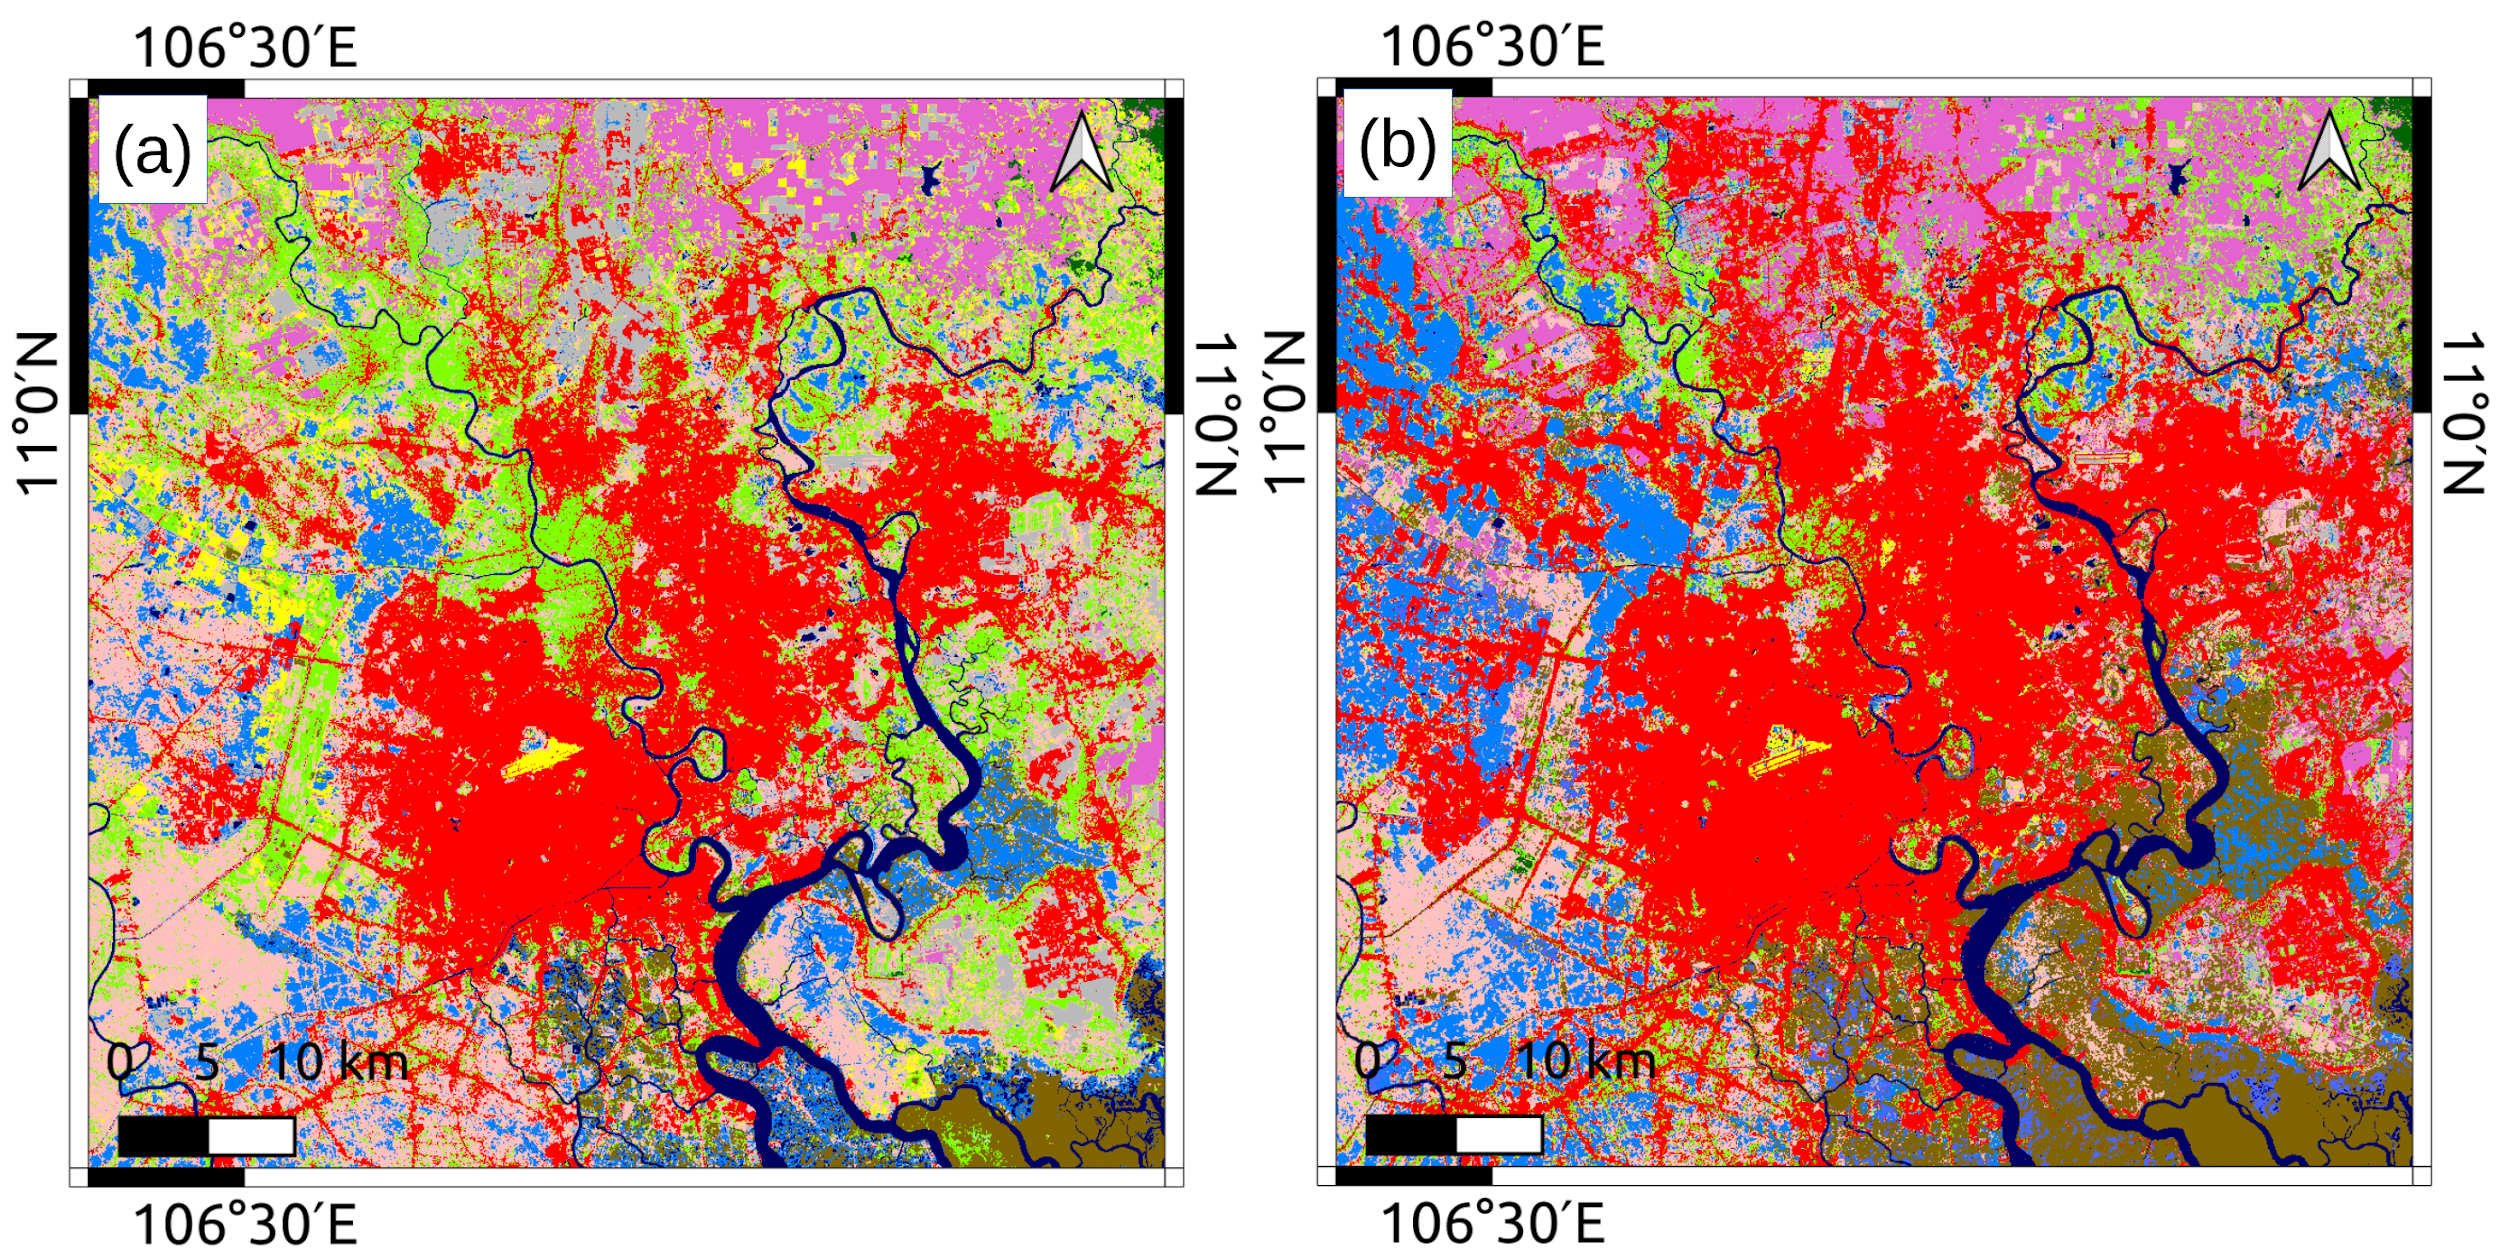
5. Accuracy verification

by comparing between 2016VNM_v20.06 (a) and 2020VNM_v23.09 (b)
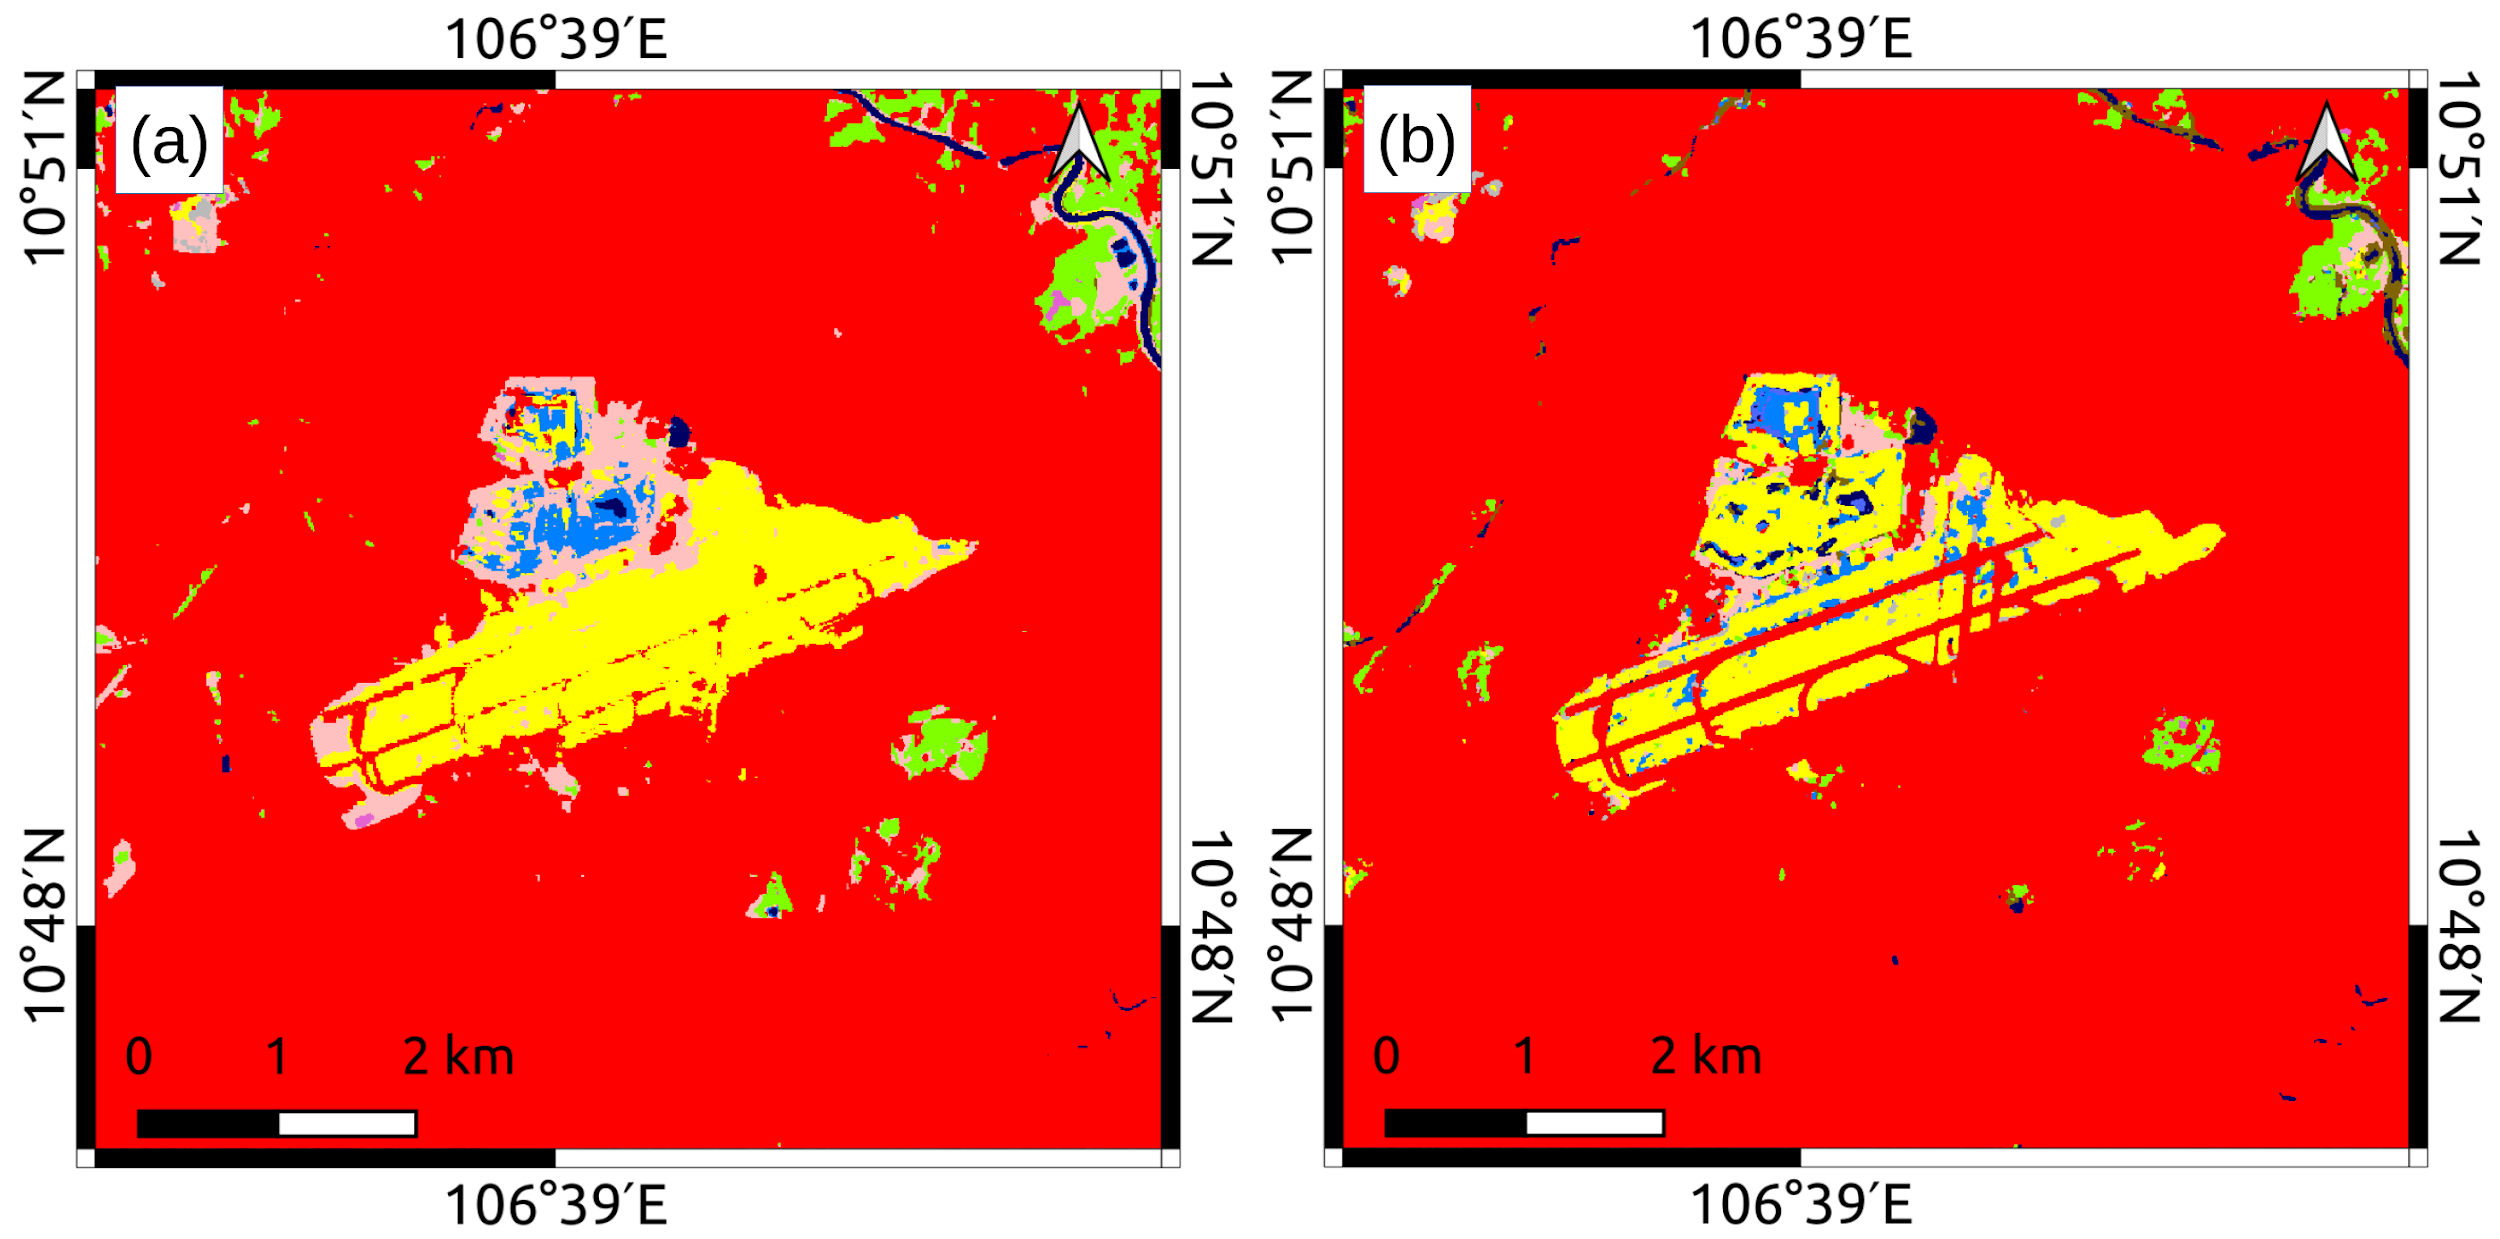
for the classification of LULC in Tan Son Nhat airport in Ho Chi Minh City.
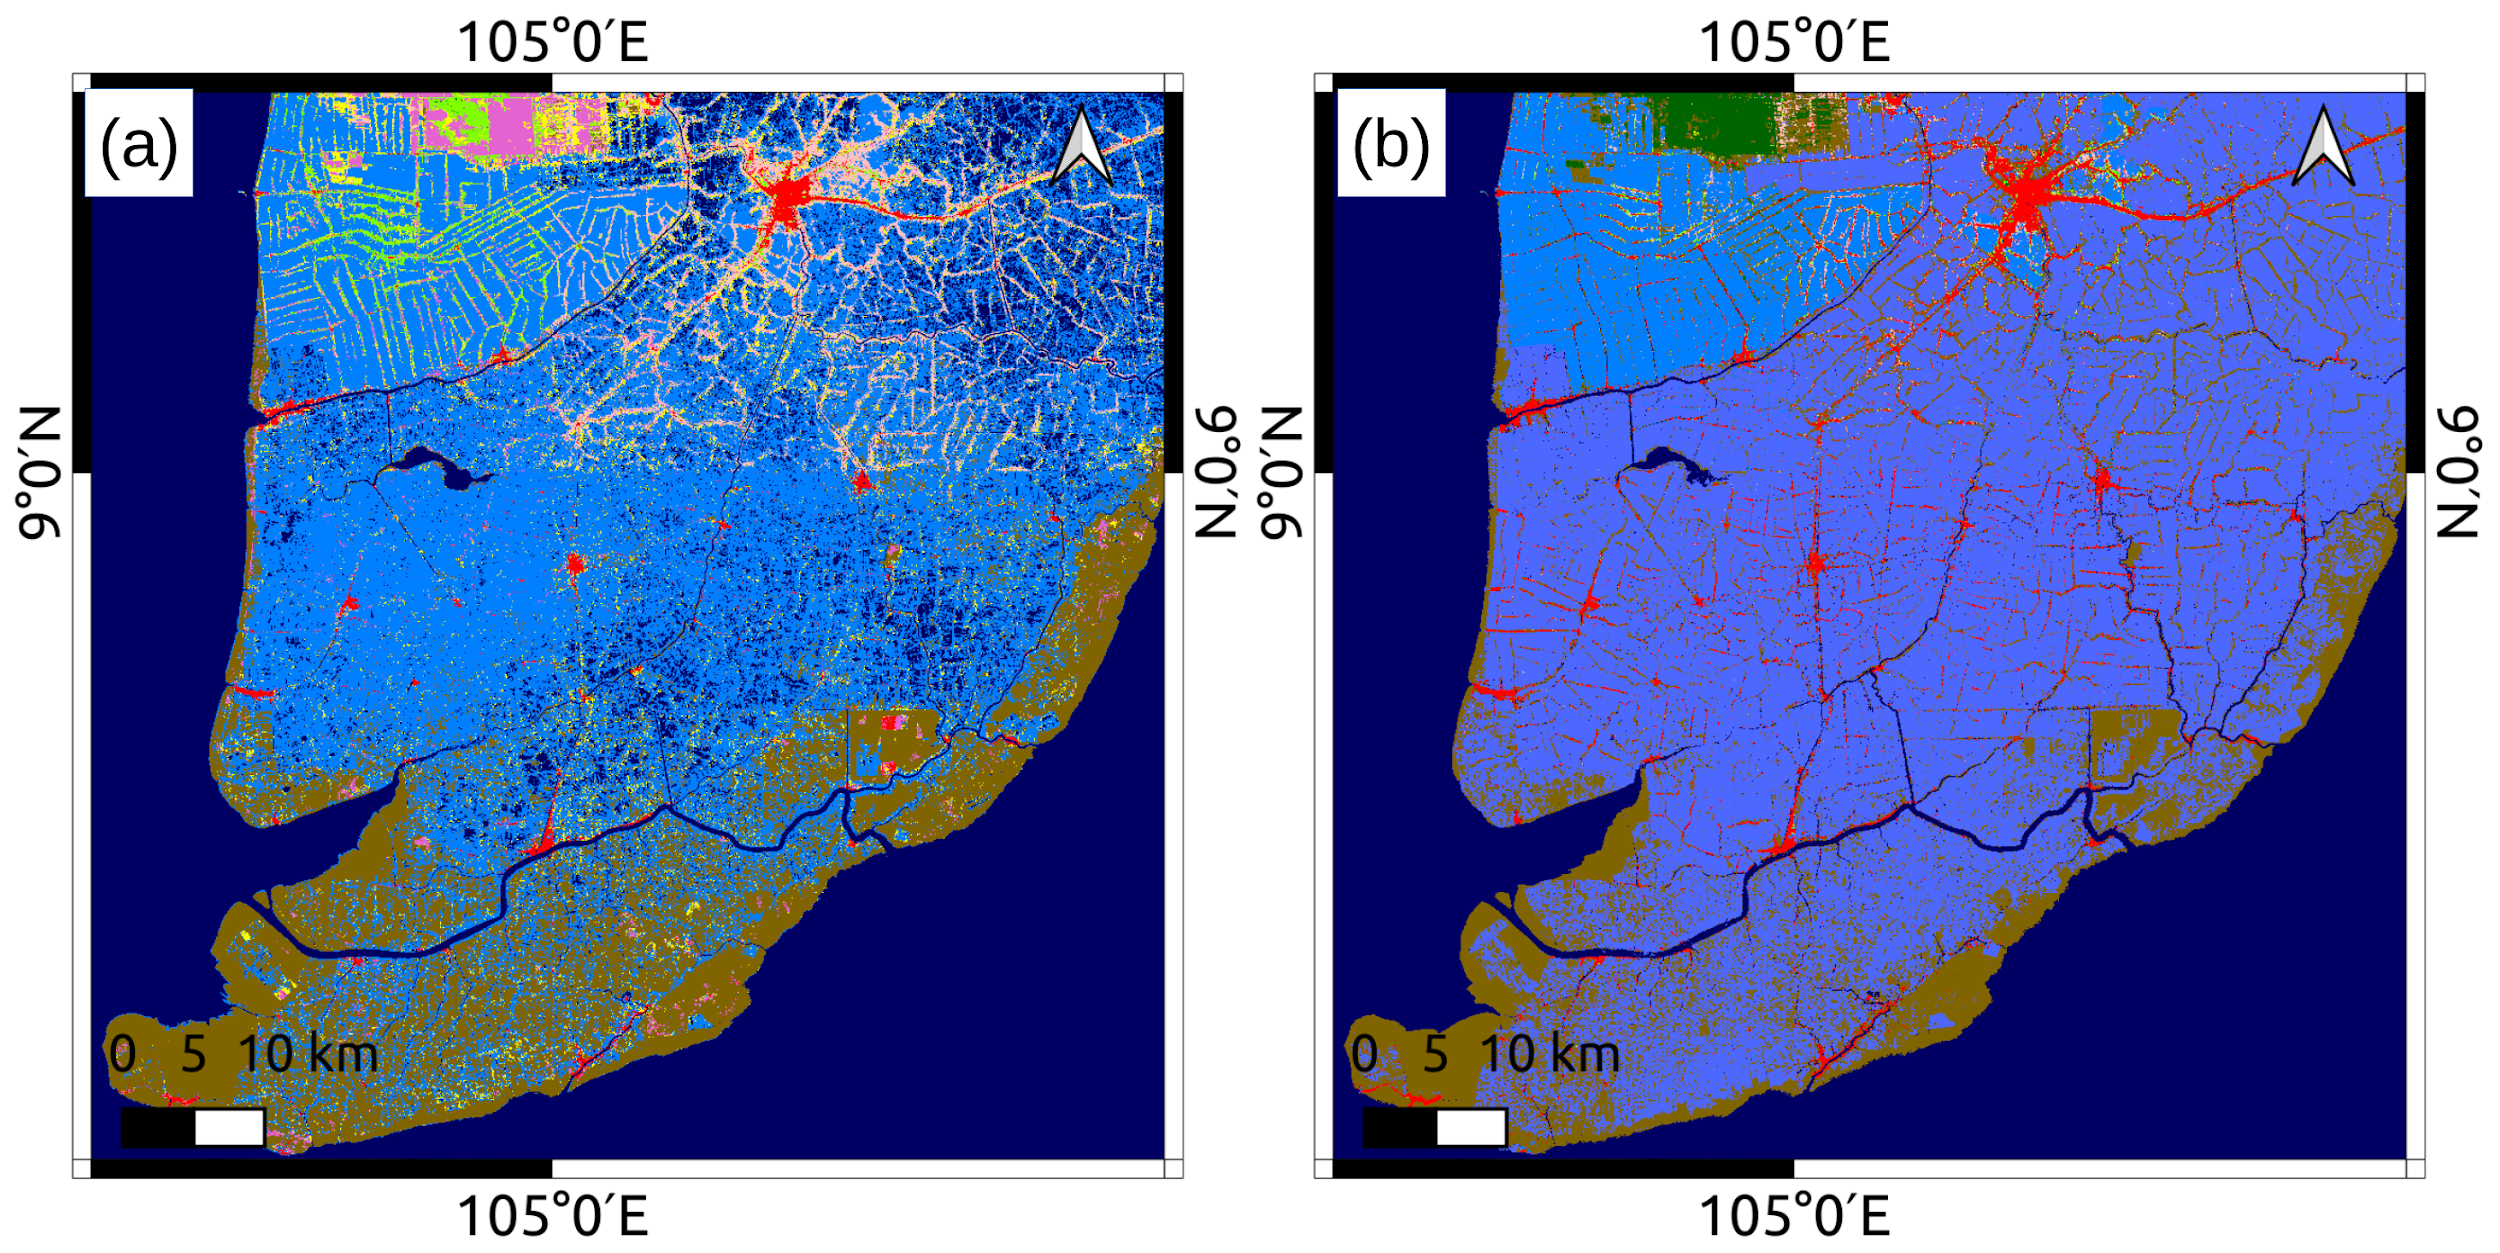
2016VNM_v20.06 (a) classified most of aquaculture areas into rice or water
6. References
- Sota HIRAYAMA, Takeo TADONO, Masato OHKI, Yousei MIZUKAMI, Kenlo NISHIDA NASAHARA, Koichi IMAMURA, Naoyoshi HIRADE, Fumi OHGUSHI, Masanori DOTSU and Tsutomu YAMANOKUCHI (2022): Generation of High-Resolution Land Use and Land Cover Maps in JAPAN Version 21.11. Journal of The Remote Sensing Society of Japan Vol. 42 No. 3 pp. 199-216
- Olofsson, P. et al. (2014): Good practices for estimating area and assessing accuracy of land change. Remote. sensing Environ. 148, 42-57.