Dataset
High-Resolution Land-Use and Land-Cover Map of Mainland Vietnam in the year 2007
(Released in April 2021 / Version 21.04)
You can switch layers with check boxes.
Download product
User registration is required to download the data. Please click here about download and user registration details.
1. Summary
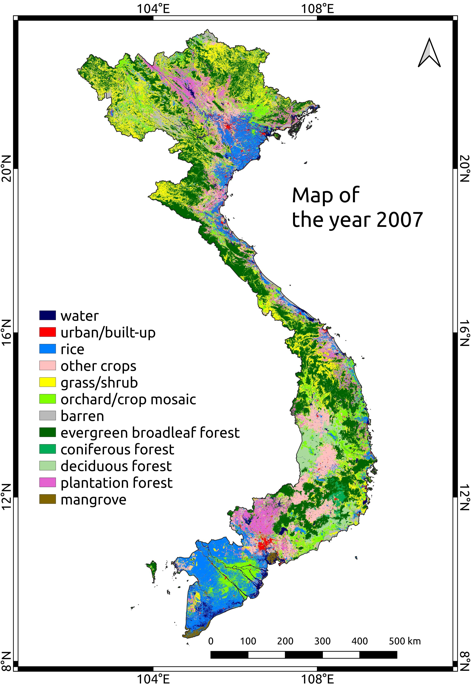
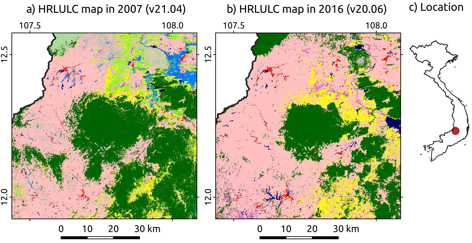
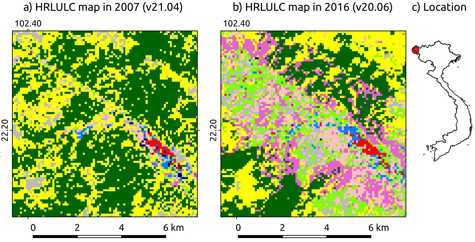
This High-Resolution Land-Use Land-Cover (HRLULC) map is created for the entire mainland Vietnam (excluding isolated islands) in the year 2007 (Figure 1). This version 21.04 (2007VNM_v21.04) targets the past situation (2007) for the reference of dynamics of land use & land cover. By comparing 2007VNM_v21.04 and the HRLULC map of mainland Vietnam version 20.06 (2016VNM_v20.06) (whose target year is 2016), the users may discuss the changes which happened in the period of 2007–2016. For example, Figure 2 and Figure 3 present the loss of natural forest between 2007–2016 in some areas of Dak Nong province and Dien Bien province, Vietnam. The users are advised to use the 2016VNM_v20.06 if they need the map which describes the most recent situation.
The 2007VNM_v21.04 and the 2016VNM_v20.06 have the same land use/land cover category system, which contains 12 categories in total. In terms of forests, these products include several natural forest classes such as evergreen broad-leaf forest, coniferous forest, deciduous forest, and one plantation forest class, which represents popular plantation forest in Vietnam such as acacia, eucalyptus, rubber, and pines. This detailed level of land use/land cover will provide good input to studies of critical environmental issues such as actual deforestation detection, carbon assessment, land process modeling, and hence directly associates with great concerns such as climate change and biodiversity loss.
The 2007VNM_v21.04 and the 2016VNM_v20.06 have the same land use/land cover category system, which contains 12 categories in total. In terms of forests, these products include several natural forest classes such as evergreen broad-leaf forest, coniferous forest, deciduous forest, and one plantation forest class, which represents popular plantation forest in Vietnam such as acacia, eucalyptus, rubber, and pines. This detailed level of land use/land cover will provide good input to studies of critical environmental issues such as actual deforestation detection, carbon assessment, land process modeling, and hence directly associates with great concerns such as climate change and biodiversity loss.
2. Data used for creating the map
- Data 1: Multi-temporal ALOS/PALSAR RTC data 12.5 m resolution: 626 scenes (2007)
- Data 2: Multi-temporal ALOS/AVNIR-2 ORI data 10 m resolution: 177 scenes (2007)
- Data 3: AW3D30 30 m resolution (1° x 1° tile size): 60 tiles (2006–2011)
- Data 4: Multi-temporal Landsat-5 Surface Reflectance Tier 1, tiling to 1° x 1° tile size and conducting median composites for each 1.5 months (archived and processed by Google Earth Engine): 368 tiles (2007)
- Data 5: Multi-temporal Landsat-7 Surface Reflectance Tier 1, tiling to 1° x 1° tile size and conducting median composites for each 1.5 months (archived and processed by Google Earth Engine): 454 tiles (2007)
- Data 6: Defense Meteorological Satellite Program Operational Line Scanner (DMSP-OLS) nighttime light image in 2007 produced by the National Oceanic and Atmospheric Administration (NOAA) (archived and processed by WorldPop)
- Data 7: Distance to OpenStreetMap (OSM) major roads (archived and processed by WorldPop)
- Data 8: ~113,000 reference data points collected by visual interpretation for training model, 1,200 other reference data points collected by visual interpretation for validation of the result.
3. Classification algorithm
Bayesian classifier with kernel density estimation (Hashimoto et al., 2014)
4. Data format
| Period of coverage | In the year 2007 |
|---|---|
| Coordinate system | Geographic latitude and longitude coordinates (WGS84) |
| Tile unit | 1 degree x 1 degree, (11,133 pixels x 11,142 lines) |
| Mesh size | (1 / 11,133) degree × (1 / 11,142) degree (corresponding to approximately 10 m × 10 m) |
| Directory and file naming convention |
2007VNM_v21.04 |--
(In the above case, the product created for the Vietnam area in the year 2007, released in April 2021, refers to a range of 22 to 23 degrees north latitude and 105 to 106 degrees east longitude.)- “N22E105” indicates coordinate of the map that is 22 to 23 degrees north latitude and 105 to 106 degrees east longitude. - “2007” indicates the year of the map that is 2007. - “v21.04” indicates the version of the HRLULC map. - “10m” indicates the spatial resolution that is 10 m. |
| Format | GeoTIFF format |
| Number of files | 60 x 1 period |
The value of each pixel is ID number of the category for classification as follows:
- #1: Water
- #2: Urban/Built-up
- #3: Rice
- #4: Other crops
- #5: Grass/Shrub
- #6: Orchard/Crop mosaic
- #7: Barren
- #8: Evergreen Broadleaf Forest
- #9: Coniferous Forest
- #10: Deciduous Forest
- #11: Plantation Forest
- #12: Mangrove
5. Accuracy verification
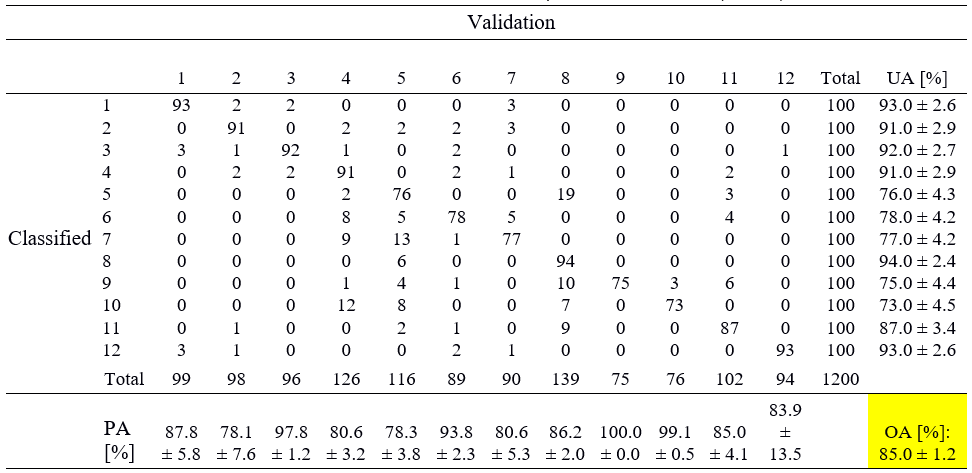
Table 1 present the accuracy assessment of the HRLULC map including producers (PA), users (UA), and overall accuracy (OA). The confusion matrix was constructed using 1,200 validation points which are sampled by a stratified random sampling method and then conducting visual interpretation independent of the training dataset.
Table 1: Confusion Matrix for HRLULC map of Vietnam in 2007 (2007VNM_v21.04)


Figure 1: HRLULC map of Vietnam in 2007 (2007VNM_v21.04)

Figure 2: Natural forest loss between 2007 - 2016 in Dak Nong province, Central Highlands, Vietnam identified by HRLULC maps 2007VNM_v21.04 and 2016VNM_v20.06

Figure 2: Natural forest loss between 2007 - 2016 in Muong Nhe district, Dien Bien province, Vietnam identified by HRLULC maps 2007VNM_v21.04 and 2016VNM_v20.06
6. References
- "A New Method to Derive Precise Land-use and Land-cover Maps Using Multi-temporal Optical Data", Shutaro Hashimoto, Takeo Tadono, Masahiko Onosato, Masahiro Hori and Kei Shiomi (2014), Journal of The Remote Sensing Sociery of Japan, 34 (2), 102-112.
- "New JAXA High-Resolution Land Use/Land Cover Map for Vietnam Aiming for Natural Forest and Plantation Forest Monitoring", Hoang, T.T., Truong, V.T., Hayashi, M., Tadono, T., Nasahara, K.N., (2020), Remote Sensing, 12(17), 2707.
- "Analysis of Natural Forest and Plantation Forest Changes in Vietnam Using Remote Sensing Data", Hoang Thanh Tung, Doctoral thesis, University of Tsukuba, 2021.
Acknowledgements
- Multi-temporal ALOS/AVNIR-2 ORI, ALOS/PALSAR RTC, AW3D30 data provided by courtesy of JAXA.
- Multi-temporal Landsat-5 and Landsat-7 images provided by courtesy of the U.S. Geological Survey.
- DMSP-OLS nightlight images and distance to OSM major roads datasets provided by courtesy of NOAA and OSM, respectively.
- Data archiving and processing services provided by courtesy of Google Earth Engine, Alaska Satellite Facility, and WorldPop.
- The Project for Human Resource Development Scholarship by Japanese Grant Aid (JDS).