Dataset
High-Resolution Land-Use and Land-Cover Map of Mainland Vietnam [2016]
(Released in June 2020 / Version 20.06)
You can switch layers with check boxes.
Download product
User registration is required to download the data. Please click here about download and user registration details.
1. Summary
This High-Resolution Land-Use Land-Cover (HRLULC) Map is created for the entire mainland Vietnam (excluding isolated islands) in the year 2016. The new features of this product in comparison to previous HRLULC Vietnam maps is the inclusion of several natural forest classes such as evergreen broad-leaf forest, coniferous forest and deciduous forest, and one plantation forest class, which represents for popular plantation forests in Vietnam such as acacia, eucalyptus, rubber and pines. All categories are mapped across various geographical and climatic regions in Vietnam. This detailed level of land use/land cover will provide good input to studies of critical environmental issues such as actual deforestation detection, carbon assessment, land process modeling, and hence directly associates with great concerns such as climate change and biodiversity loss.
2. Data used for creating the map
- Data 1: Multi-temporal PALSAR-2/ScanSAR 50 m resolution (in 1° x 1° tile size): 450 tiles (2016)
- Data 2: Global 25m resolutions ALOS-2 / PALSAR-2 mosaic dataset in 2016: 60 tiles (2016)
- Data 3: AW3D30 30 m resolution (1° x 1° tile size): 60 tiles (2006 – 2011)
- Data 4: Multi-temporal Sentinel-1 SAR GRD C-band Synthetic Aperture Radar Ground Range Detected, log scaling, tiling to 1° x 1° tile size and conducting median composites for each 1.5 months (archived and processed by Google Earth Engine): 480 tiles (2016)
- Data 5: Multi-temporal Landsat 8 OLI Surface Reflectance Tier 1, tiling to 1° x 1° tile size and conducting median composites for each 1.5 months (archived and processed by Google Earth Engine): 480 tiles (2016)
- Data 6: Multi-temporal Sentinel-2 MSI, MultiSpectral Instrument, Level-1C, tiling to 1° x 1° tile size and conducting median composites for each 1.5 months (archived and processed by Google Earth Engine): 480 tiles (2016)
- Data 7: ~13,000 ground-truth photos and ~80,000 along-route time-lapse photos collected from Vietnam field surveys (2015–2020), ~180,000 reference data points collected by visual interpretation for training model, 2700 other reference data points collected by visual interpretation for validation of the result.
3. Classification algorithm
Bayesian classifier with kernel density estimation (Hashimoto et al., 2014)
4. Data format
| Period of coverage | In the year 2016 |
|---|---|
| Coordinate system | Geographic latitude and longitude coordinates (WGS84) |
| Tile unit | 1 degree x 1 degree, (11,133 pixels x 11,142 lines) |
| Mesh size | (1 / 11,133 degree × (1 / 11,142) degree (corresponding to approximately 10 m × 10 m) |
| Directory and file naming convention |
2016VNM_v20.06 |--
(In the above case, the product created for the Vietnam area in the year 2016, released in June 2020, refers to a range of 22 to 23 degrees north latitude and 105 to 106 degrees east longitude.)- “N22E105” indicates coordinate of the map that is 22 to 23 degrees north latitude and 105 to 106 degrees east longitude. - “2016” indicates the year of the map that is 2016. - “v20.06” indicates the version of the HRLULC map. - “10m” indicates the spatial resolution that is 10 m. |
| Format | GeoTIFF format |
| Number of files | 60 x 1 period |
The value of each pixel is ID number of the category for classification as follows:
- #1: Water
- #2: Urban/Built-up
- #3: Rice
- #4: Other crops
- #5: Grass/Shrub
- #6: Orchard/Crop mosaic
- #7: Barren
- #8: Evergreen Broadleaf Forest
- #9: Coniferous Forest
- #10: Deciduous Forest
- #11: Plantation Forest
- #12: Mangrove
5. Accuracy verification
Table 1 present the accuracy assessment of the HRLULC map including producers (PA), users (UA), and overall accuracy (OA). The confusion matrix was constructed using 2,700 validation points which are sampled by a stratified random sampling method and then conducting visual interpretation independent of the training data set.
Table 1: Confusion Matrix for HRLULC map of Vietnam in 2016 (2016VNM_v20.06)

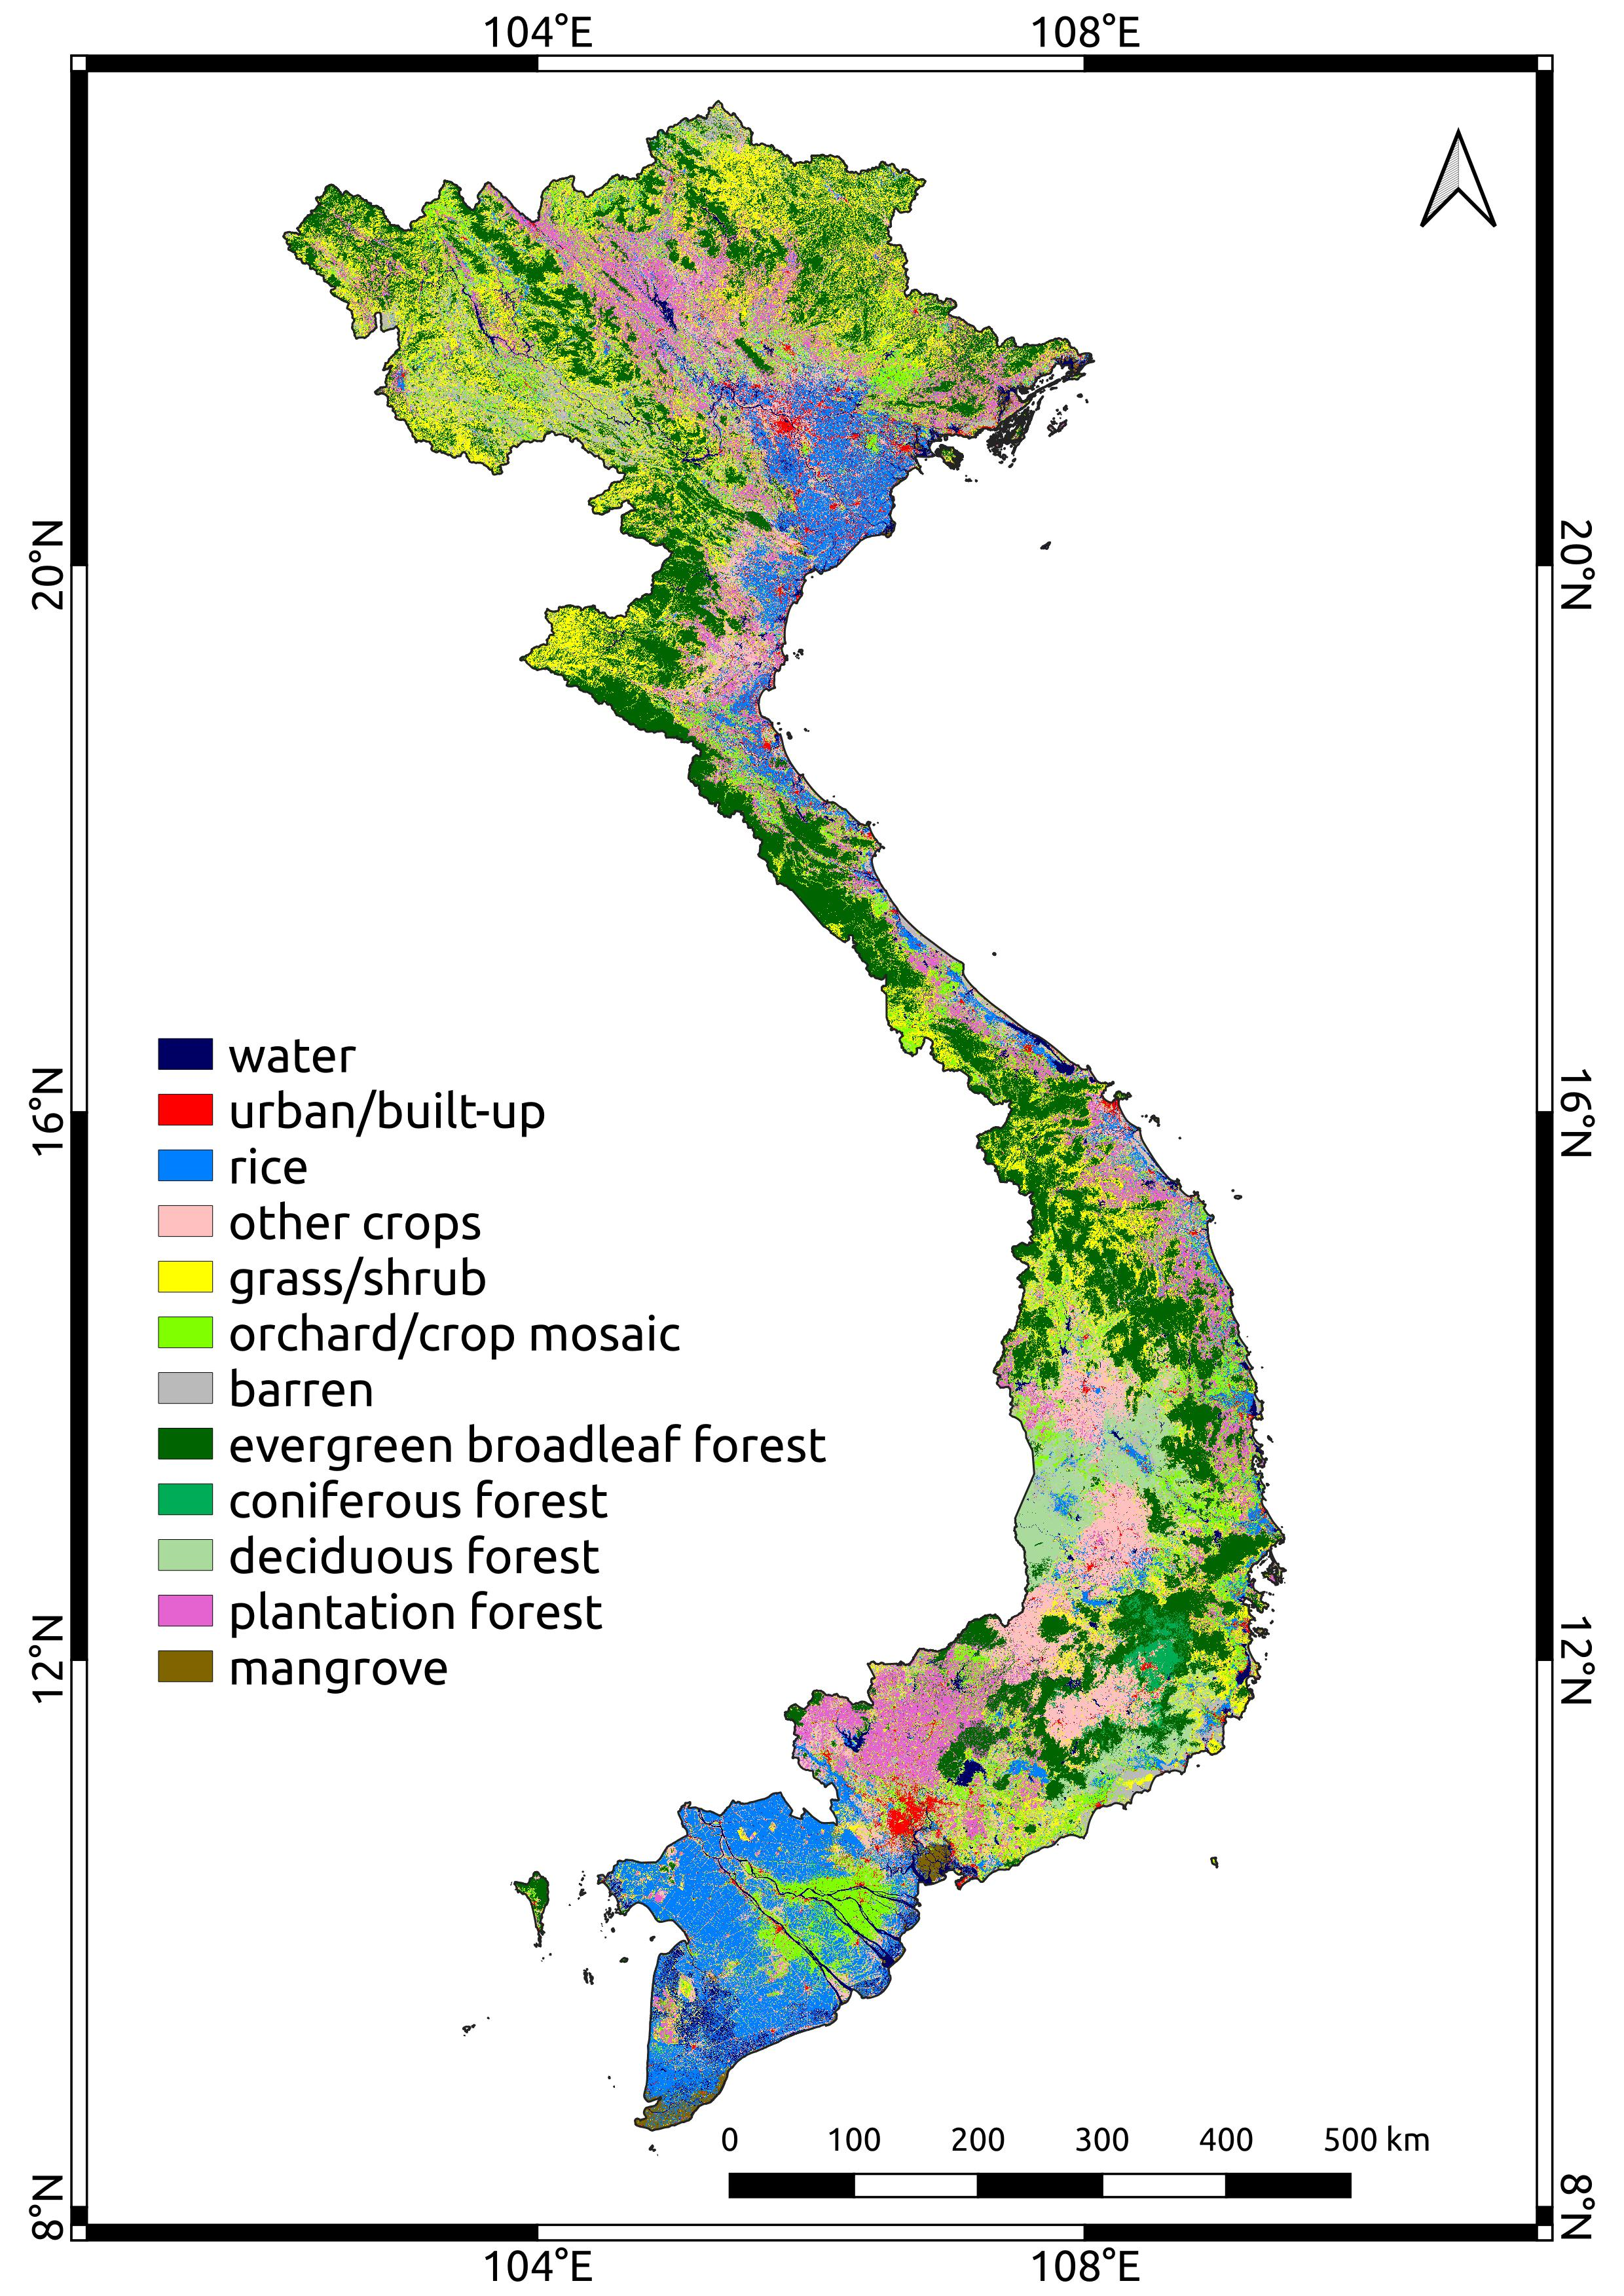
Figure 1: HRLULC map of Vietnam in 2016 (2016VNM_v20.06)
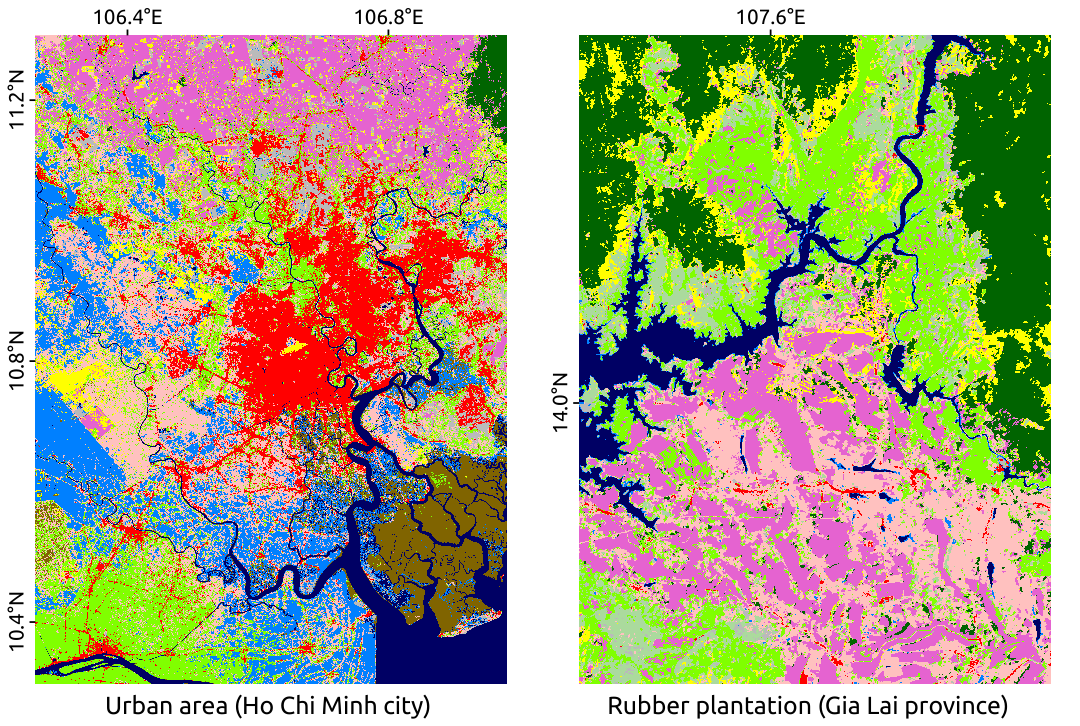
Figure 2: HRLULC map of Vietnam in 2016 in some local areas
6. References
- "A New Method to Derive Precise Land-use and Land-cover Maps Using Multi-temporal Optical Data", Shutaro Hashimoto, Takeo Tadono, Masahiko Onosato, Masahiro Hori and Kei Shiomi (2014), Journal of The Remote Sensing Sociery of Japan, 34 (2), 102-112.
- "Analysis of Land Cover Change in Northern Vietnam Using High Resulution Remote Sensing Data", Hoang, T.T., Nasahara, K.N., Katagi, J. (2018), Advances and Applications in Geospatial Technology and Earth Resources. Springer International Publishing, Cham.
- "JAXA High-Resolution Land Use/Land Cover Map for Central Vietnam in 2007 and 2017", Duong, P., Trung, T., Nasahara, K., Tadono, T. (2018), Remote Sens. 10, 1406.
- “JAXA annual forest cover maps for Vietnam during 2015–2018 Using ALOS-2/PALSAR-2 and auxiliary data”, Truong, V. T., Hoang, T. T., Cao, D. P., Hayashi, M., Tadono, T., & Nasahara, K. N. (2019), Remote Sensing, 11(20).
Acknowledgements
- Multi-temporal PALSAR-2/ScanSAR, Global PALSAR-2 mosaic, AW3D30 data provided by courtesy of JAXA.
- Multi-temporal Landsat-8 OLI images provided by courtesy of the U.S. Geological Survey.
- Multi-temporal Sentinel-1 SAR GRD, Sentinel-2 MSI provided by courtesy of European Union, ESA, Copernicus
- Data archiving and processing services provided by courtesy of Google Earth Engine.
- The Project for Human Resource Development Scholarship by Japanese Grant Aid (JDS)