Dataset
We do not recommend the use of the following data (old version) to our users, as improved versions (the newest version) have been released separately. However, we will continue to provide these data on this page, as we believe that some users may need these data for retrospective or revalidation of researches that have already been conducted.The newest version is here.
High-Resolution Land-Use and Land-Cover Map of the Southern Region of Vietnam
(Released in September 2018 / Version 18.09)
You can switch layers with check boxes.
Download product
User registration is required to download the data. Please click here about download and user registration details.
1. Summary
The rapid development of socio-economic in southern Vietnam has made the land cover system changes dramatically. In order to highlight the land cover change, we created maps for the year 2007 and 2017, making use of satellite datasets such as Sentinel, Landsat, ALOS-AVNIR-2, PALSAR, PALSAR-2 mosaic etc.
2. Data used for creating the map
- Data 1: Sentinel 2 10 m resolution, 183 scenes (2017).
- Data 2: Landsat 8 OLI 30 m resolution, 42 scenes (2017).
- Data 3: Landsat 5 TM 30 m resolution, 93 scenes (2007).
- Data 4: ALOS AVNIR 2 10 m resolution, 84 scenes (2007).
- Data 5: ALOS-2 PALSAR-2 25 m resolution mosaic dataset (2017).
- Data 6: ALOS PALSAR 25 m resolution mosaic dataset (2007).
- Data 7: ALOS Digital surface model (2017).
- Data 8: Vietnam Geographic Information database (2007).
3. Classification algorithm
Bayesian classifier with kernel density estimation (Hashimoto et al., 2014)
4. Data format
- Coordinate system: Latitude and longitude coordinate system with ITRF-94 on GRS-80 ellipsoid.
- Tile unit: 1 degree x 1 degree, (10,581 pixels x 10,581 lines)
- Mesh size: (1 / 10,581) degree × (1 / 10,581) degree (corresponding to approximate 10 m × 10 m)
- File naming convention: For example, LC_N18E106.tif indicates 18 to 19 degrees north latitude and 106 to 107 degrees east longitude.
- Format: GeoTIFF format
- Period of coverage: Year 2007 and 2017 (two different maps)
The value of each pixel is ID number of the category for classification as follows:
- #0: Unclassified
- #1: Water
- #2: Urban and built-up
- #3: Rice paddy
- #4: Crops
- #5: Grassland
- #6: Orchards
- #7: Bare land
- #8: Forest
- #9: Mangrove
- #255: No data
5. Accuracy verification
Tables 1 and 2 present the accuracy of southern Vietnam maps for producers, users and overall accuracy based on a confusion matrix. The overall accuracy of southern Vietnam land cover/land use maps for the year 2007 and 2017 are 82.7 % and 84 % respectively. Figures 1 shows the results of 10-m spatial resolution land cover maps of the southern Vietnam for the year 2007 and 2017 respectively.
| Classified | Producer's accuracy (%) |
|||||||||||
|---|---|---|---|---|---|---|---|---|---|---|---|---|
| 1 | 2 | 3 | 4 | 5 | 6 | 7 | 8 | 9 | TOTAL | |||
| Validation | 1 | 338 | 21 | 18 | 2 | 4 | 0 | 13 | 6 | 14 | 416 | 81.3 |
| 2 | 2 | 205 | 6 | 5 | 0 | 2 | 4 | 1 | 3 | 228 | 90.0 | |
| 3 | 0 | 10 | 390 | 2 | 2 | 3 | 14 | 4 | 22 | 447 | 87.3 | |
| 4 | 0 | 0 | 1 | 39 | 0 | 0 | 0 | 1 | 0 | 41 | 95.2 | |
| 5 | 0 | 0 | 0 | 2 | 45 | 2 | 2 | 2 | 1 | 54 | 83.4 | |
| 6 | 0 | 5 | 4 | 21 | 3 | 65 | 4 | 15 | 15 | 132 | 49.3 | |
| 7 | 2 | 36 | 3 | 3 | 7 | 2 | 97 | 3 | 4 | 157 | 61.8 | |
| 8 | 0 | 7 | 5 | 47 | 26 | 11 | 21 | 640 | 16 | 773 | 82.8 | |
| 9 | 3 | 2 | 0 | 1 | 0 | 1 | 0 | 2 | 269 | 278 | 96.8 | |
| TOTAL | 345 | 286 | 427 | 12 | 87 | 86 | 155 | 6 | 344 | 2,526 | 80.9 | |
| User's accuracy (%) |
98.0 | 71.7 | 91.4 | 32.0 | 51.8 | 75.6 | 62.6 | 95.0 | 78.2 | 72.9 | 82.7% | |
| Classified | Producer's accuracy (%) |
|||||||||||
|---|---|---|---|---|---|---|---|---|---|---|---|---|
| 1 | 2 | 3 | 4 | 5 | 6 | 7 | 8 | 9 | TOTAL | |||
| Validation | 1 | 955 | 8 | 17 | 15 | 2 | 14 | 1 | 3 | 7 | 1,022 | 93.5 |
| 2 | 33 | 2,646 | 11 | 105 | 140 | 63 | 53 | 35 | 1 | 3,087 | 85.8 | |
| 3 | 9 | 36 | 1,646 | 66 | 69 | 68 | 47 | 51 | 4 | 1,996 | 82.5 | |
| 4 | 0 | 12 | 10 | 492 | 17 | 12 | 3 | 14 | 5 | 565 | 87.1 | |
| 5 | 0 | 18 | 9 | 22 | 460 | 28 | 30 | 25 | 4 | 596 | 77.2 | |
| 6 | 0 | 6 | 1 | 8 | 6 | 677 | 1 | 1 | 11 | 711 | 95.3 | |
| 7 | 6 | 105 | 46 | 36 | 135 | 15 | 701 | 27 | 1 | 1,072 | 65.4 | |
| 8 | 3 | 21 | 17 | 219 | 80 | 80 | 44 | 2,582 | 60 | 3,106 | 83.2 | |
| 9 | 9 | 1 | 1 | 4 | 1 | 5 | 0 | 8 | 440 | 469 | 93.9 | |
| TOTAL | 1,015 | 2,853 | 1,758 | 967 | 910 | 962 | 880 | 2,746 | 533 | 12,624 | 84.9 | |
| User's accuracy (%) |
94.1 | 92.8 | 93.7 | 50.9 | 50.6 | 70.4 | 79.7 | 94.1 | 82.6 | 78.8 | 84.0 | |
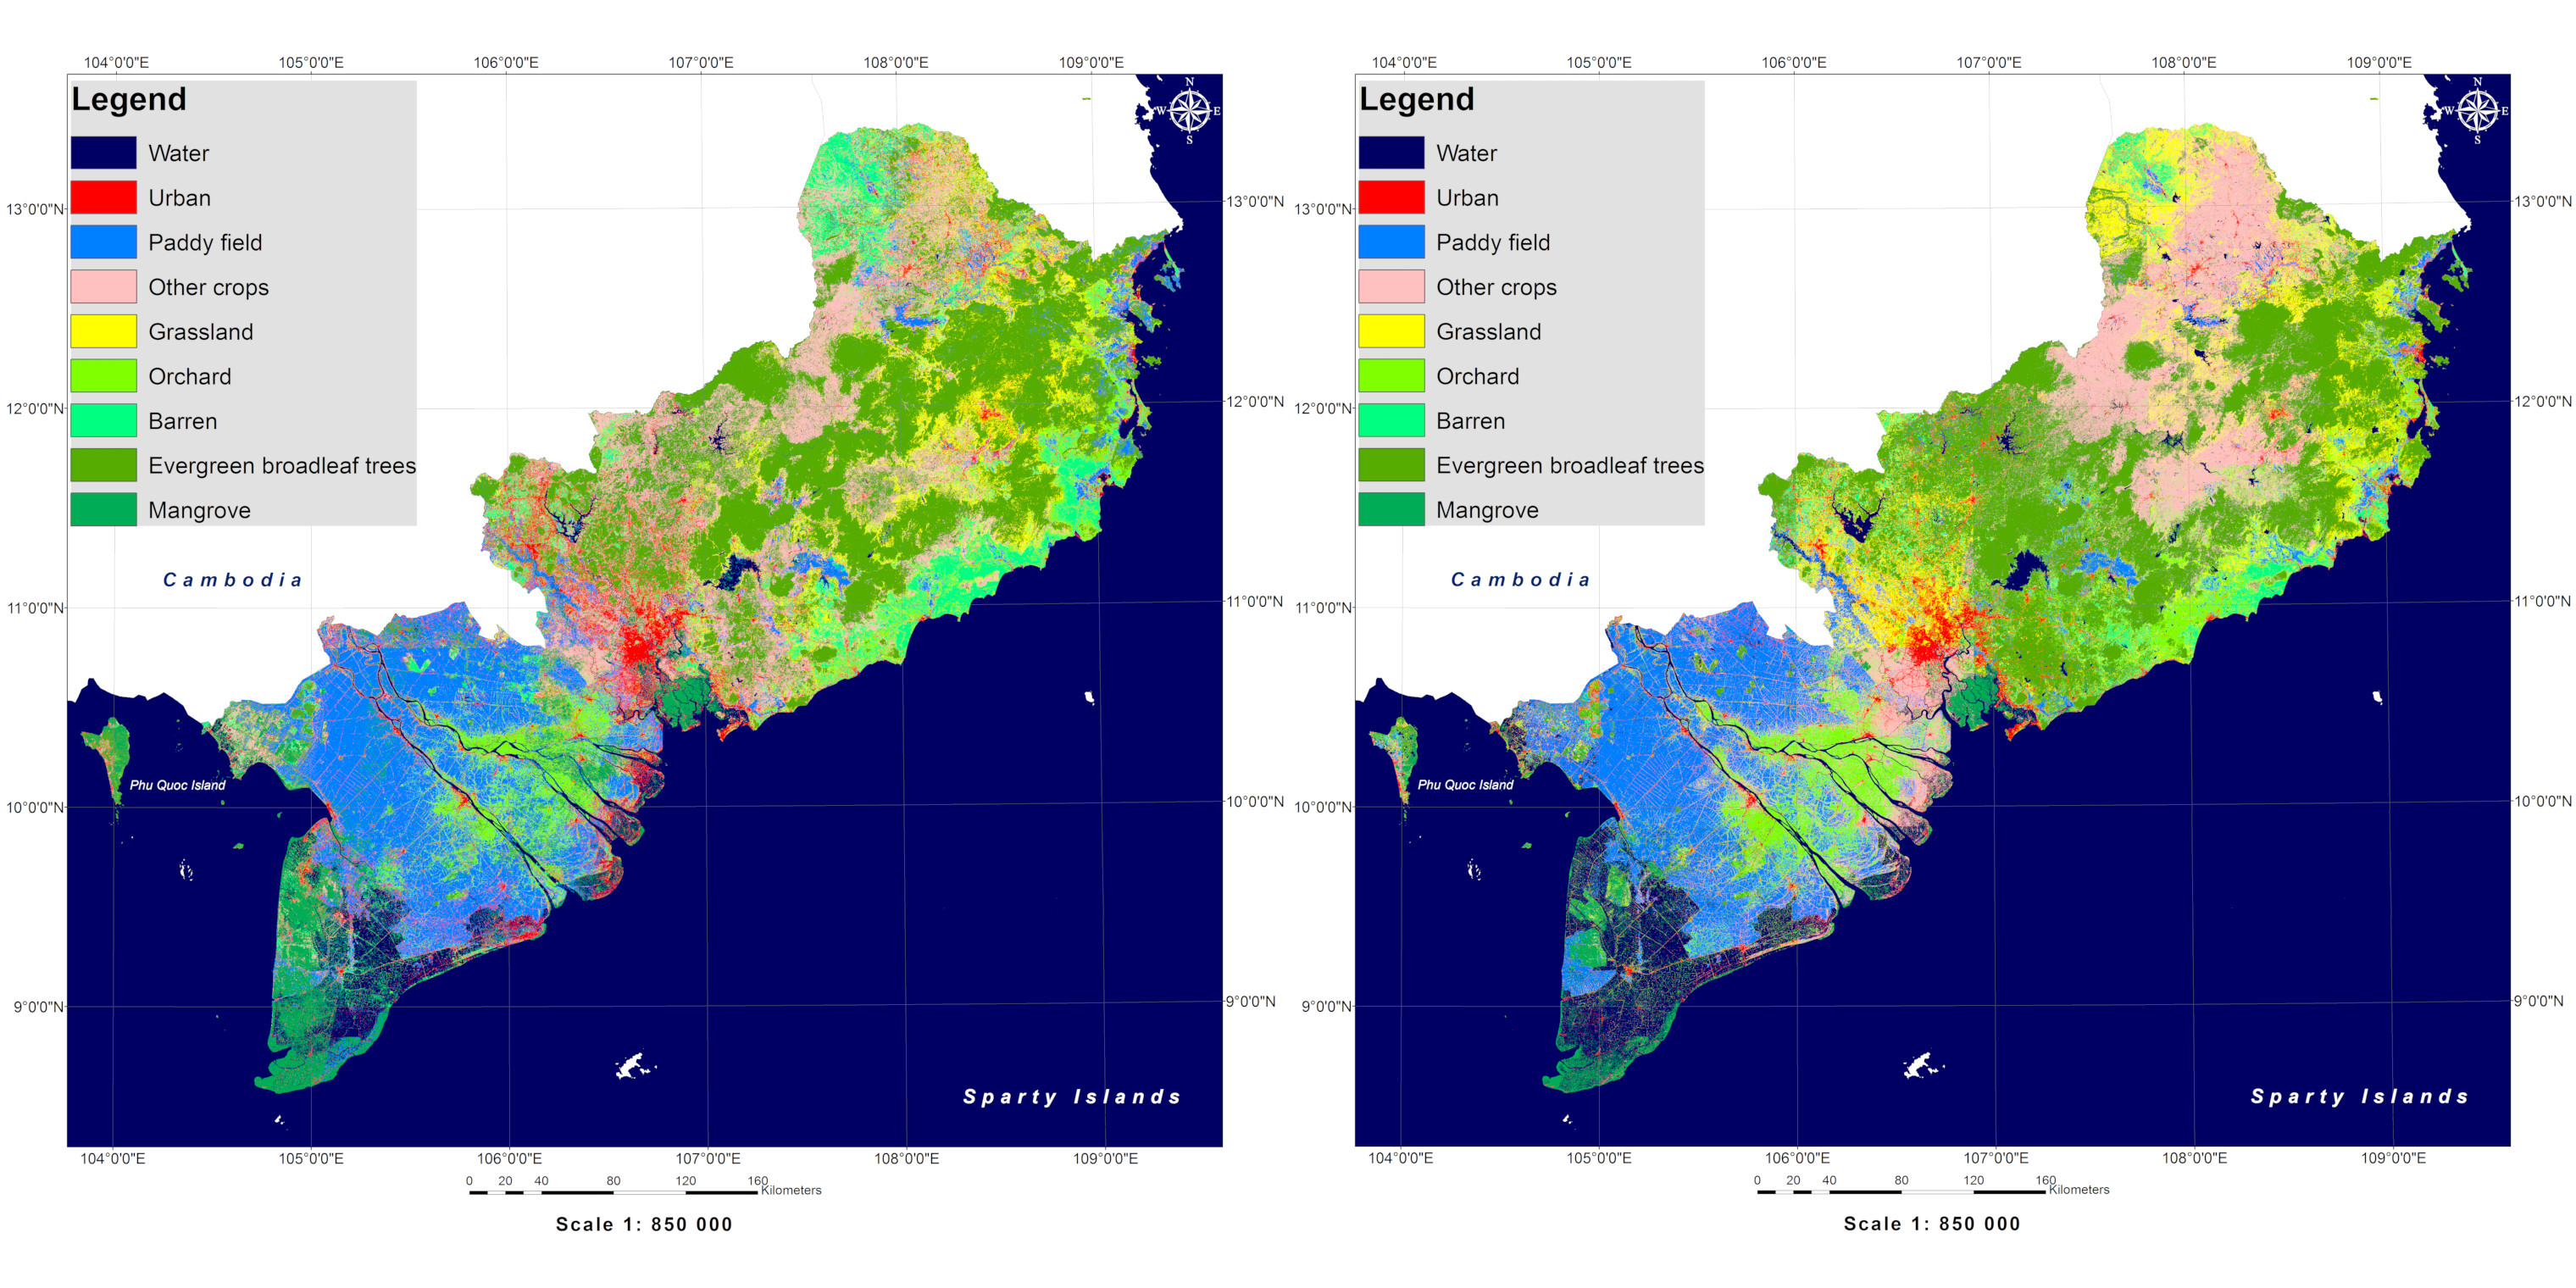
Figure 1: The 2007 land cover map (left) and the 2017 land cover map (right).
6. References
- "A New Method to Derive Precise Land-use and Land-cover Maps Using Multi-temporal Optical Data", Shutaro Hashimoto, Takeo Tadono, Masahiko Onosato, Masahiro Hori and Kei Shiomi (2014) Journal of The Remote Sensing Sociery of Japan, 34 (2), 102-112.
- "Land Cover Change Mapping in Southern Vietnam Using Multi-temporal High resolution Satellite Remote Sensing Data", Ta Hoang Trung, Master’s thesis, University of Tsukuba, 2018.
Acknowledgements
- Sentinel 2, Landsat 8 OLI, Landsat 7 ETM+ and Landsat 5 TM image courtesy of the U.S. Geological Survey.
- ALOS-AVNIR-2, PALSAR and PALSAR Mosaic image courtesy of JAXA (see: https://www.eorc.jaxa.jp/ALOS/en/library/disaster_e.htm for detail)
- The SRTMGL1 data product was retrieved from the online Data Pool, courtesy of the NASA Land Processes Distributed Active Archive Center (LP DAAC), USGS/Earth Resources Observation and Science (EROS) Center, Sioux Falls, South Dakota, https://lpdaac.usgs.gov/products/srtmgl1v003/.