Dataset
We do not recommend the use of the following data (old version) to our users, as improved versions (the newest version) have been released separately. However, we will continue to provide these data on this page, as we believe that some users may need these data for retrospective or revalidation of researches that have already been conducted.The newest version is here.
High-Resolution Land-Use and Land-Cover Map of the Northern Region of Vietnam
(Released in September 2016 / Version 16.09)
Download product
User registration is required to download the data. Please click here about download and user registration details.
1. Summary
2. Data used for creating the map
- Data 1: Landsat-8 OLI 30 m resolution, 199 scenes (2015)
- Data 2: Landsat-5 TM 30 m resolution, 140 scenes (2007)
- Data 3: ASTER-VA 15 m resolution, 68 scenes (2015)
- Data 4: ASTER-VA 15 m resolution, 55 scenes (2007)
- Data 5: ALOS-2 PALSAR-2 25 m resolution mosaic dataset (2015)
- Data 6: ALOS PALSAR 25 m resolution mosaic dataset (2007)
- Data 7: SRTM-1 30 m resolution and the map of its slope.
- Data 8: Suomi NPP nightlight 500 m resolution (2015)
- Data 9: The map of distances from roads (Roadmap ©OpenStreetMap contributors)
- Data 10: Sea mask of PRISM DSM
3. Classification algorithm
Bayesian classifier with kernel density estimation (Hashimoto et al., 2014; Hoang Thanh Tung 2016)
4. Data format
- Coordinate system: Latitude and longitude coordinate system with ITRF-94 on GRS-80 ellipsoid.
- Tile unit: 1 degree x 1 degree, (7,054 pixels x 7,054 lines)
- Mesh size: (1 / 7,054) degree × (1 / 7,054) degree (corresponding to approximate 15 m × 15 m)
- File naming convention: For example, LC_N18E106.tif indicates 18 to 19 degrees north latitude and 106 to 107 degrees east longitude.
- Format: GeoTIFF format
- Period of coverage: Year 2007 and 2015 (two different maps)
The value of each pixel is the ID number of the category for classification as follows:
- #0: Unclassified
- #1: Water
- #2: Urban and built-up
- #3: Rice paddy
- #4: Crops
- #5: Grassland
- #6: Orchards
- #7: Bare land
- #8: Forest
- #9: Mangrove
- #255: No data
5. Accuracy verification
| Classified | Producer's accuracy (%) |
|||||||||||
|---|---|---|---|---|---|---|---|---|---|---|---|---|
| 1 | 2 | 3 | 4 | 5 | 6 | 7 | 8 | 9 | TOTAL | |||
| Validation | 1 | 1,096 | 13 | 31 | 12 | 1 | 11 | 3 | 2 | 2 | 1,171 | 93.6 |
| 2 | 3 | 2,429 | 23 | 66 | 0 | 25 | 5 | 0 | 2 | 2,553 | 95.1 | |
| 3 | 22 | 49 | 4,066 | 283 | 9 | 34 | 99 | 2 | 6 | 4,570 | 89.0 | |
| 4 | 6 | 55 | 98 | 1,712 | 48 | 108 | 11 | 28 | 0 | 2,066 | 82.9 | |
| 5 | 0 | 1 | 9 | 29 | 1,246 | 16 | 75 | 146 | 5 | 1,527 | 81.6 | |
| 6 | 0 | 9 | 8 | 42 | 6 | 1,650 | 4 | 32 | 14 | 1,765 | 93.5 | |
| 7 | 6 | 40 | 30 | 29 | 106 | 19 | 1,738 | 24 | 13 | 2,005 | 86.7 | |
| 8 | 1 | 4 | 6 | 65 | 275 | 50 | 35 | 3,603 | 25 | 4,064 | 88.7 | |
| 9 | 2 | 1 | 0 | 0 | 2 | 2 | 1 | 1 | 300 | 309 | 97.1 | |
| TOTAL | 1,136 | 2,601 | 4,271 | 2,238 | 1,693 | 1,915 | 1,971 | 3,838 | 367 | 20,030 | --- | |
| User's accuracy (%) |
96.5 | 93.4 | 95.2 | 76.5 | 73.6 | 86.2 | 88.2 | 93.9 | 81.7 | --- | Overall accuracy: 89.1% |
|
| Classified | Producer's accuracy (%) |
|||||||||||
|---|---|---|---|---|---|---|---|---|---|---|---|---|
| 1 | 2 | 3 | 4 | 5 | 6 | 7 | 8 | 9 | TOTAL | |||
| Validation | 1 | 1,029 | 17 | 60 | 18 | 9 | 13 | 13 | 2 | 10 | 1,171 | 87.9 |
| 2 | 6 | 2,410 | 18 | 35 | 2 | 72 | 5 | 0 | 5 | 2,553 | 94.4 | |
| 3 | 48 | 69 | 3,746 | 404 | 16 | 137 | 128 | 5 | 17 | 4,570 | 82.0 | |
| 4 | 5 | 70 | 237 | 1,336 | 106 | 215 | 65 | 31 | 1 | 2,066 | 64.7 | |
| 5 | 0 | 3 | 20 | 30 | 1,082 | 19 | 163 | 206 | 4 | 1,527 | 70.9 | |
| 6 | 0 | 20 | 24 | 41 | 44 | 1,569 | 34 | 9 | 24 | 1,765 | 88.9 | |
| 7 | 6 | 43 | 26 | 73 | 296 | 31 | 1,331 | 193 | 6 | 2,005 | 66.4 | |
| 8 | 0 | 7 | 10 | 42 | 351 | 69 | 81 | 3,490 | 14 | 4,064 | 85.9 | |
| 9 | 16 | 1 | 2 | 1 | 1 | 1 | 0 | 0 | 287 | 309 | 92.9 | |
| TOTAL | 1,110 | 2,640 | 4,143 | 1,980 | 1,907 | 2,126 | 1,820 | 3,936 | 368 | 20,030 | --- | |
| User's accuracy (%) |
92.7 | 91.3 | 90.4 | 67.5 | 56.7 | 73.8 | 73.1 | 88.7 | 78 | --- | Overall accuracy: 81.3% |
|
Figures 1 and 2 show the results of the land use map in the northern part of Vietnam (2015 and 2007, respectively).
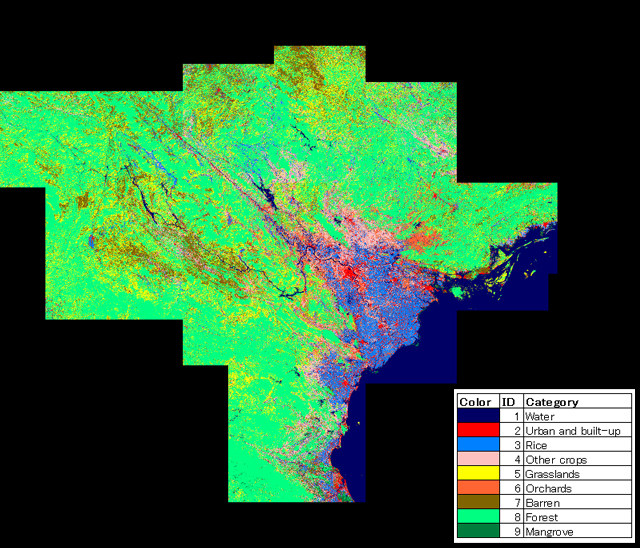
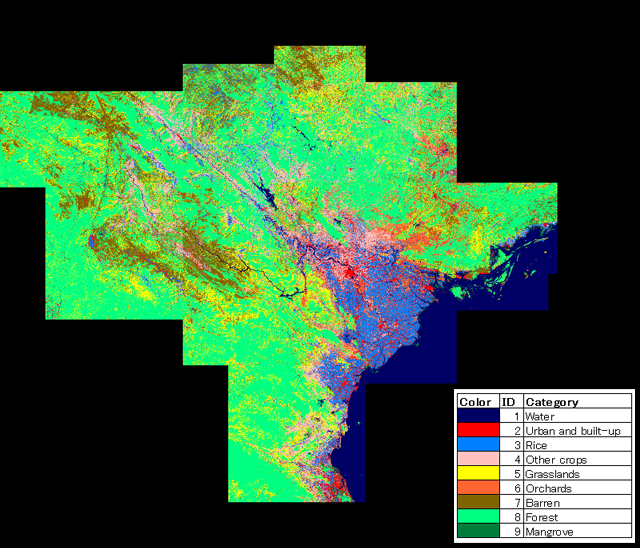
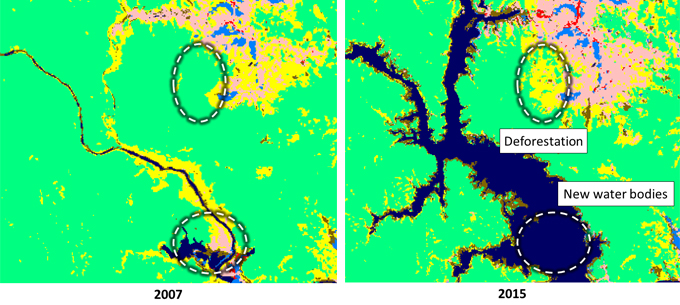
Figure 3 shows an example of the land cover change that is confirmed as a result of comparing the two HRLULC maps of 2007 and 2015.
6. References
- "A New Method to Derive Precise Land-use and Land-cover Maps Using Multi-temporal Optical Data", Shutaro Hashimoto, Takeo Tadono, Masahiko Onosato, Masahiro Hori and Kei Shiomi (2014) Journal of The Remote Sensing Sociery of Japan, 34 (2), 102-112.
- "Analysis of Land Cover Change in Northern Vietnam Using High Resolution Remote Sensing Data", Hoang Thanh Tung, Master's thesis, University of Tsukuba, 2016.
Acknowledgements
- Landsat 8 OLI and Landsat 5 TM image courtesy of the U.S. Geological Survey.
- ASTER-VA image courtesy NASA/METI/AIST/Japan Spacesystems, and U.S./Japan ASTER Science Team (see: https://www.eorc.jaxa.jp/ALOS/en/library/disaster_e.htm for detail)
- The SRTMGL1 data product was retrieved from the online Data Pool, courtesy of the NASA Land Processes Distributed Active Archive Center (LP DAAC), USGS/Earth Resources Observation and Science (EROS) Center, Sioux Falls, South Dakota, https://lpdaac.usgs.gov/products/srtmgl1v003/.
- Suomi NPP VIIRS Daily Mosaic Image and Data processing by NOAA's National Geophysical Data Center.
- OpenStreetMap © OpenStreetMap contributors