Dataset
High-Resolution Land-Use and Land-Cover Map of Southeast Asia in 2023
(Released in September 2025 / Version 25.09)
Download product
User registration is required to download the data. Please click here about download and user registration details.
1. Summary
The Japan Aerospace Exploration Agency (JAXA) Earth Observation Research Center (EORC) creates high-resolution land-use and land-cover (HRLULC) maps at the regional and national levels using Earth observation satellite data. The HRLULC maps serve as the basis for ecosystem evaluation (growth and habitat of animals and plants), disaster countermeasures, resource management, and so on.
This product shows HRLULC of Southeast Asia (SEA), version 25.09, for 2023, called 2023SEA_v25.09 (*1). We used satellite data from the Sentinel-2/MSI (optical sensor) and the ALOS-2/PALSAR-2 (synthetic aperture radar PALSAR-2).
The classification scheme was structured into 15 categories, designed to reflect the prevailing agricultural and forestry practices in the region, informed by expert consultations. In particular, new categories such as Single-crop Paddy Field, Multi-crop Paddy Field, Rubber Tree Plantation, and Oil Palm Tree Plantation were introduced to enable a more precise representation of land-use characteristics specific to Southeast Asia. Evaluation was conducted using independently collected test points, which generated a confusion matrix. As a result, 2023SEA_v25.09 achieved an overall accuracy of 94.59 [%] across 15 categories.
(*1): The abbreviation "2023SEA_v25.09" is defined by the following format.
Format: YYYYRRR_vyy.mm
- YYYY: the year of observation data
- RRR: the country or region, represented by a three-letter code conforming to ISO 3166-1 alpha-3 for countries
- yy: the last two digits of the release year
- mm: the two-digit of the release month
2. Data used for creating the map
- Sentinel-2/MSI Level-2A (L2A) surface reflectance data
- ALOS-2/PALSAR-2 (FBD, WBD)
- ALOS PRISM Digital Surface Model (AW3D)
- Raster map of slope obtained from AW3D
- Latitude and longitude
- Reference data independently collected and interpreted
3. Classification method
3.1 Preprocessing
- For Sentinel-2/MSI, the data were divided into six periods corresponding to two-month intervals (January–February, March–April, May–June, July–August, September–October, November–December).
- After applying a cloud mask, a median composite was generated by assigning a weight of 5 to the target two-month period of the current year, and a weight of 1 to the two months before and after that period as well as to the corresponding two-month period in the previous two years.
- The following feature spaces were constructed:
Sentinel-2/MSI time-series: Bands B2, B3, B4, B5, B6, B7, B8, B8a, B11 and B12, plus indices NDVI, GRVI, NDWI1, NDWI2, and GSI.
ALOS-2/PALSAR-2 FBD non-time-series: HH polarization intensity, HV polarization intensity, local incidence angle.
ALOS-2/PALSAR-2 WBD time-series: HH polarization intensity, HV polarization intensity, local incidence angle.
Auxiliary data non-time-series: AW3D DSM, Slope, latitude, and longitude. - Standardization using mean and standard deviation was applied to each feature.
3.2 Classification
- Classification was performed using the features described in Section 3.1 with an enhanced version of SACLASS2 (*2).
(*2): CNN and NN algorithms specialized for pattern recognition in multispectral, time-series feature spaces.
3.3 Postprocessing
- Applying a Gaussian filter.
- Applying a sea mask.
4. Data format
| Target period | 2023 |
|---|---|
| Coordinate system | Geographic latitude and longitude coordinates (WGS84) |
| Tile unit | Tile unit: 1 degree x 1 degree, (12,000 pixels x 12,000 pixels) |
| Mesh size | 1 / 12,000 degree × 1 / 12,000 degree (corresponding to approximately 10 m × 10 m) |
| Directory structure |
2023SEA_v25.09 | --
| --
| --
| --
| --
|
| File naming convention |
Format: LC_XxxYyyy.tif
For example, LC_N13E100.tif covers the area from 13°N to 14°N, and 100°E to 101°E. |
| File extension | GeoTIFF |
| Number of files | 619 tiles |
The value of each pixel is the ID number of the classification category as shown below.
Table 1 shows the definitions.
- #1: Water Bodies
- #2: Built-up
- #3: Solar Panel
- #4: Cropland
- #5: Single-crop Paddy Field
- #6: Multi-crop Paddy Field
- #7: Herbaceous Wetland
- #8: Grassland
- #9: Deciduous Broad-leaved Forest (DBF)
- #10: Evergreen Broad-leaved Forest (EBF)
- #11: Evergreen Needle-leaved Forest (ENF)
- #12: Rubber Tree Plantation
- #13: Oil Palm Tree Plantation
- #14: Mangrove Forest
- #15: Bare
Table 1: List of classification categories and color codes, definitions

5. Evaluation
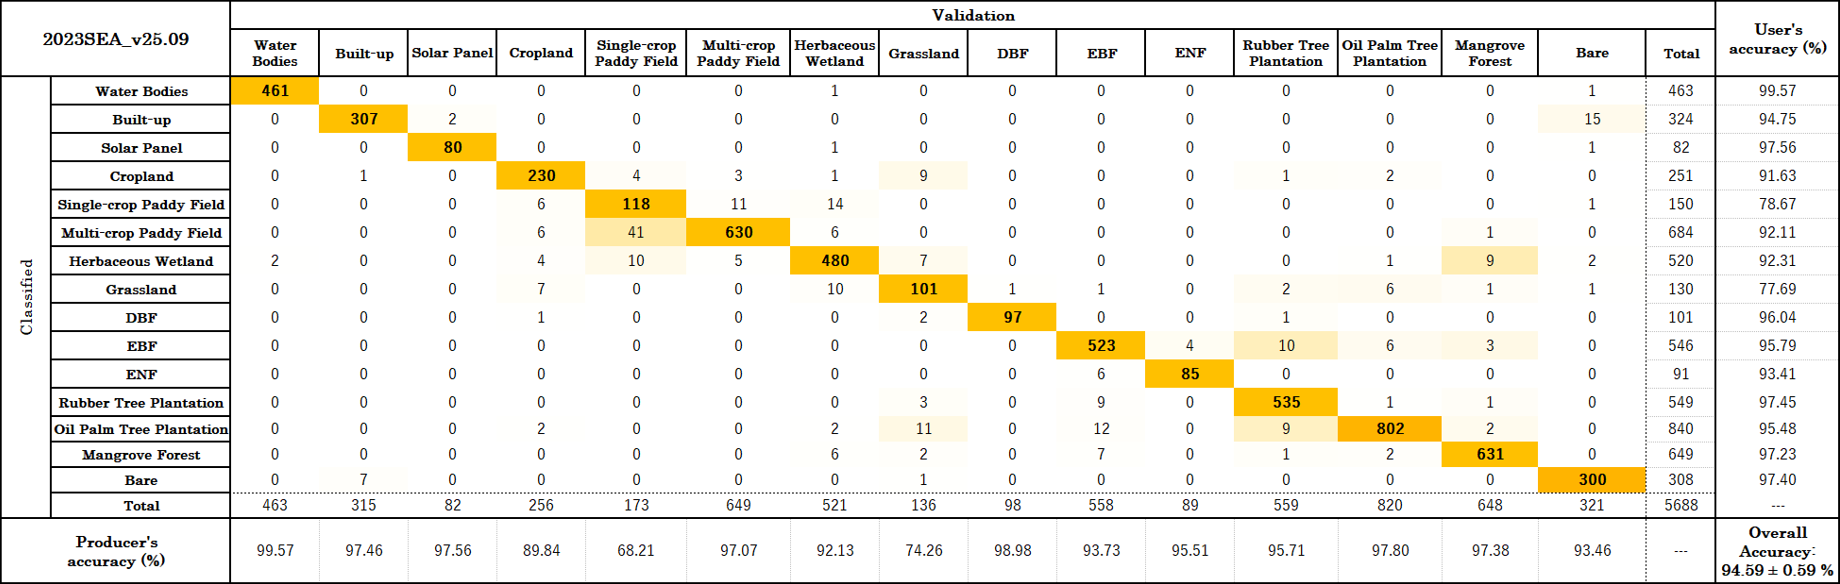
Using the test data independently obtained from the training data, we performed an evaluation using confusion matrices of 15 categories. In 2023SEA_v25.09, the overall accuracy is 94.59 [%] with a kappa coefficient of 0.94 based on 5,688 test data.
Details of the confusion matrix are shown in Tables 2.
Please note that this evaluation is preliminary and not a strict random sampling from the population.
Table 2: Confusion matrix (2023SEA_v25.09)
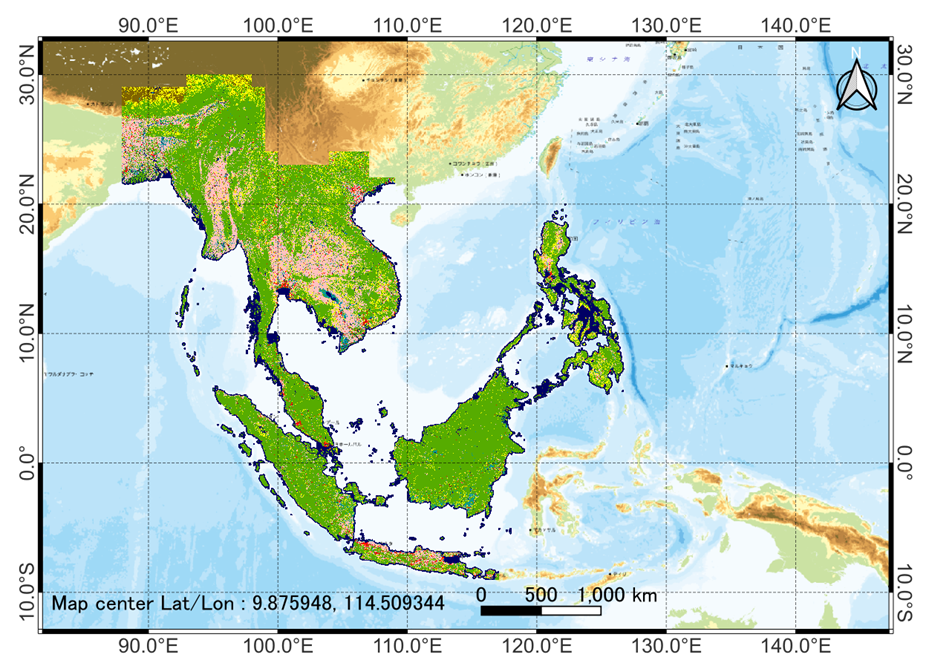
Figures 3 show the overall area maps for 2023SEA_v25.09.
Figures 4 and 5 show comparisons with other classification maps.
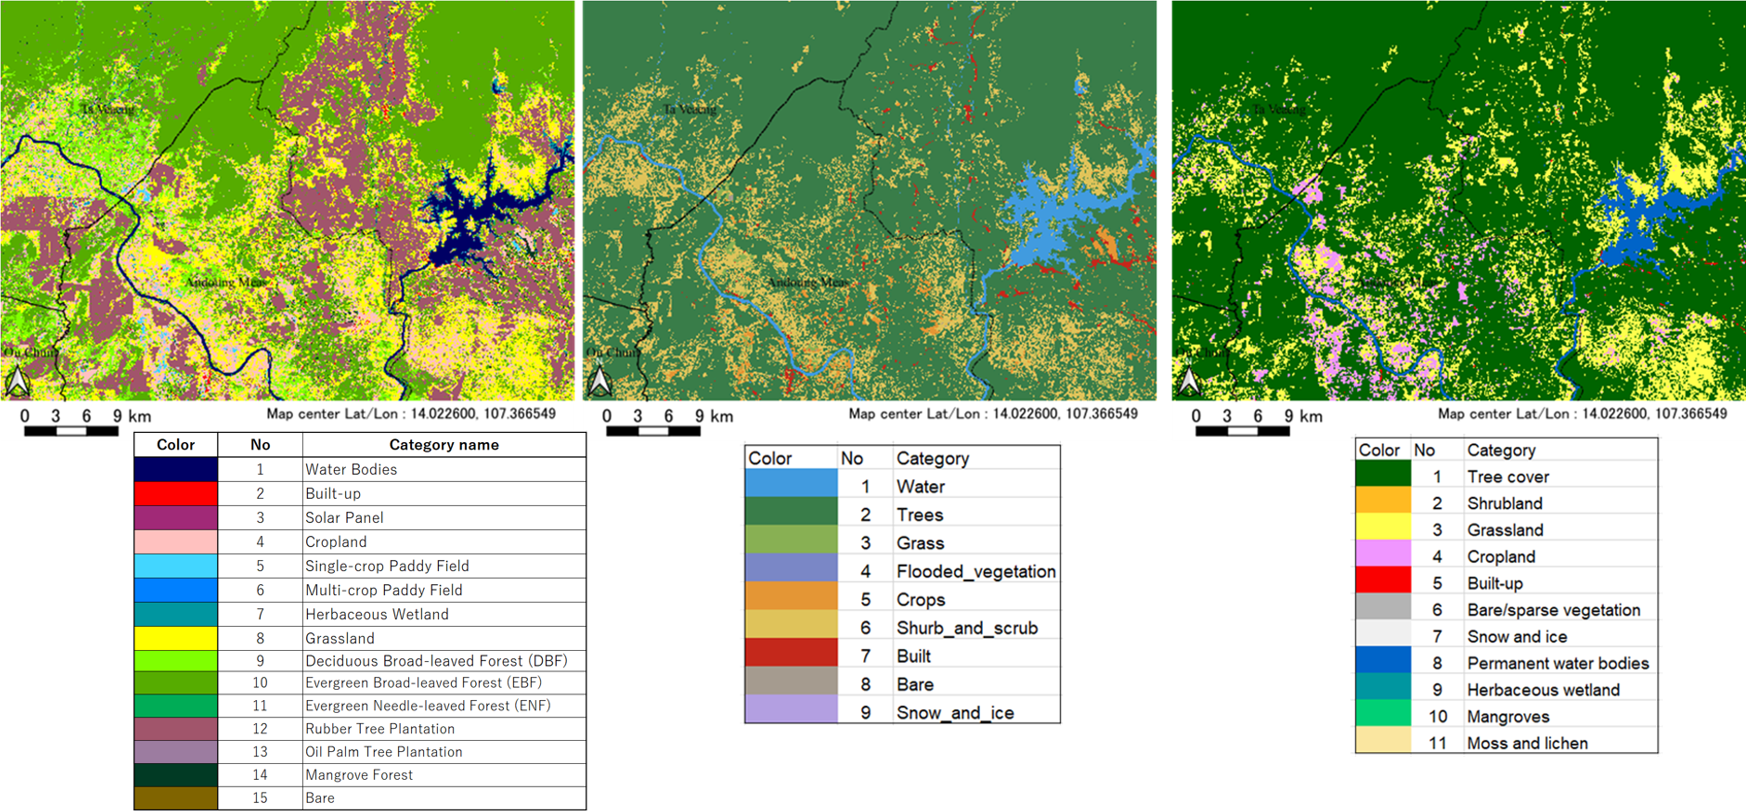
Near the Vietnam-Cambodia border (Lat/Lon: 14.0226, 107.366549), color codes as shown in the figure.
2023SEA_v25.09 distinguishes forest categories and clearly separates Rubber Tree Plantation, shown in reddish purple in the image.
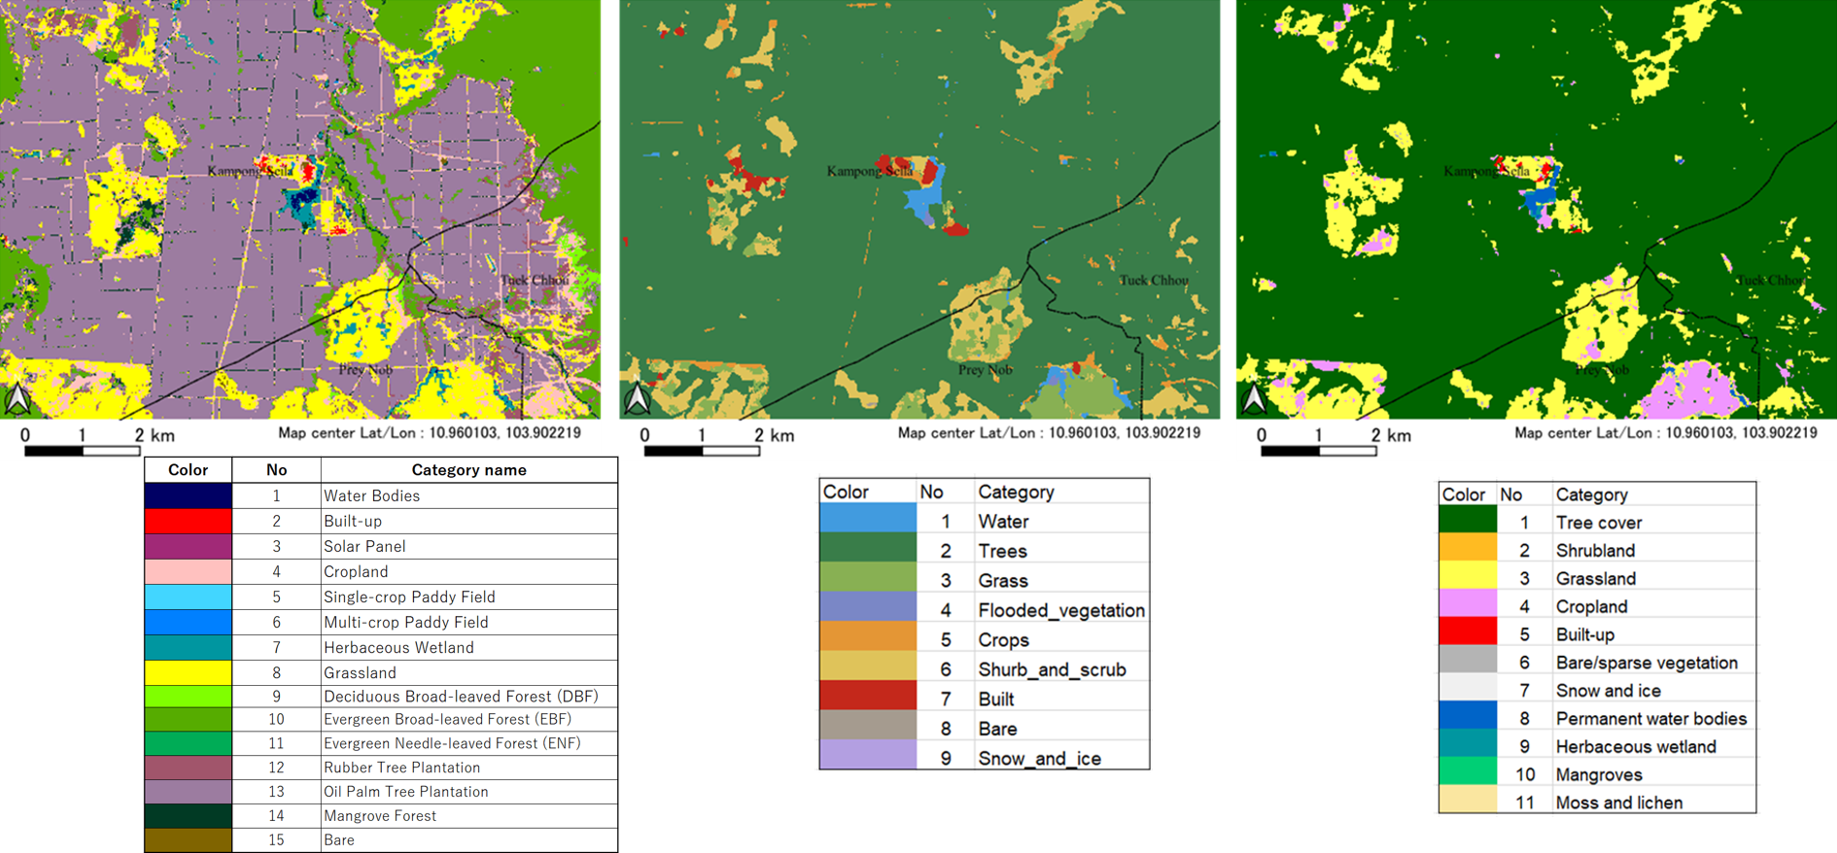
2023SEA_v25.09 clearly distinguishes the Oil Palm Tree Plantation shown in light purple in the figure and allows the boundaries between plantations to be discernible.
6. References
- S. Hirayama, T. Tadono, Y. Mizukami, M. Ohki, K. Nishida Nasahara, S. Ito, N. Hirade, K. Imamura, R. Satake, F. Ohgushi (2023): Preliminary study for developing the FY2022 high-resolution land-use and land-cover map of Japan, Proceedings of 75th autumn conference of the Japan Remote Sensing Society of Japan, pp.25-28. (Oral presentation).
- S. Hirayama, T. Tadono, M. Ohki, Y. Mizukami, K. Nishida Nasahara, K. Imamura, N. Hirade, F. Ohgushi, M. Dotsu and T. Yamanokuchi (2022): Generation of High-Resolution Land Use and Land Cover Maps in JAPAN Version 21.11, Journal of The Remote Sensing Society of Japan Vol. 42 No. 3 pp. 199-216.
- N. Hirade, R. Satake, K. Imamura, F. Ohgushi, S. Hirayama, T. Tadono, Y. Mizukami, S. Ito, K. Nishida Nasahara (2025): Development of JAXA High-Resolution Land Use and Land Cover Classification Maps of Japan for 2020, 2022, and 2024 with Consideration of Time-Series Consistency, Proceedings of 78th spring conference of the Japan Remote Sensing Society of Japan, pp. 15-18 (Oral presentation).
- Van Thinh Truong, Sota Hirayama, Doung Cao Phan, Thanh Tung Hoang, Takeo Tadono, Kenlo Nishida Nasahara (2024): JAXA’s new high-resolution land use land cover map for Vietnam using a time-feature convolutional neural network, Sci Rep 14, 3926 (2024).
- Brown, C.F. et al. Dynamic World, Near real-time global 10 m land use land cover mapping. Sci Data 9, 251 (2022).
- Zanaga et al., ESA WorldCover 10 m 2021 v200, Zenodo (2022).