Dataset
High-Resolution Land-Use and Land-Cover Map of Japan [2024・2022・2020]
(Released in April 2025 / Version 25.04)
Download product
User registration is required to download the data. Please click here about download and user registration details.
1. Summary
The Japan Aerospace Exploration Agency (JAXA) Earth Observation Research Center (EORC) creates high-resolution land-use and land-cover (HRLULC) maps at the regional and national levels using Earth observation satellite data. The HRLULC maps serve as the basis for regional and national land conservation, such as ecosystem evaluation (growth and habitat of animals and plants, various ecosystem services), resource management (agriculture, forestry, fisheries and landscapes), disaster countermeasures (floods, sediment disasters), and so on.
These products are time-series HRLULC maps of Japan, version 25.04, for three periods: 2020, 2022, and 2024. Each product is referred to as 2020JPN_v25.04, 2022JPN_v25.04, 2024JPN_v25.04 (*1). We used data from the Sentinel-2/MSI in Europe, the Landsat-8/OLI in the United States (both are optical sensors), and the ALOS-2/PALSAR-2 in Japan (synthetic aperture radar PALSAR-2). There are 15 categories, including a new one, “Rock reef and Tidal flat”, in response to rising interest and demand for conserving shallow-water region ecosystems. Moreover, to ensure time-series consistency across the three periods, training data for 2020 and 2024 were prepared and used to fine-tune the classification model originally developed for 2022JPN_v23.12. As a result, confusion matrices derived using independently obtained test data show overall accuracies of 94.49 [%] for 2020JPN_v25.04, 95.53 [%] for 2022JPN_v25.04, and 92.99 [%] for 2024JPN_v25.04.
In the future, we plan to make further improvements using the ALOS-4, which is now in operation, such as enhancing time-series data and making categories more detailed.
(*1): The abbreviation "2020JPN_v25.04" is defined by the following format.
Format: YYYYRRR_vyy.mm
- YYYY: the year of the observation data
- RRR: the country or region, represented by a three-letter code conforming to ISO 3166-1 alpha-3 for countries
- yy: the last two digits of the release year
- mm: the two-digit release month
For the 2020JPN_v25.04, 2022JPN_v25.04, and 2024JPN_v25.04 products, compared to previous versions, the following major updates have been made.
- All training data and test data were visually inspected and sorted.
- The classification categories have been unified to 15.
- To ensure time-series consistency, the deep learning model created for 2022JPN_v23.12 was fine-tuned to make year-specific models.
As a result, it is now possible to assess land-use and land-cover changes across all of Japan over three periods at two-year intervals.
2. Data used for creating the map
- Sentinel-2/MSI Level-2A (L2A) surface reflectance data
- Landsat-8/OLI Collection2 Tier1 surface reflectance data (for some remote island areas where Sentinel-2 observations are unavailable)
- ALOS-2/PALSAR-2 (HBQ , UBS)
- Reference data
- ALOS PRISM Digital Surface Model (AW3D)
- Raster map of slope obtained from Data 5
- Fude polygon by the Ministry of Agriculture, Forestry and Fisheries (*2)
- Road network vector data from OpenStreetMap © OpenStreetMap contributors
- Latitude and longitude
(*2): Created by processing Fude polygon data (released in FY2022) from the Ministry of Agriculture, Forestry and Fisheries.
3. Classification algorithm
The classification methods used for 2020JPN_v25.04 and 2024JPN_v25.04 are detailed below. For 2022JPN_v25.04, the “Rock reef and Tidal flat” category was added to the classification results of 2022JPN_v23.12, and a post-processing step was applied.
3.1 Preprocessing
- For Sentinel-2/MSI and Landsat-8/OLI, the data for each year were divided into six segments corresponding to two-month intervals (January–February, March–April, May–June, July–August, September–October, November–December).
- After applying a cloud mask, a median composite was generated by assigning weights of 3 to the current year’s two-month period, 1 to the corresponding two-month period of the previous year, and 1 to the month before and after the current two-month period.
- The following feature spaces were constructed:
Sentinel-2/MSI time-series: Bands B2, B3, B4, B5, B6, B7, B8, B8a, B11 and B12, plus indices NDVI, GRVI, NDWI1, NDWI2, NDSI, and GSI.
Landsat-8/OLI time-series: Bands B2, B3, B4, B5, B6 and B7, plus indices NDVI, GRVI, NDWI1, NDWI2, NDSI, GSI.
ALOS-2/PALSAR-2 non-time-series: HBQ, UBS, and various physical parameters calculated from them.
Auxiliary data non-time-series: AW3D DSM, Slope, Fude polygon, OSM, latitude/longitude. - Standardization using mean and standard deviation was applied to each feature.
3.2 Classification
- Classification was performed using the features described in Section 3.1 with an enhanced version of SACLASS 2 (*3).
- To ensure time-series consistency among the years 2020, 2022, and 2024, the deep learning model created for 2022JPN_v23.12 was fine-tuned with training data for 2020 and 2024. This produced specialized deep learning models for each year, which were then used for prediction.
(*3): CNN and NN algorithms specialized for pattern recognition in multispectral, time-series feature spaces.
3.3 Postprocessing
- Applying ensemble learning.
- Applying a Gaussian filter.
- For all categories except those prone to change (cropland, paddy fields, bare land, and agricultural greenhouses), we applied the Squeeze theorem. (*4)
- Rock reef and Tidal flat in inland areas (AW3D30m elevation value > 1 [m]) were converted to bare (not included in the accuracy assessment).
- Manual visual inspection was used to correct any outliers (these corrections were not included in the evaluation).
(*4): This process changes a pixel’s category value in 2022 to match the value if it is the same in both 2020 and 2024.
4. Data format
| Period of coverage | In the years 2020, 2022, and 2024 |
|---|---|
| Coordinate system | Geographic latitude and longitude coordinates (WGS84) |
| Tile unit | Tile unit: 1 degree x 1 degree, (12,000 pixels x 12,000 lines) |
| Mesh size | (1 / 12,000 degree × (1 / 12,000) degree (corresponding to approximately 10 m × 10 m) |
| Directory and file naming convention |
2020JPN_v25.04 |--
(In the above case, the product created for the Japan area in the year 2020, released in April 2025, refers to a range of 45 to 46 degrees north latitude and 142 to 143 degrees east longitude.)
|
| Format | GeoTIFF format |
| Number of files | 131 x 3 period |
The value of each pixel is the ID number of the category for classification as follows:
- #1: Water bodies
- #2: Built-up
- #3: Paddy field
- #4: Cropland
- #5: Grassland
- #6: Deciduous broad-leaved forest (DBF)
- #7: Deciduous needle-leaved forest (DNF)
- #8: Evergreen broad-leaved forest (EBF)
- #9: Evergreen needle-leaved forest (ENF)
- #10: Bare
- #11: Bamboo forest
- #12: Solar panel
- #13: Wetland
- #14: Greenhouse
- #15: Rock reef and Tidal flat
5. Evaluation
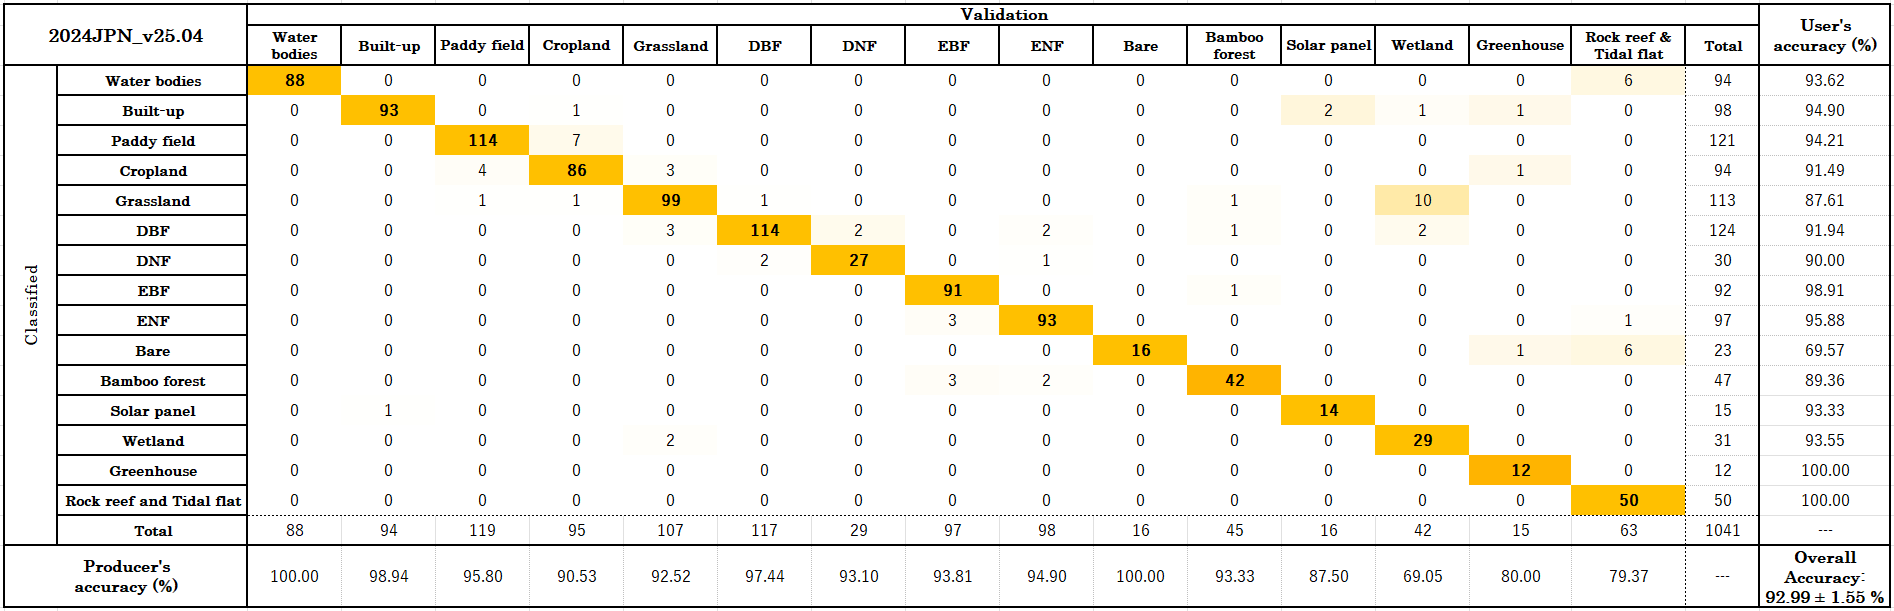
Using the test data independently obtained from the training data, we performed an evaluation using confusion matrices of 15 categories. The results of each confusion matrix are shown below.
- In 2020JPN_v25.04, the overall accuracy is 94.49 [%] with a kappa coefficient of 0.940 based on 2,016 test data.
- In 2022JPN_v25.04, the overall accuracy is 94.53 [%] with a kappa coefficient of 0.952 (*5) based on 2,438 test data.
- In 2024JPN_v25.04, the overall accuracy is 92.99 [%] with a kappa coefficient of 0.923, based on 1,041 test data.
(*5): Information of 2022JPN_v23.12 is given for results of 2022JPN_v23.12.
Details of the confusion matrices are shown in Tables 1, 2, and 3.
Please note that this evaluation is preliminary and not a strict random sampling from the population.
Table 1: Confusion Matrix (2020JPN_v25.04)
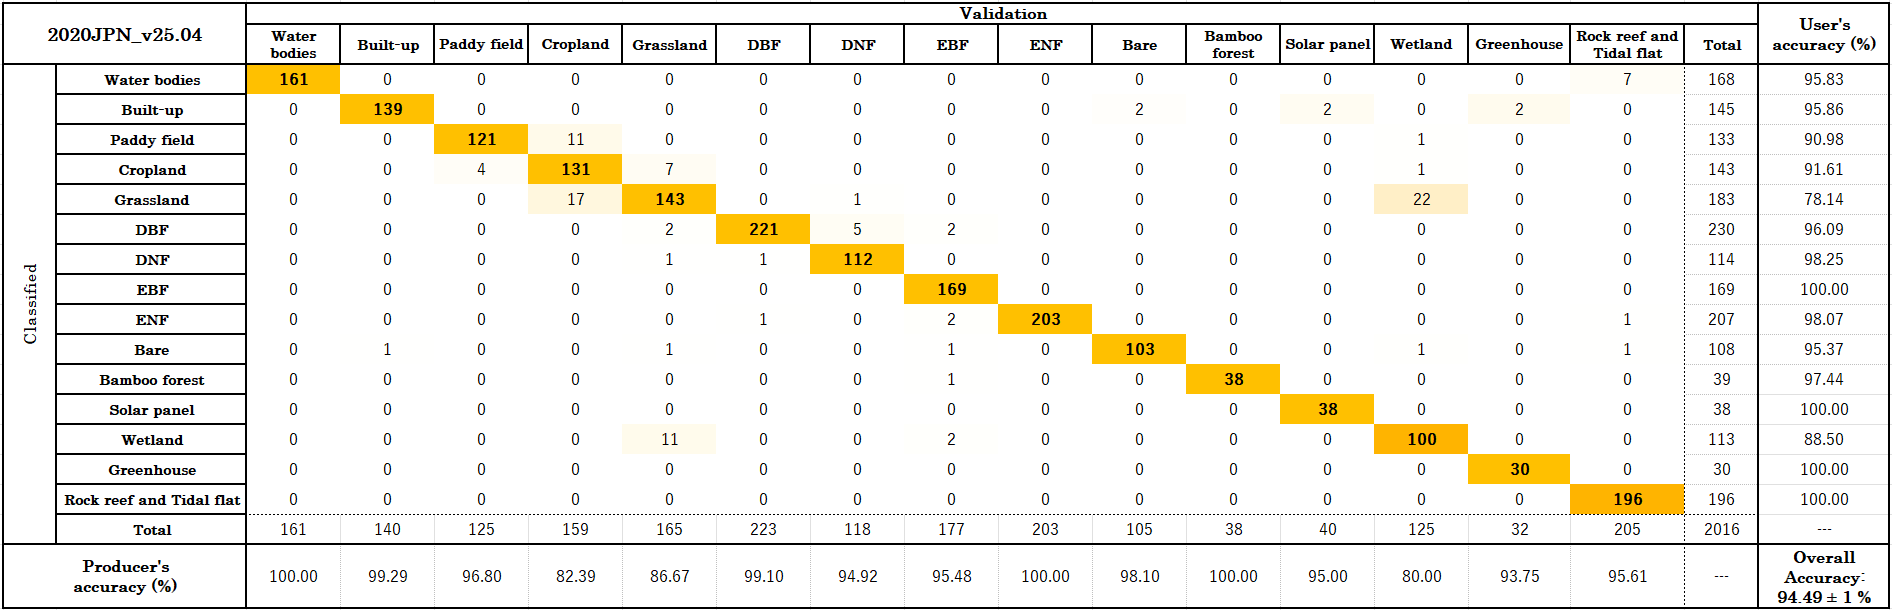
Table 2: Confusion Matrix (2022JPN_v25.04)
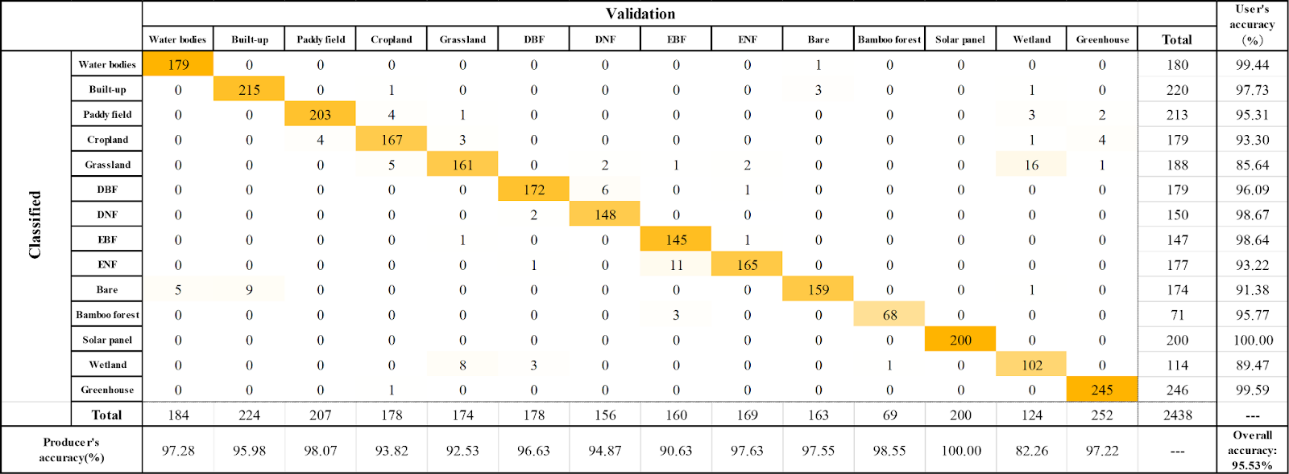
Table 3: Confusion Matrix (2024JPN_v25.04)
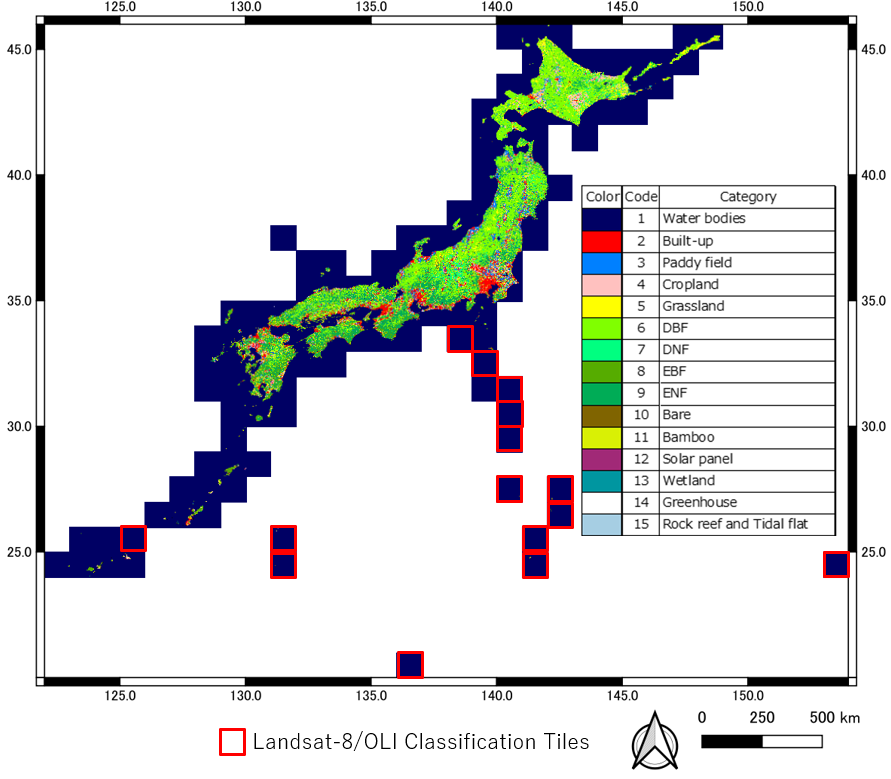
Figures 1, 2, and 3 show the overall area maps for 2020JPN_v25.04, 2022JPN_v25.04, and 2024JPN_v25.04.

Red boxes are tiles classified by Landsat-8/OLI
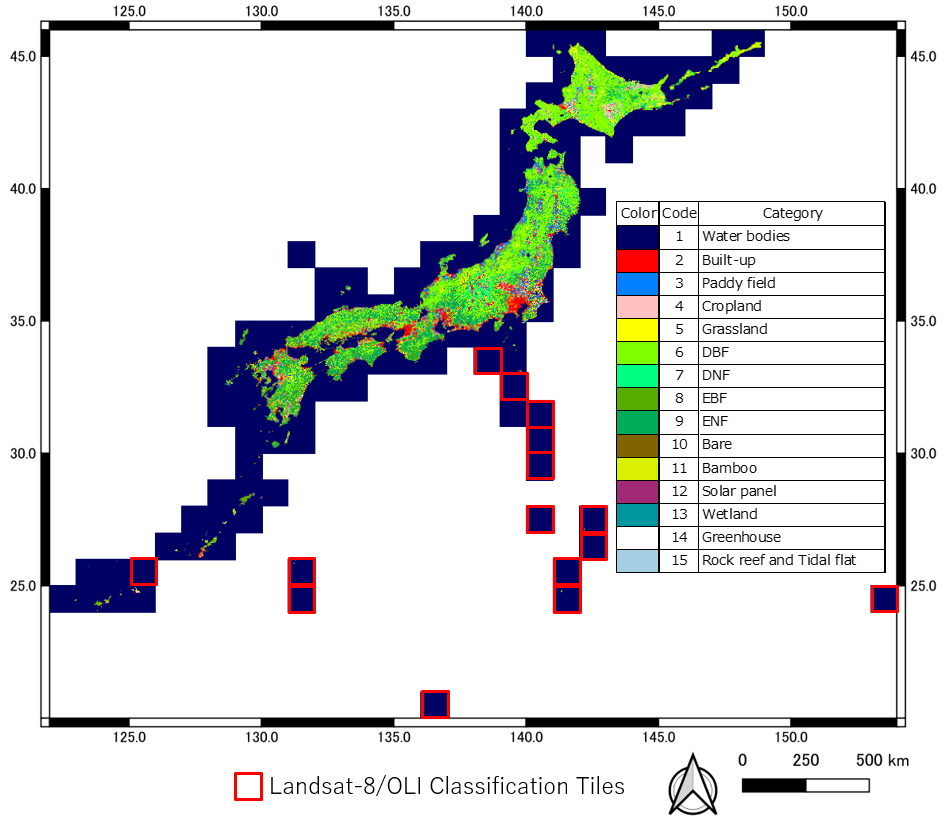
Red boxes are tiles classified by Landsat-8/OLI
Red boxes are tiles classified by Landsat-8/OLI
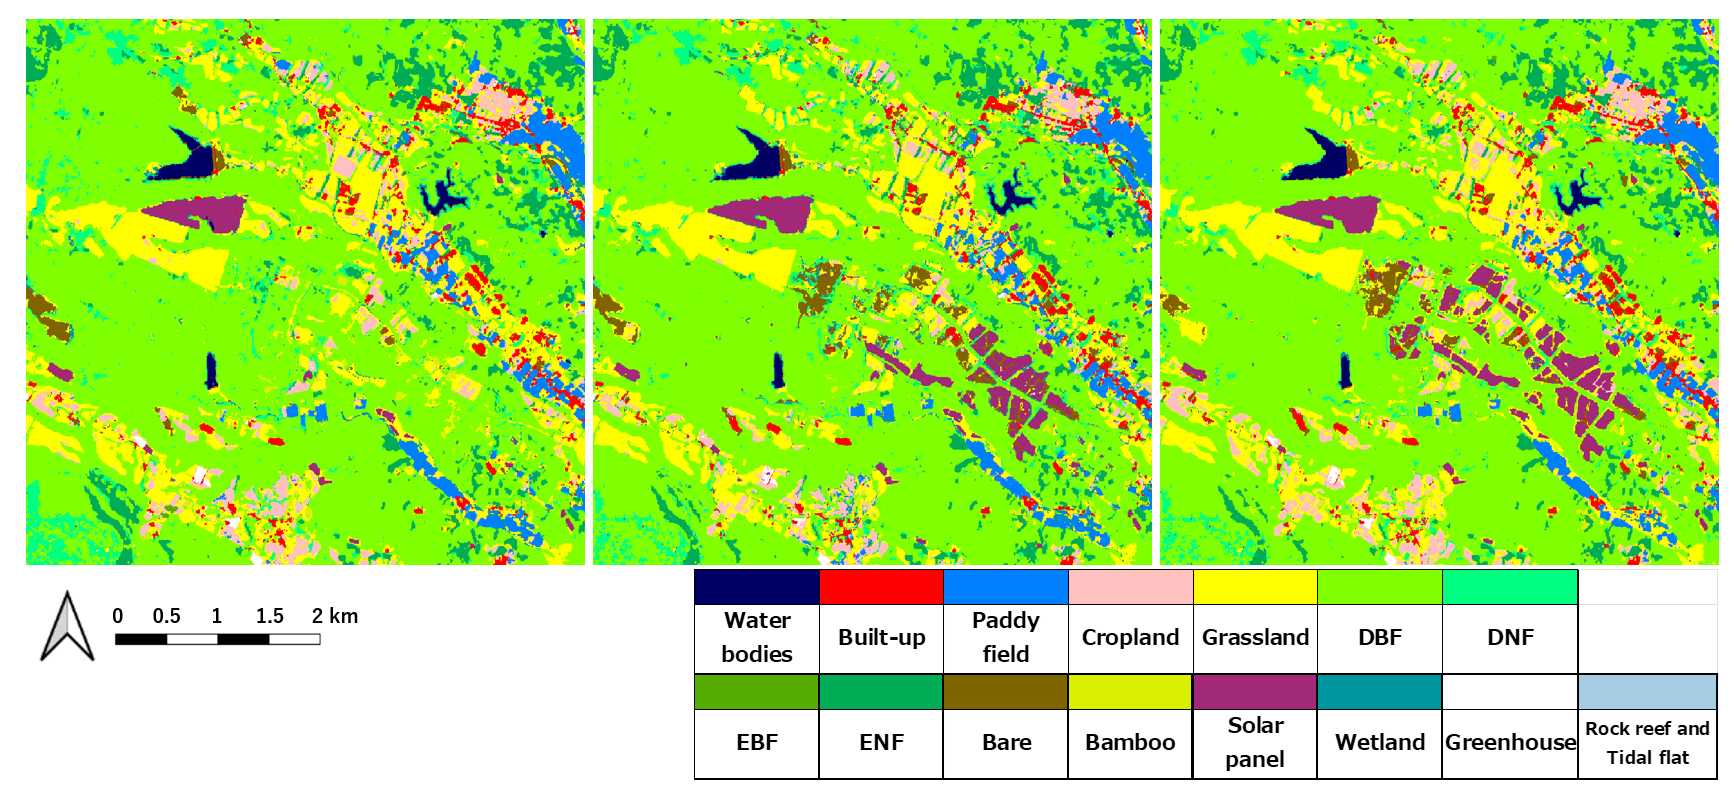
Figure 4 shows the changes due to the addition of "Rock reef and Tidal flat", and Figures 5, 6, and 7 show the locations where the changes over time were significant in the three time periods.
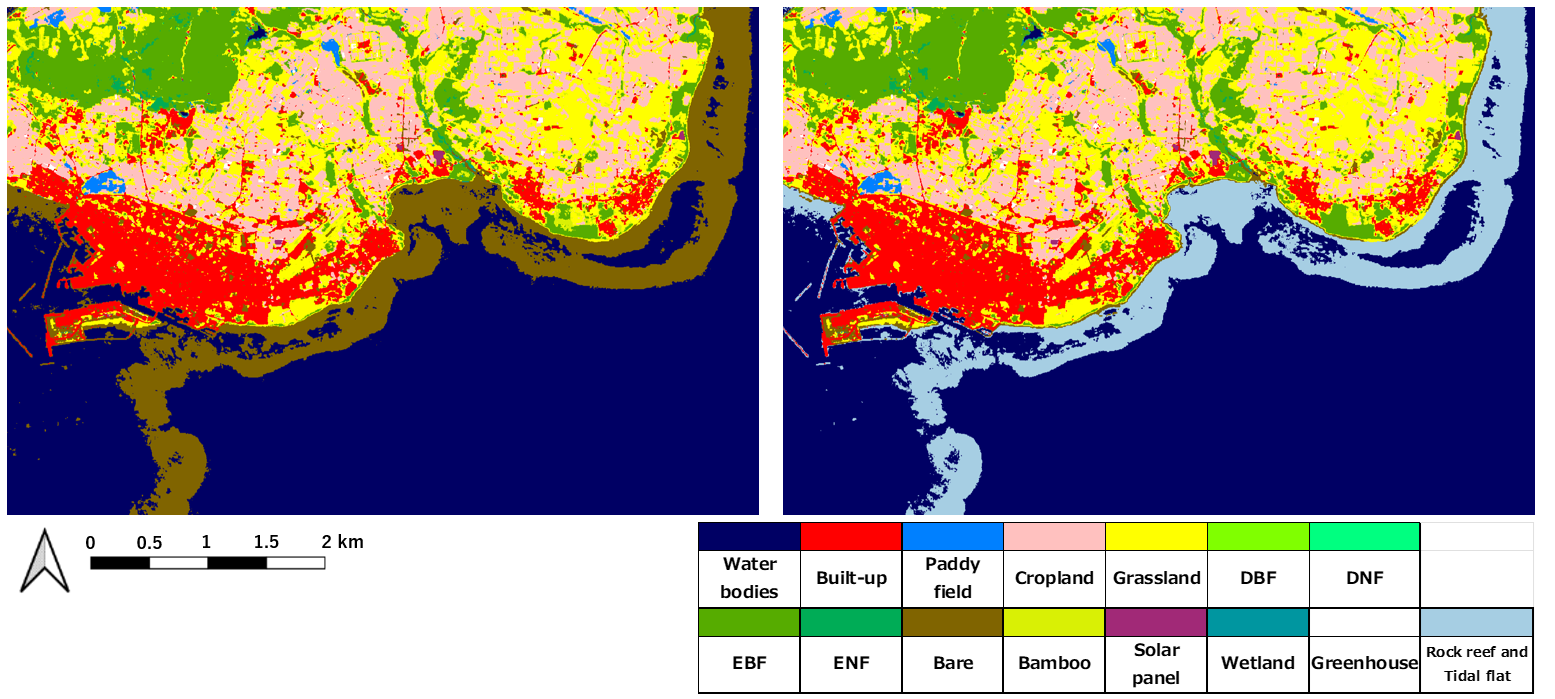
It was classified as bare land in 2022JPN_v23.12 but was correctly classified as a newly established "Rock reef and Tidal flat" in 2022JPN_v25.04.
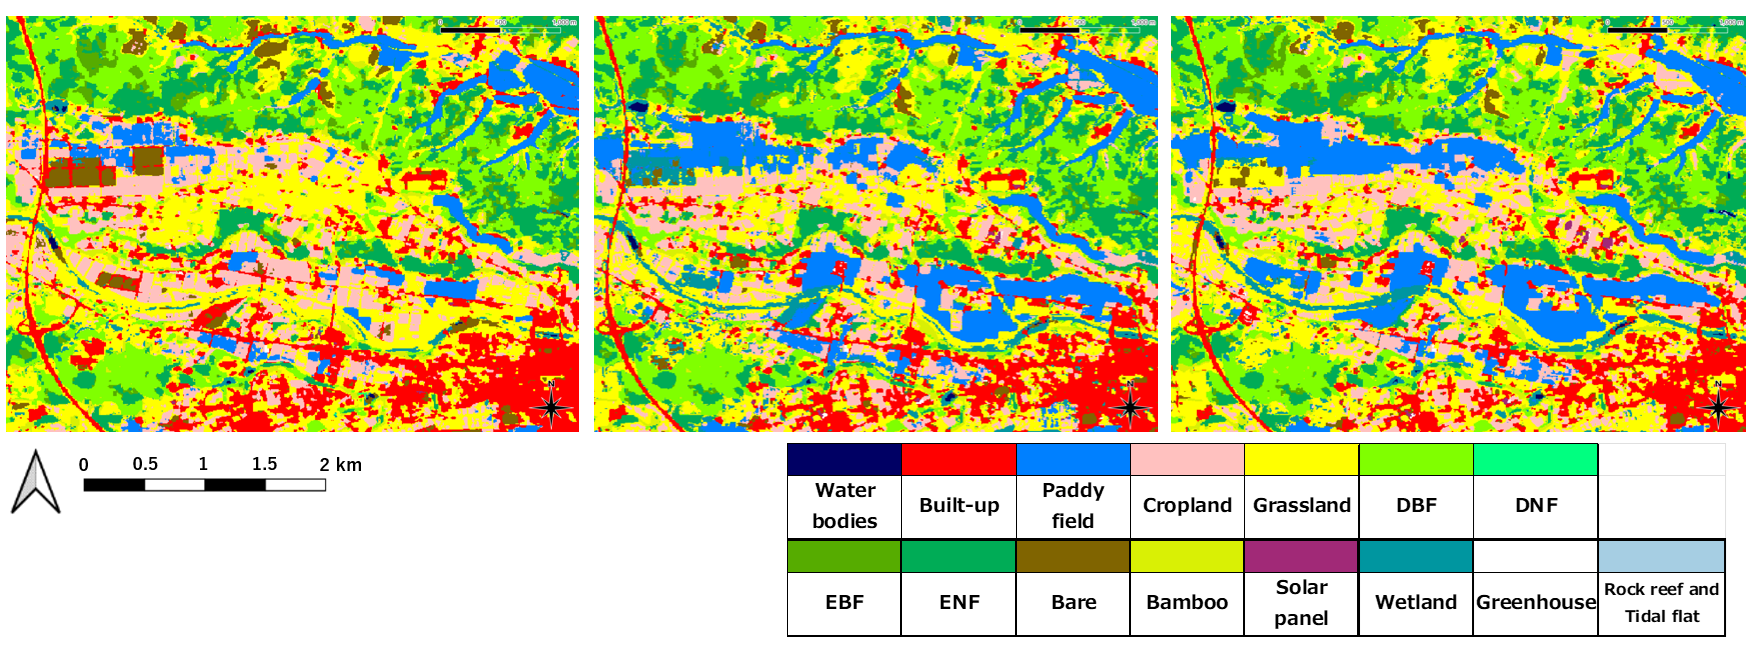
The expansion of paddy field and cropland between 2020 and 2024. In the 2020 map, bags containing decontamination waste—soil, plants, and trees—are visible on the left; by 2022, that area had been reclaimed by natural vegetation and formed a wetland, and by 2024, further plant growth had converted the wetland into grassland.
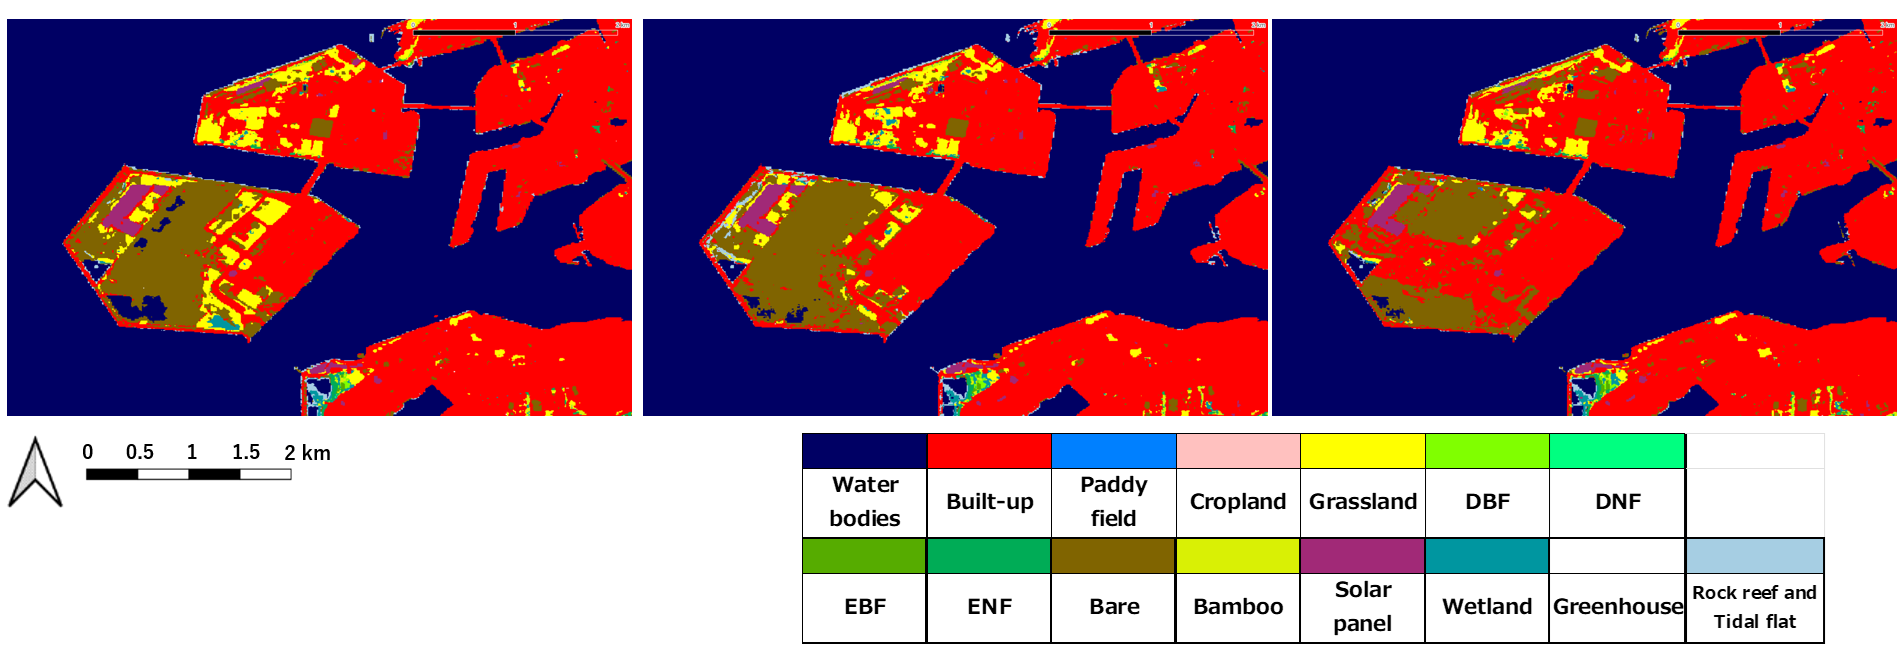
2024JPN_v25.04 shows that the preparation of the Osaka EXPO has progressed and the built-up area has increased.
It can be seen that the area of mega-solar power plants has increased over time.
Please note that land-use and land-cover categories—including paddy field and cropland double cropping, orchards, and tea plantations—are not defined as categories and may not reflect actual conditions.
6. References
- S. Hirayama, T. Tadono, M. Ohki, Y. Mizukami, K. Nishida Nasahara, K. Imamura, N. Hirade, F. Ohgushi, M. Dotsu and T. Yamanokuchi (2022): Generation of High-Resolution Land Use and Land Cover Maps in JAPAN Version 21.11, Journal of The Remote Sensing Society of Japan Vol. 42 No. 3 pp. 199-216.
- S. Hirayama, T. Tadono, Y. Mizukami, M. Ohki, K. Nishida Nasahara, S. Ito, N. Hirade, K. Imamura, R. Satake, F. Ohgushi (2023): Preliminary study for developing the FY2022 high-resolution land-use and land-cover map of Japan, Proceedings of 75th autumn conference of the Japan Remote Sensing Society of Japan, pp.25-28. (Oral presentation).
- N. Hirade, K. Imamura, T. Tadono, S. Hirayama, K. Nishida Nasahara, M. Dotsu, R. Satake, F. Ohgushi (2023): Development of RIL and interpretation systems for chaply acquiring high-accuracy reference data for optical and SAR satellite data, Proceedings of 75th autumn conference of the Japan Remote Sensing Society of Japan, pp.29-30. (Oral presentation).
- N. Hirade, K. Imamura, R. Satake, F. Ohgushi, T. Tadono, S. Hirayama, Y. Mizukami, S. Ito, K. Nishida Nasahara (2025): A study on the development and high-accuracy enhancement of 2020 JAXA high-resolution land-use and land-cover map of Japan, considering temporal consistency, Proceedings of the 2025 Spring Conference of The Association of Japanese Geographers, No.107, P91.
- S. Ito, S. Hirayama, K. Imamura, N. Hirade, F. Ohgushi, R. Satake, and K. (Nishida) Nasahara (2023): Development of High-Resolution Land Use and Land Cover Maps for Agriculture and Ecosystem Conservation around the Kanto Region, Proceedings of the Autumn Academic Conference of the Japan Society of Photogrammetry and Remote Sensing, pp.37-38.