Dataset
We do not recommend the use of the following data (old version) to our users, as improved versions (the newest version) have been released separately. However, we will continue to provide these data on this page, as we believe that some users may need these data for retrospective or revalidation of researches that have already been conducted.The newest version is here.
High-Resolution Land-Use and Land-Cover Map of Japan [2022]
(Released in December 2023 / Version 23.12)
Download product
User registration is required to download the data. Please click here about download and user registration details.
1. Summary
The Japan Aerospace Exploration Agency (JAXA) Earth Observation Research Center (EORC) creates high-resolution land cover classification maps (HRLULC) at the regional and national levels by using Earth observation data by satellites. These are basic information for regional and national land conservation such as ecosystem evaluation (growth and habitat of animals and plants, various ecosystem services), resource management (agriculture, forestry and fisheries, landscapes, etc.), disaster countermeasures (floods, sediment disasters, etc.), and so on.
This product is a high-resolution land-use and land-cover map for Japan, version 23.12 (v23.12), which reflects the situation of the entire Japan in 2022. In v23.12, we used data from the Sentinel-2 satellite in Europe, the Landsat-8 satellite in the United States (both are optical sensors), and the ALOS-2 satellite in Japan (synthetic aperture radar PALSAR-2). There are 14 new categories including wetland and greenhouse, which are useful for climate change and ecosystem service evaluation.
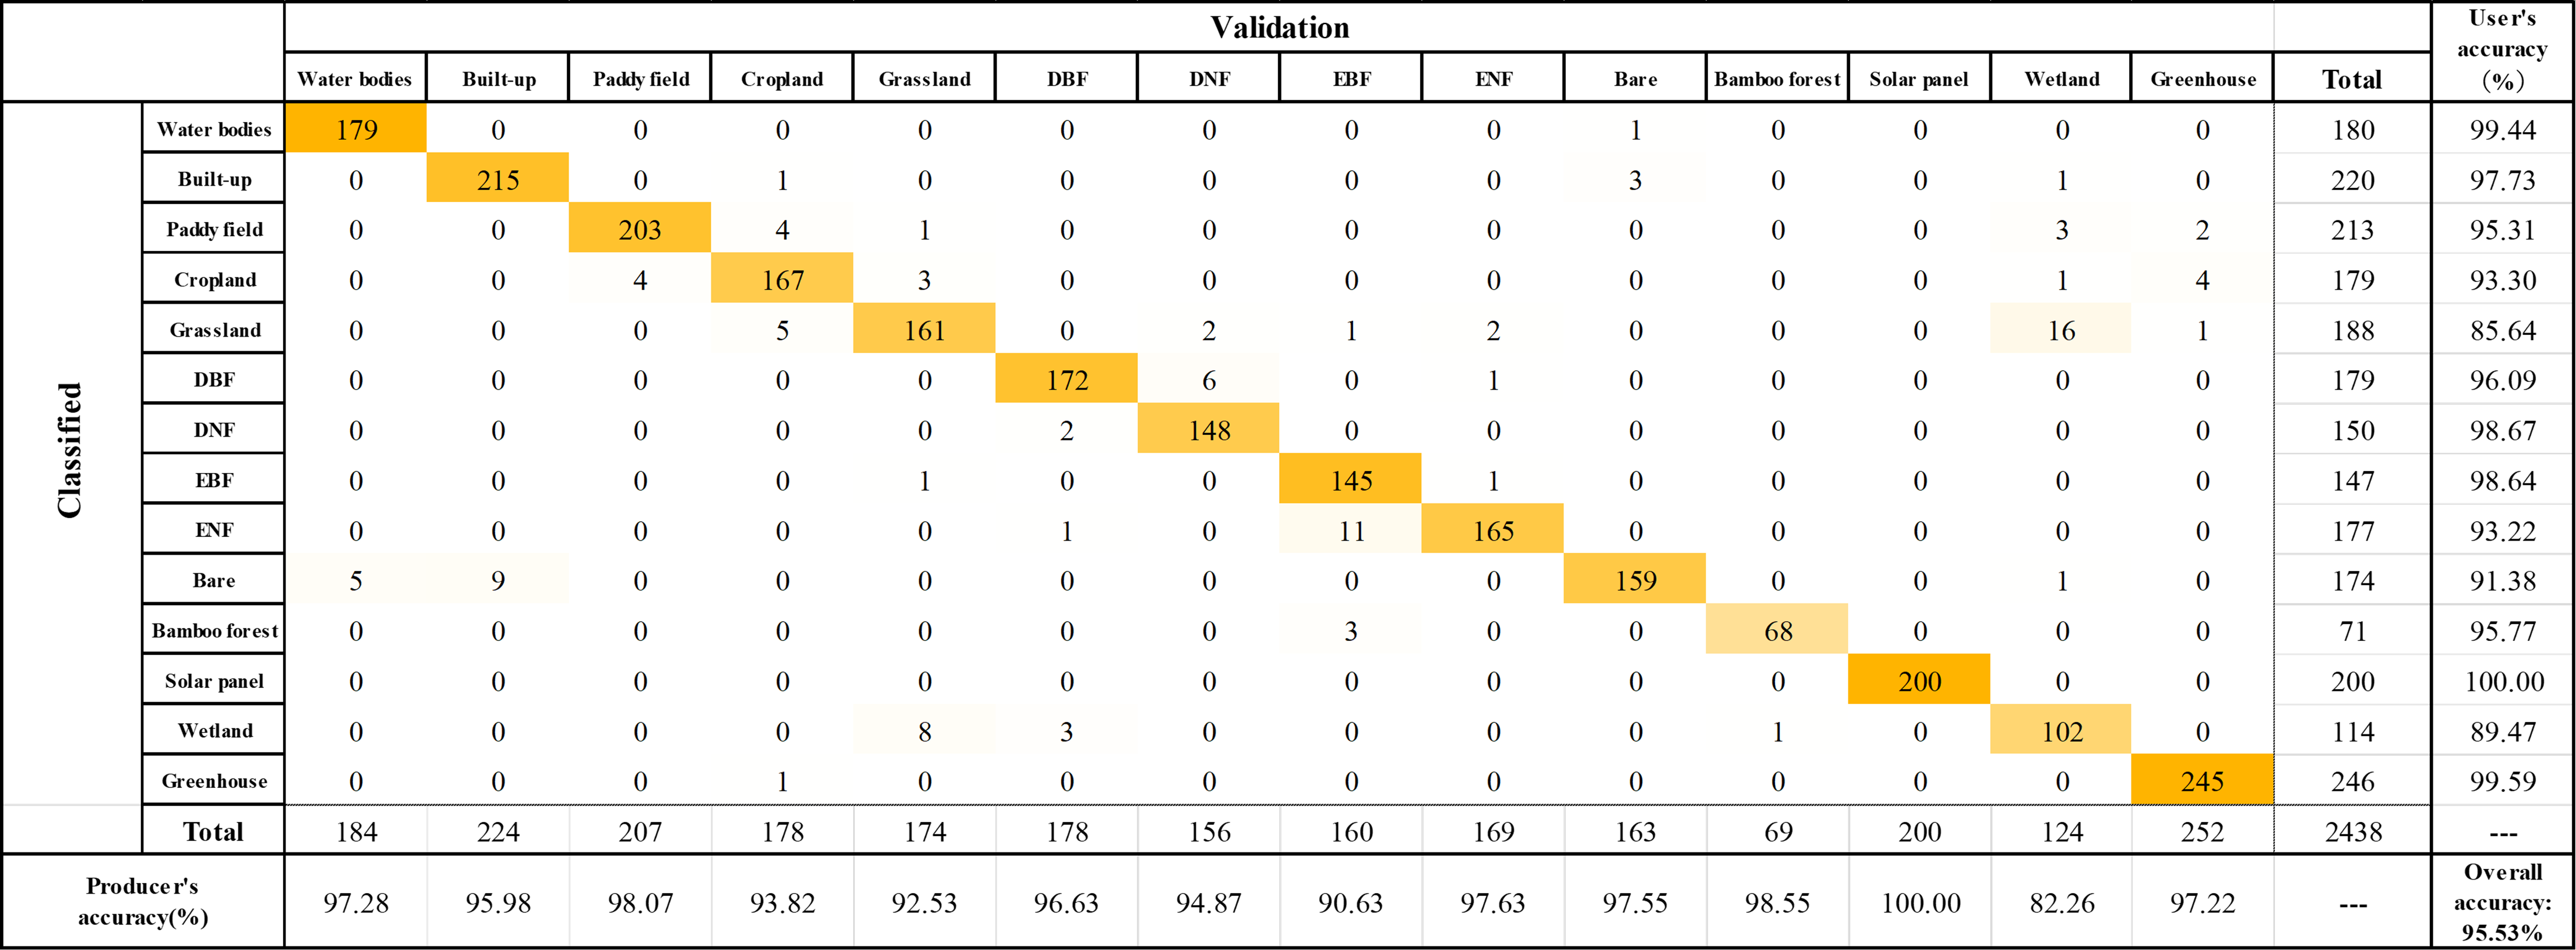
The quality of the training data and satellite data has been improved, the classification algorithm (SACLASS2) has also been improved compared to v21.11. v23.12 achieved an overall accuracy of 95.53%.
In the future, it will be possible to utilize the Global Change Observation Mission (GCOM-C) currently in operation, and the advanced radar satellite (ALOS-4). With that in mind, we will work on further improvements.
Compared to the previous version v21.11, v23,12 is mainly updated in the following points.
- Sentinel-2 data
- Changed process level from L1C to L2A (HARMONIZED)
- Updated cloud extraction algorithm: QA60 to Cloud Probability
- Changed seasonal median image from 4 periods to using 6 periods (every 2 months)
- NDSI (Normalized Snow Cover Index) calculation and addition to input
- ALOS-2 / PALSAR-2
- Creation of Yamaguchi 4-components from HBQ(6 m; HH/HV/VH/VV) data and use for input
- Creation of Texture from UBS (3 m; HH) data and use for input
- Fude polygons and OSM data added to input
- All training data and validation data were visually inspected and sorted
- Update of classification algorithm (SACLASS2.5)
- Adding training points through active learning
- Noise removal by ensemble learning
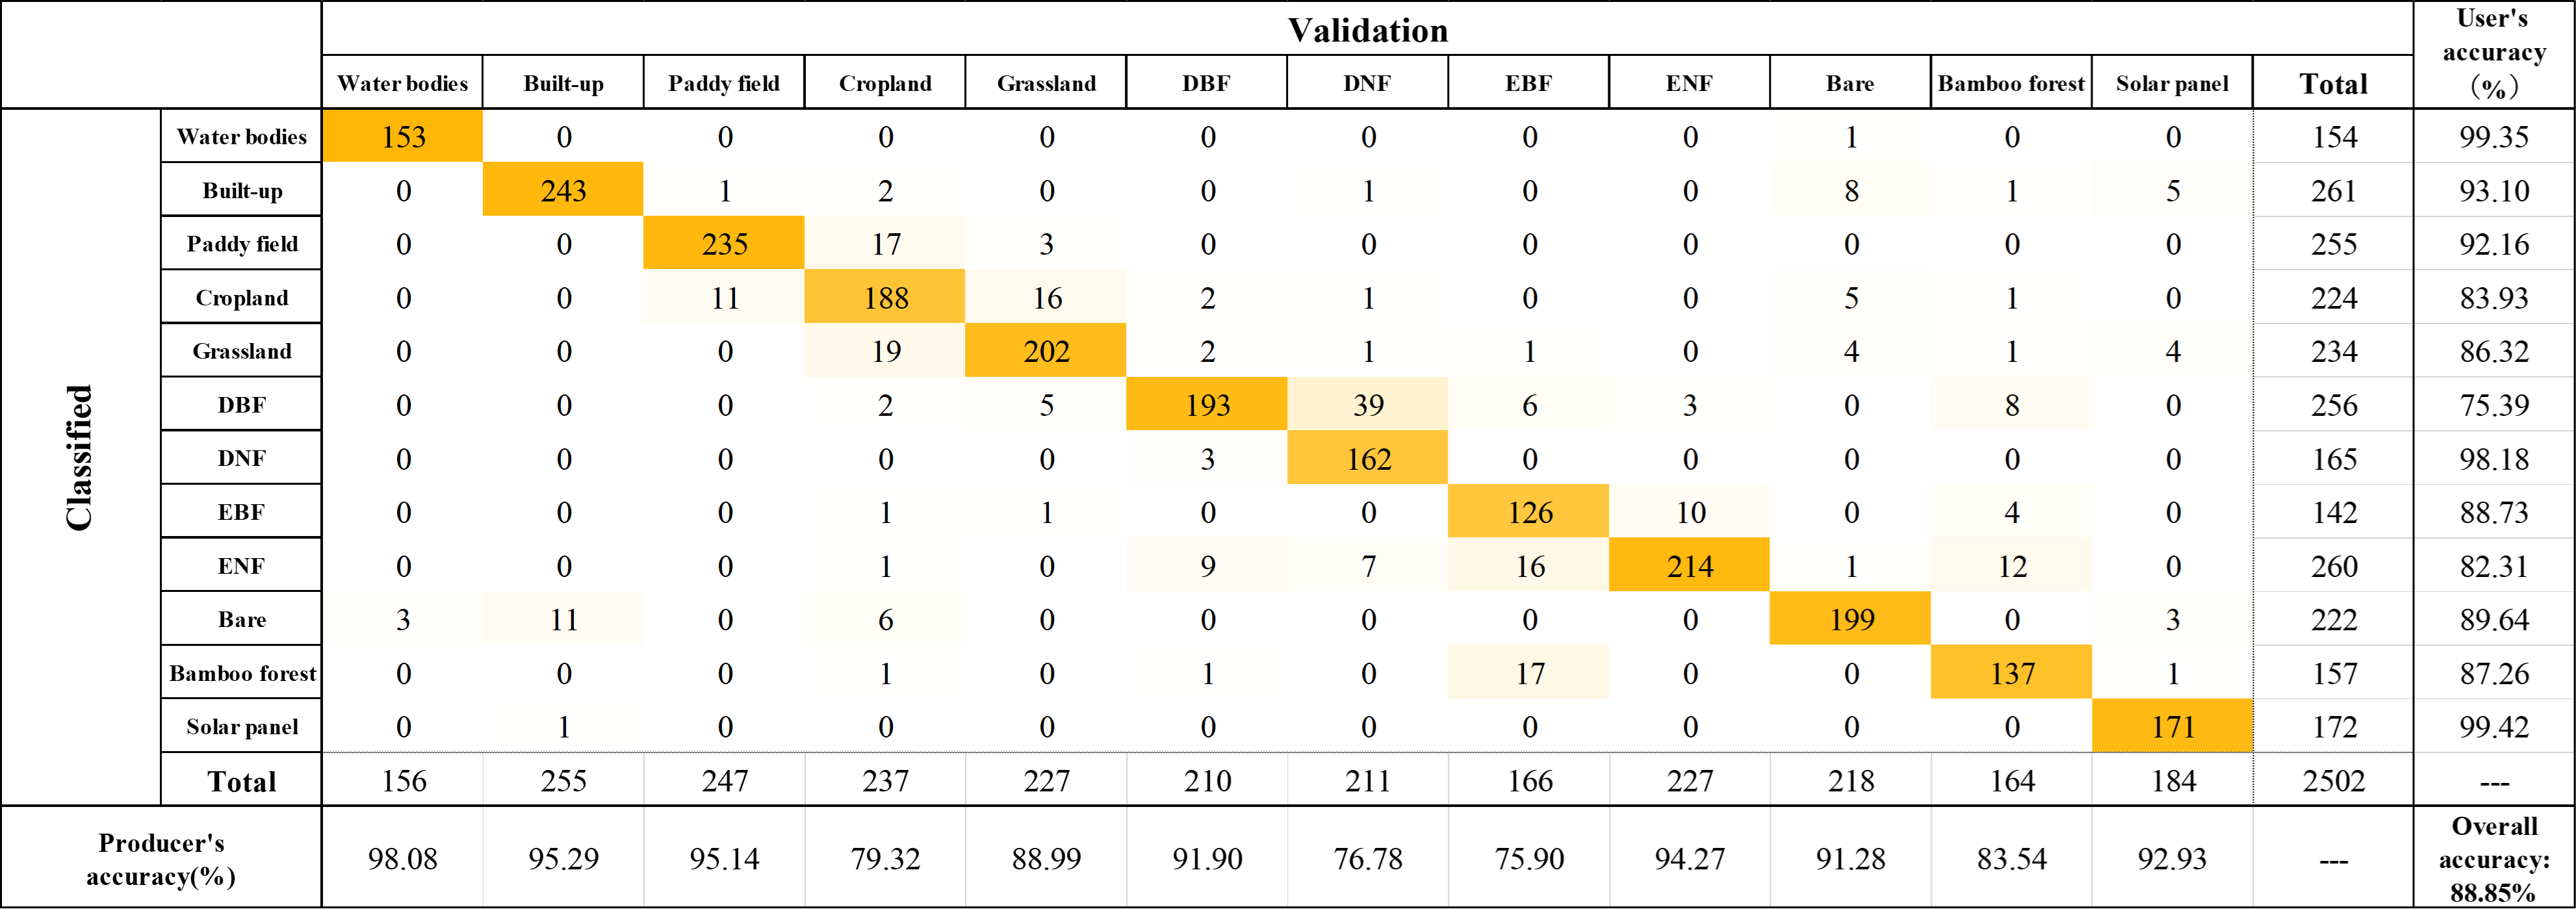
As a result, the overall accuracy increased to 95.53% for this version (v23.12), compared to 88.85% for v21.11. In particular, the noise was reduced overall compared to v21.11. Improved such as riverbed and shoreline detail.
2. Data used for creating the map
- Data 1. Sentinel-2 Level-2A (L2A) obtained from Google Earth Engine API.
- Data 2. ALOS-2 / PALSAR-2 (HBQ, UBS)
- Data 3. Training data (used in v21.11)
- Data 4. ALOS PRISM Digital Surface Model (AW3D)
- Data 5. Raster map of slope obtained from the Data 4
- Data 6. Fude polygon by Ministry of Agriculture, Forestry and Fisheries
- Data 7. Road network vector data from OpenStreetMap (used to create raster maps of distances from roads) © OpenStreetMap contributors
3. Classification algorithm
The classification method adopted in v23.12 is shown below.
3.1 Preprocessing
- Cloud masking, three-month median composite, calculation of vegetation indices (Sentinel-2 L2A)
- Constructing the feature space:
Time series of Sentinel-2 L2A band reflectance, NDVI, GRVI, NDWI1, NDWI2, NDSI, GSI
Non-time series of ALOS-2/PALSAR-2 HBQ, UBS
Ancillary data: AW3D DSM, Slope, Fude polygon, OSM raster map, latitude and longitude
3.2 Classification
Classification with the above input data using SACLASS 2.5; in SACLASS 2.5, time-series data is mapped to CNNs and non-time-series data to NNs. By separating the input data, the dimensionality of the feature set is reduced, which improves classification accuracy and reduces computational cost.
3.3 Postprocessing
- Applying of ensemble learning.
- Applying Gaussian blur filter.
- Correction of abnormal values by visual inspection.
4. Data format
| Period of coverage | From year 2022. It represents the average situation, not the specific point in time. |
|---|---|
| Coordinate system | Geographic latitude and longitude coordinates (WGS84) |
| Tile unit | 1 degree x 1 degree, (12,000 pixels x 12,000 lines) |
| Mesh size | (1 / 12,000) degree × (1 / 12,000) degree (corresponding to approximate 10 m × 10 m) |
| File naming convention | For example, LC_N45E142.tif indicates 45 to 46 degrees north latitude and 142 to 143 degrees east longitude. |
| Format | GeoTIFF format |
| Number of files | 131 (Increased by 5 tiles from v21.11) |
The value of each pixel is the ID number of the category for classification as follows:
- #1: Water bodies
- #2: Built-up
- #3: Paddy field
- #4: Cropland
- #5: Grassland
- #6: Deciduous Broad-leaved Forest (DBF)
- #7: Deciduous Needle-leaved Forest (DNF)
- #8: Evergreen Broad-leaved Forest (EBF)
- #9: Evergreen Needle-leaved Forest (ENF)
- #10: Bare
- #11: Bamboo forest
- #12: Solar panel
- #13: Wetland
- #14: Greenhouse
5. Accuracy verification

As reference information, the accuracy verification result of the previous version (v21.11) is shown in the confusion matrix below (see Table 2; in v21.11).

The following figures are summary and examples of v23.12 in comparison to the previous versions.


v21.11 had fake paddy fields, fake croplands, and fake built-ups on the riverbed, while v23.12 has no such misclassification.

In v21.11 it was grassland, but in v23.12 it was correctly classified as wetland.

Greenhouses were classified as either built-ups or croplands in v21.11,
but are now correctly classified as greenhouses in v23.12.
6. References
- Sota HIRAYAMA, Takeo TADONO, Masato OHKI, Yousei MIZUKAMI, Kenlo NISHIDA NASAHARA, Koichi IMAMURA, Naoyoshi HIRADE, Fumi OHGUSHI, Masanori DOTSU and Tsutomu YAMANOKUCHI (2022): Generation of High-Resolution Land Use and Land Cover Maps in JAPAN Version 21.11. Journal of The Remote Sensing Society of Japan Vol. 42 No. 3 pp. 199-216
- "Preliminary study for developing the FY2022 high-resolution land-use and land-cover map of Japan", S. Hirayama, T. Tadono, Y. Mizukami, M. Ohki, K. Nishida Nasahara, S. Ito, N. Hirade, K. Imamura, R. Satake, F. Ohgushi, proceedings of 75th autumn conference of the Japan Remote Sensing Society of Japan, pp.25-28. (Oral presentation).
- "Development of RIL and interpretation systems for chaply acquiring high-accuracy reference data for optical and SAR satellite data", N. Hirade, K. Imamura, T. Tadono, S. Hirayama, K. Nishida Nasahara, M. Dotsu, R. Satake, F. Ohgushi, proceedings of 75th autumn conference of the Japan Remote Sensing Society of Japan, pp.29-30. (Oral presentation).
- Shun Ito, Sota Hirayama, Koichi Imamura, Naoyoshi Hirade, Fumi Ohgushi, Ryo Satake, and Kenlo (Nishida) Nasahara: Development of High-Resolution Land Use and Land Cover Maps for Agriculture and Ecosystem Conservation around the Kanto Region, Proceedings of the Autumn Academic Conference of the Japan Society of Photogrammetry and Remote Sensing, pp.37-38, 2023(abstract,presentation[Japanese])
- Izumisama H., Hirayama S., Mizukami Y., Nasahara K.N. (2023) Creation of a High-Resolution Land Use and Land Cover Map for Okinawa Island by Integrated Localization. Journal of The Remote Sensing Society of Japan 43(2), pp. 73-85