Dataset
High-Resolution Land-Use and Land-Cover Map of Okinawa Island [2020]
(Released in January 2023 / Version 23.01)
Download product
User registration is required to download the data. Please click here about download and user registration details.
1. Summary
The Japan Aerospace Exploration Agency Earth Observation Research Center, in collaboration with the University of Tsukuba and the Remote Sensing Technology Center of Japan, has developed and released national-level land use land cover maps. We have now started to develop regional-level land use land cover maps. As a part of this project, we have released a High-Resolution Land-Use Land-Cover Map of Okinawa Island as version 23.01 (Note: 23.01 means "the version released in January 2023"). This map (HRLULC-Okinawa v23.01) is based on the classification system of HRLULC-Japan, but excludes deciduous broad-leaved forests, deciduous needle-leaved forests, and bamboo forests, and includes agricultural greenhouses, sugar cane fields, pineapple fields, and mangrove forests. HRLULC-Okinawa v23.01 was created by combining satellite images with probability maps from HRLULC-Japan v21.11 and Google’s Dynamic World (DW), and Fude Polygons from the Ministry of Agriculture, Forestry and Fisheries, and using machine learning (Random Forests) for classification, resulting in an overall accuracy of 88.45%.
In the future, we plan to continue developing region-specific land cover maps by utilizing the Global Change Observation Mission-Computer (GCOM-C) and Advanced Land Observing Satellite-2 (ALOS-2), which are currently in operation, as well as the advanced radar satellite (ALOS-4), which are scheduled to be launched.
2. Data used for creating the map and preprocessing
- Data 1. Sentinel-1/C-SAR imagery: We used the product provided by Google Earth Engine (GEE) as COPERNICUS/S1_GRD. We created 3-monthly median composite images and performed index value calculations.
- Data 2. Sentinel-2/MSI imagery:: We used the product provided by GEE as COPERNICUS/S2. After cloud masking, we created 3-monthly median composite images and performed index value calculations.
- Data 3. Probability map of HRLULC-Japan ver. 21.11: We used the "classification probability" which is the intermediate data of Japan v21.11. We performed resampling on the data.
- Data 4. DW probability map: We used "class probabilities" provided on GEE as GOOGLE/DYNAMICWORLD/V1 (*1). We created a 1-year average composite image.
- Data 5."Fude Polygons", agricultural land parcel data: We used the data for the year 2021 provided on the Fude Polygons download page (*2). We performed rasterization on the data and resampled it to 10 m resolution using the mean pixel method.
- Data6. Reference data: We obtained by deciphering from ground survey and information on the Internet (about 3,000 sites).
*1: "This dataset is produced for the Dynamic World Project by Google in partnership with National Geographic Society and the World Resources Institute." (CC-BY 4.0; Terms of Use: https://developers.google.com/earth-engine/datasets/catalog/GOOGLE_DYNAMICWORLD_V1#terms-of-use)
*2: Source: "Fude Polygon Data," Ministry of Agriculture, Forestry and Fisheries (downloaded September 3, 2021; Terms of Use: https://www.maff.go.jp/j/tokei/porigon/attach/pdf/hudeporidl-1.pdf)
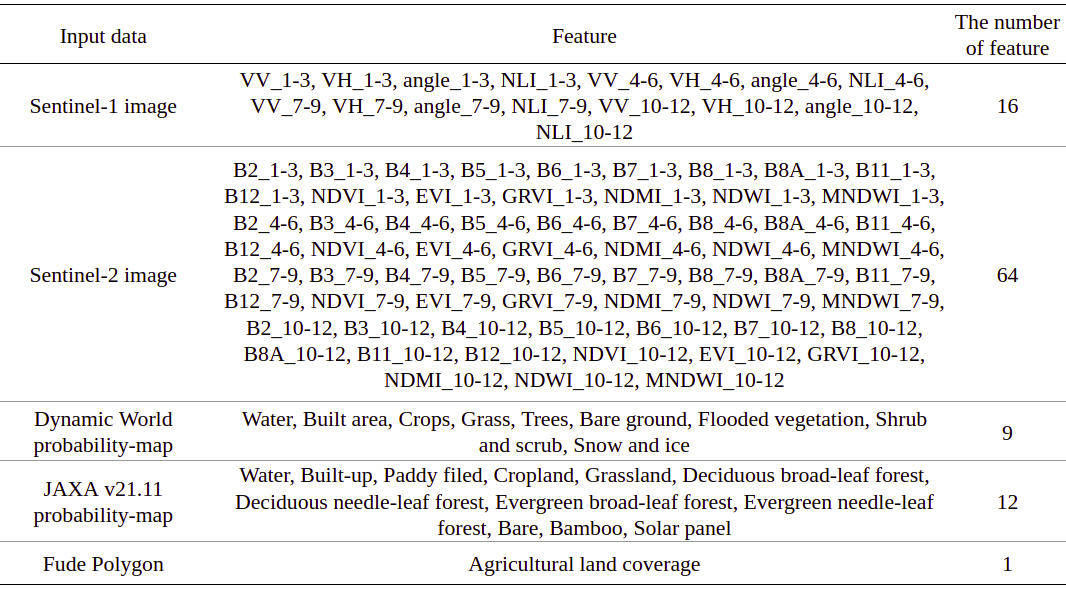
We combined data 1-5 to construct the feature space in Table 1.
Table 1 Summary of input data and features.
The labels of feature names, such as 1-3, 4-7, 7-9, and 10-12, refer to the composite period of the composite image (1-3: January-March 2020; 4-7: April-June 2020; 7-9: July-September 2020; 10-12: January-March 2020).
3. Classification and creating HRLULC-Okinawa v23.01
We applied Random Forests with reference data as training data. In addition, we visually inspected the obtained classification maps and corrected outliers, and obtained HRLULC-Okinawa v23.01.
4. Data Format
| Period of coverage | 2020 |
|---|---|
| Coordinate system | Geographic latitude and longitude coordinates (WGS84) |
| Target area | North latitude 26°03'35.808" – 26°53'25.904", East longitude 127°37'11.889" – 128°21'00.108" |
| Structure | 1-byte unsigned integer, 9246 pixels x 8127 pixels (1 pixel corresponds to approximately 10m x 10m) |
| File name | LC_Okinawa.tif |
| Format | GeoTIFF format |
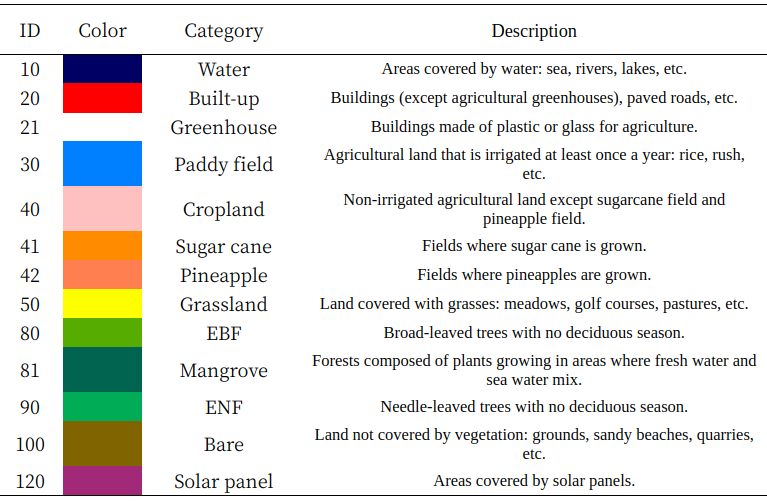
Table 2 The classification system of HRLULC-Okinawa
5. Accuracy verification
Table 3 The confusion matrix of v23.01
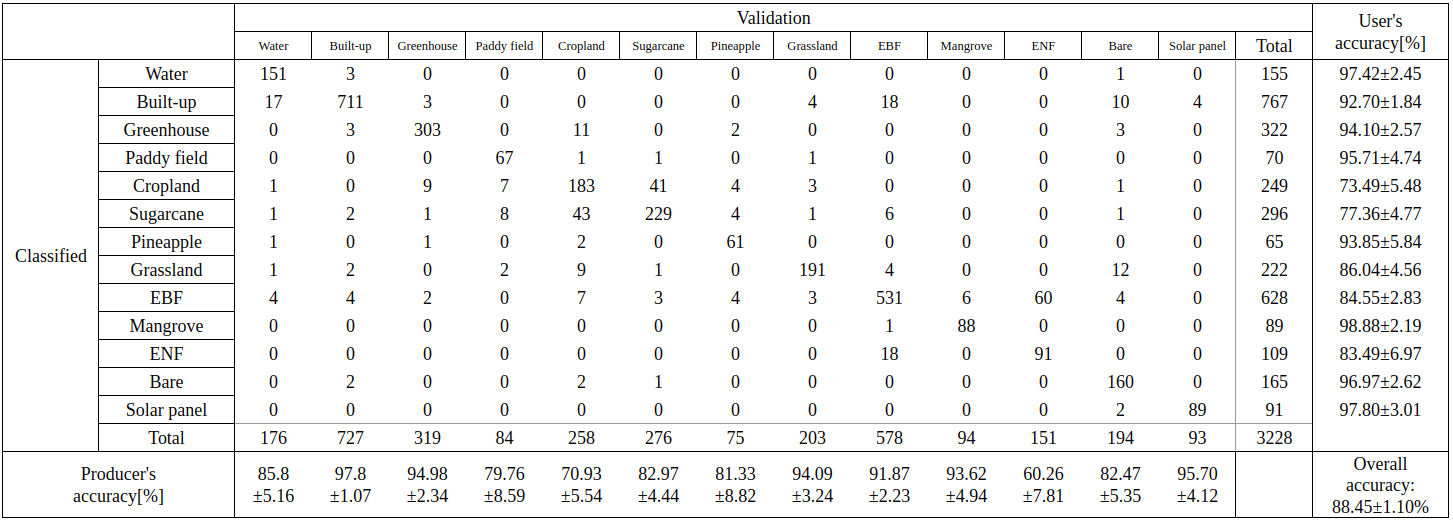
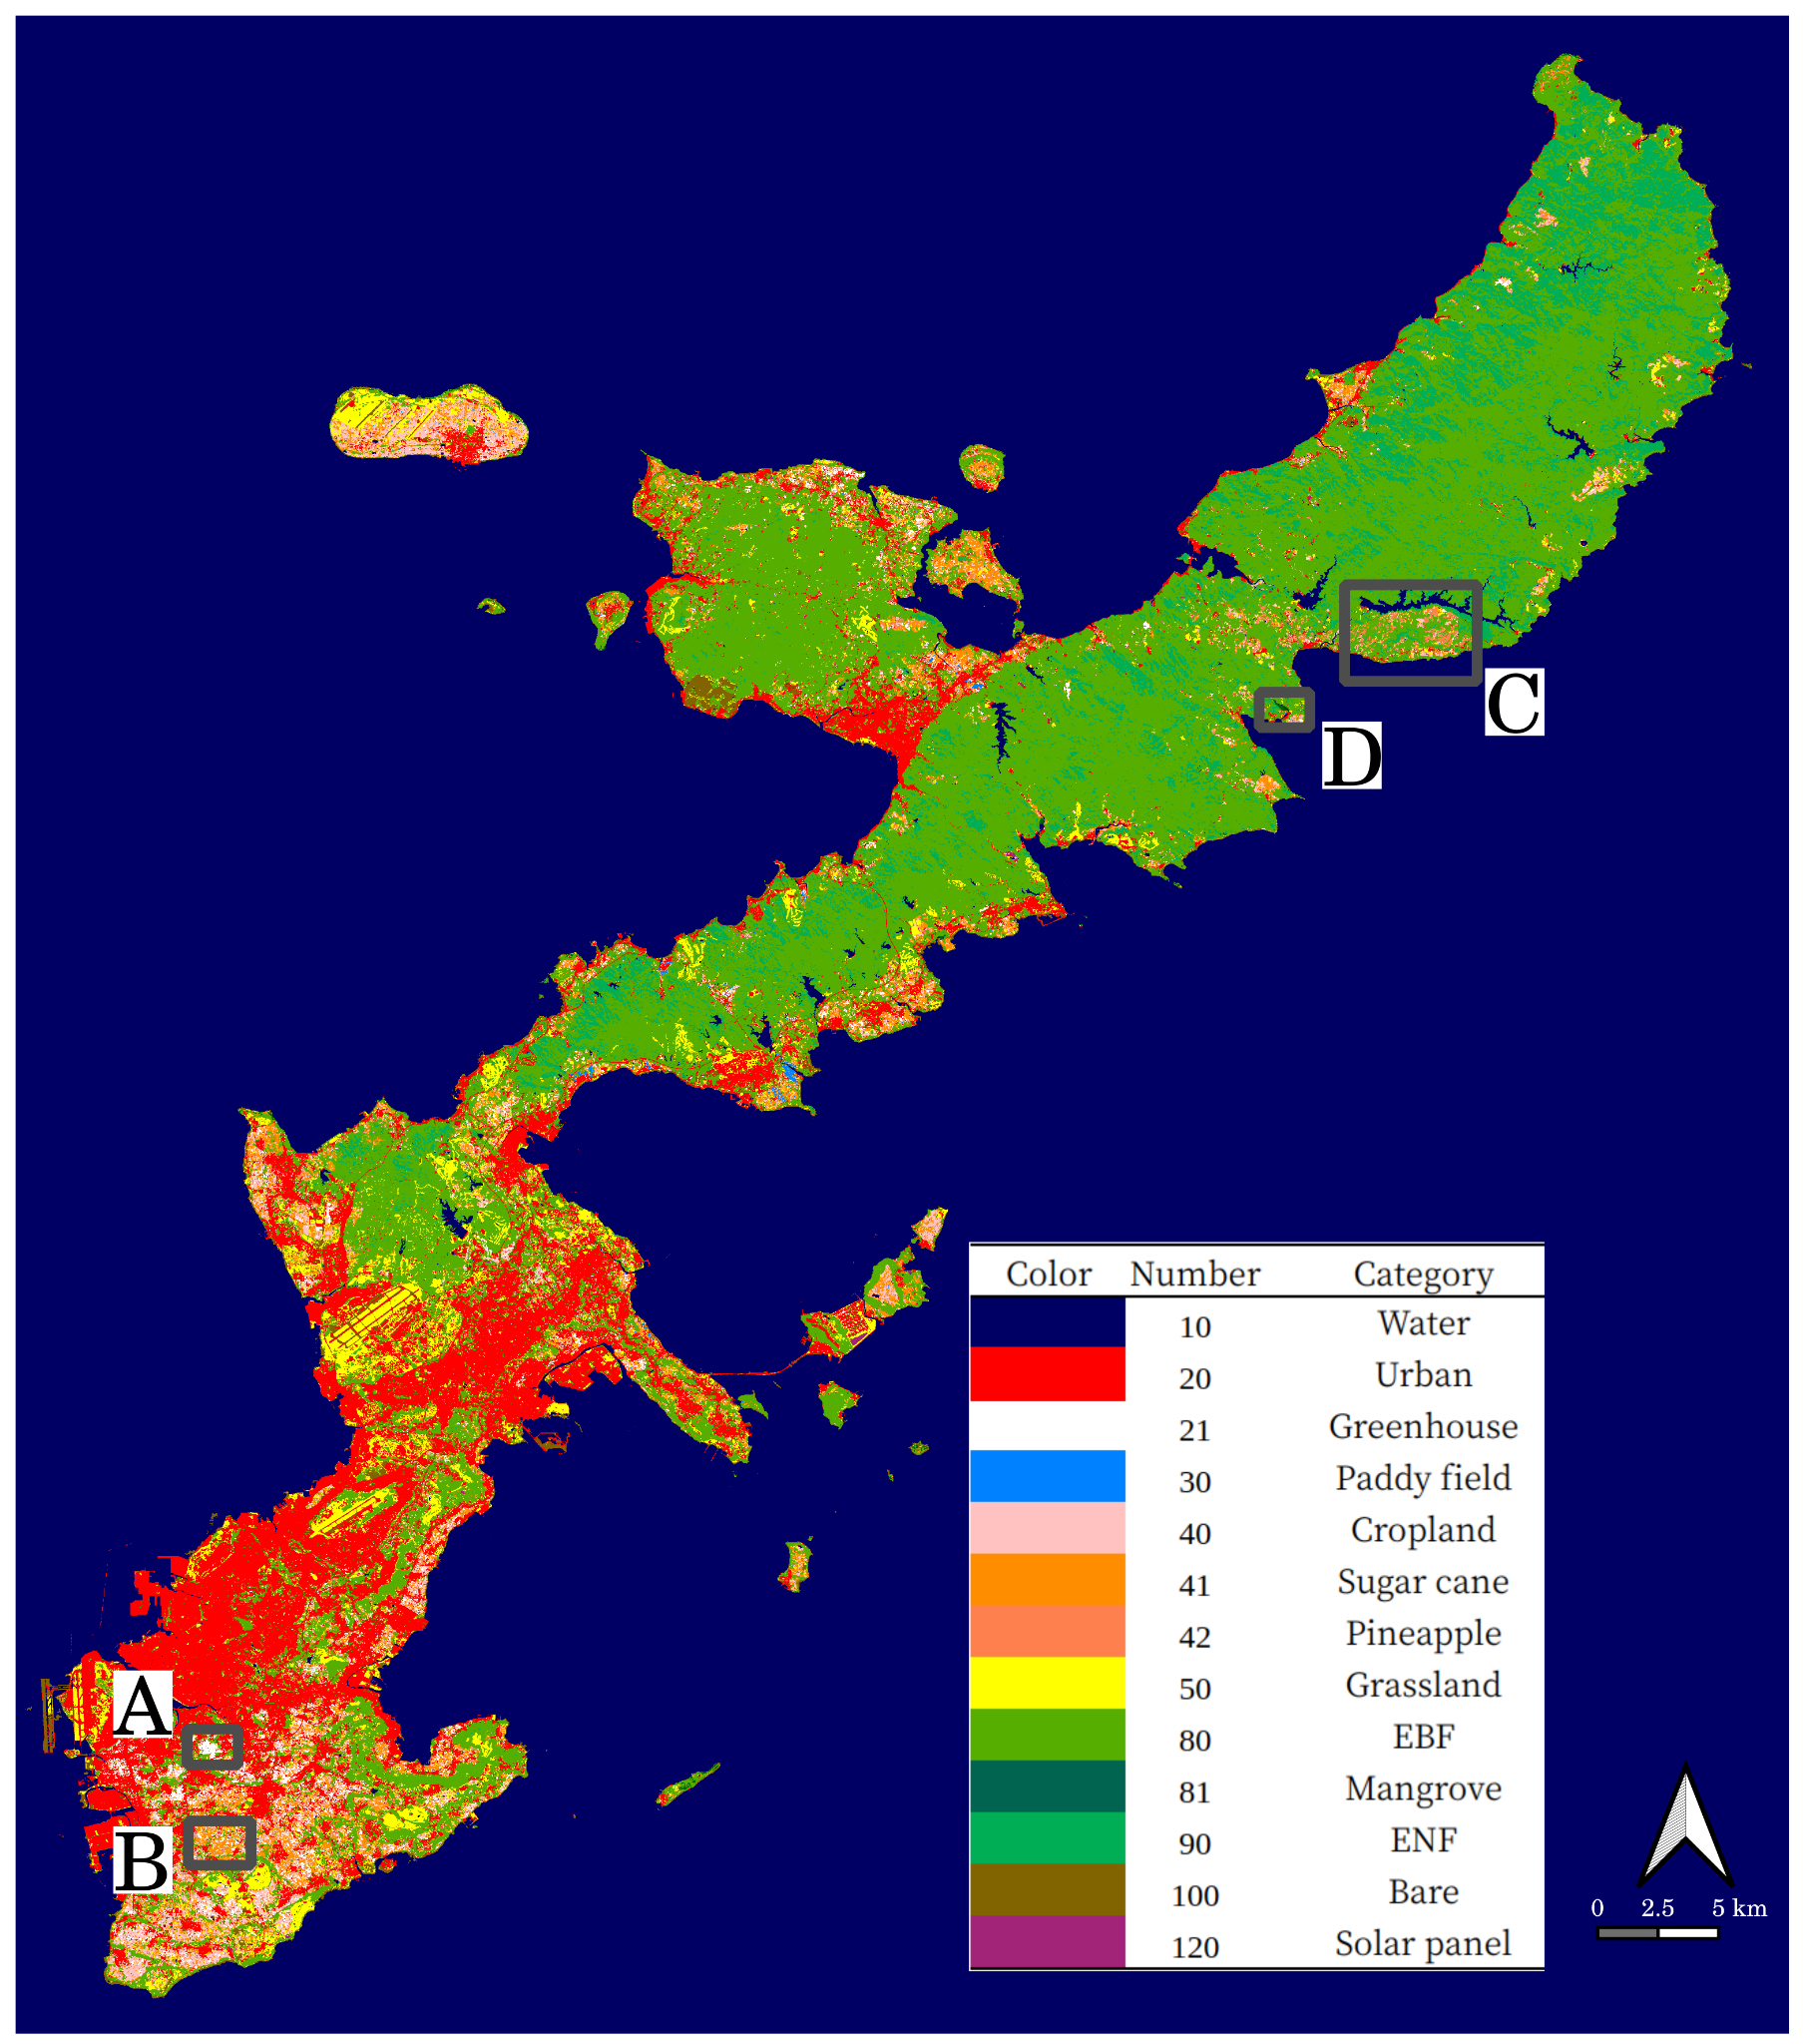
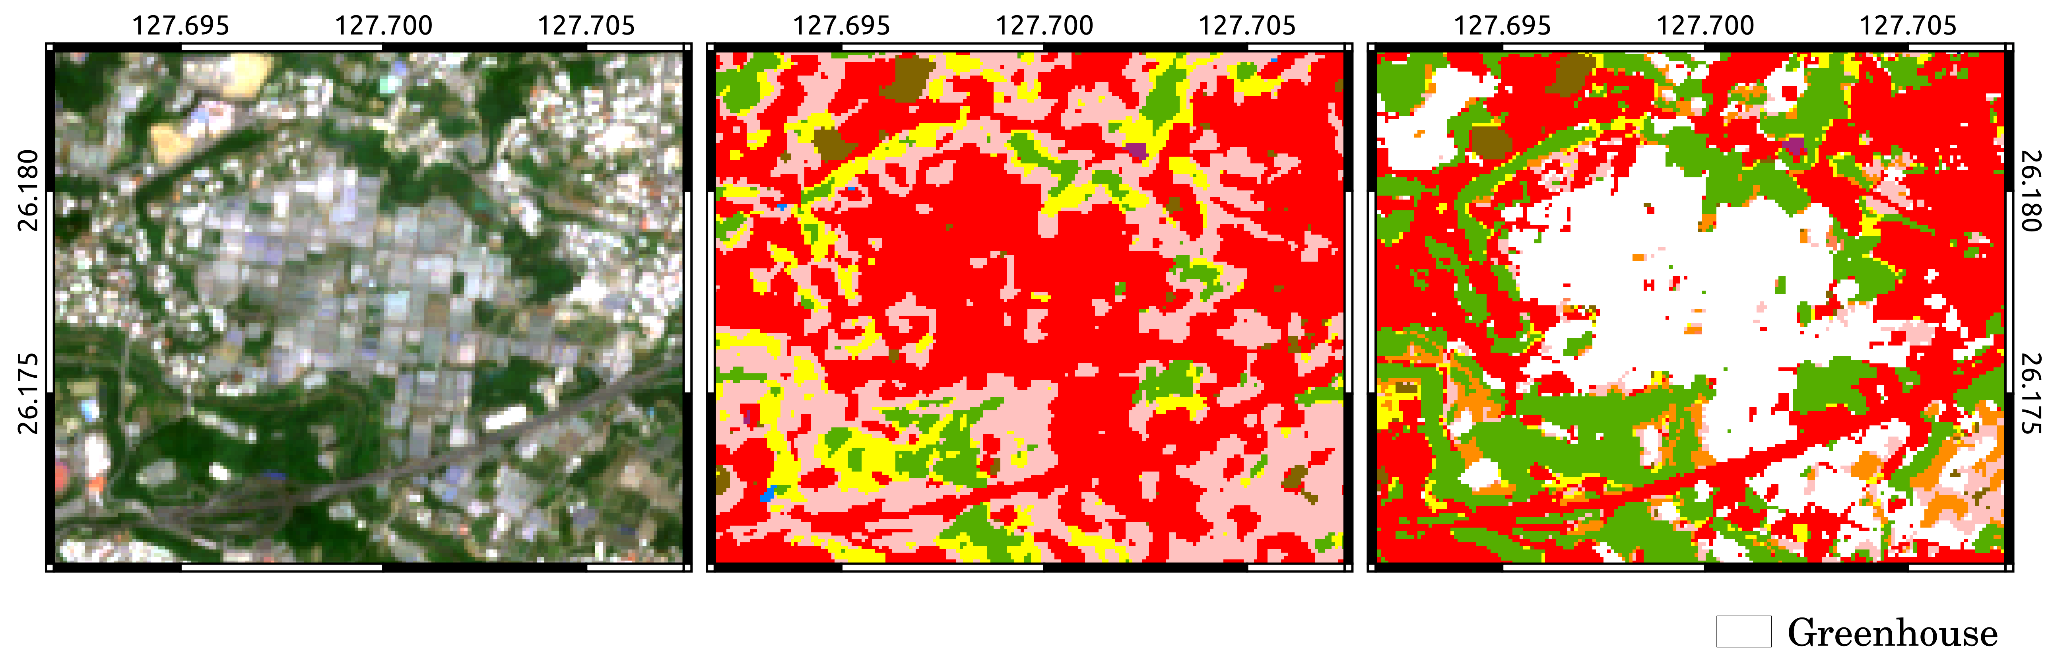
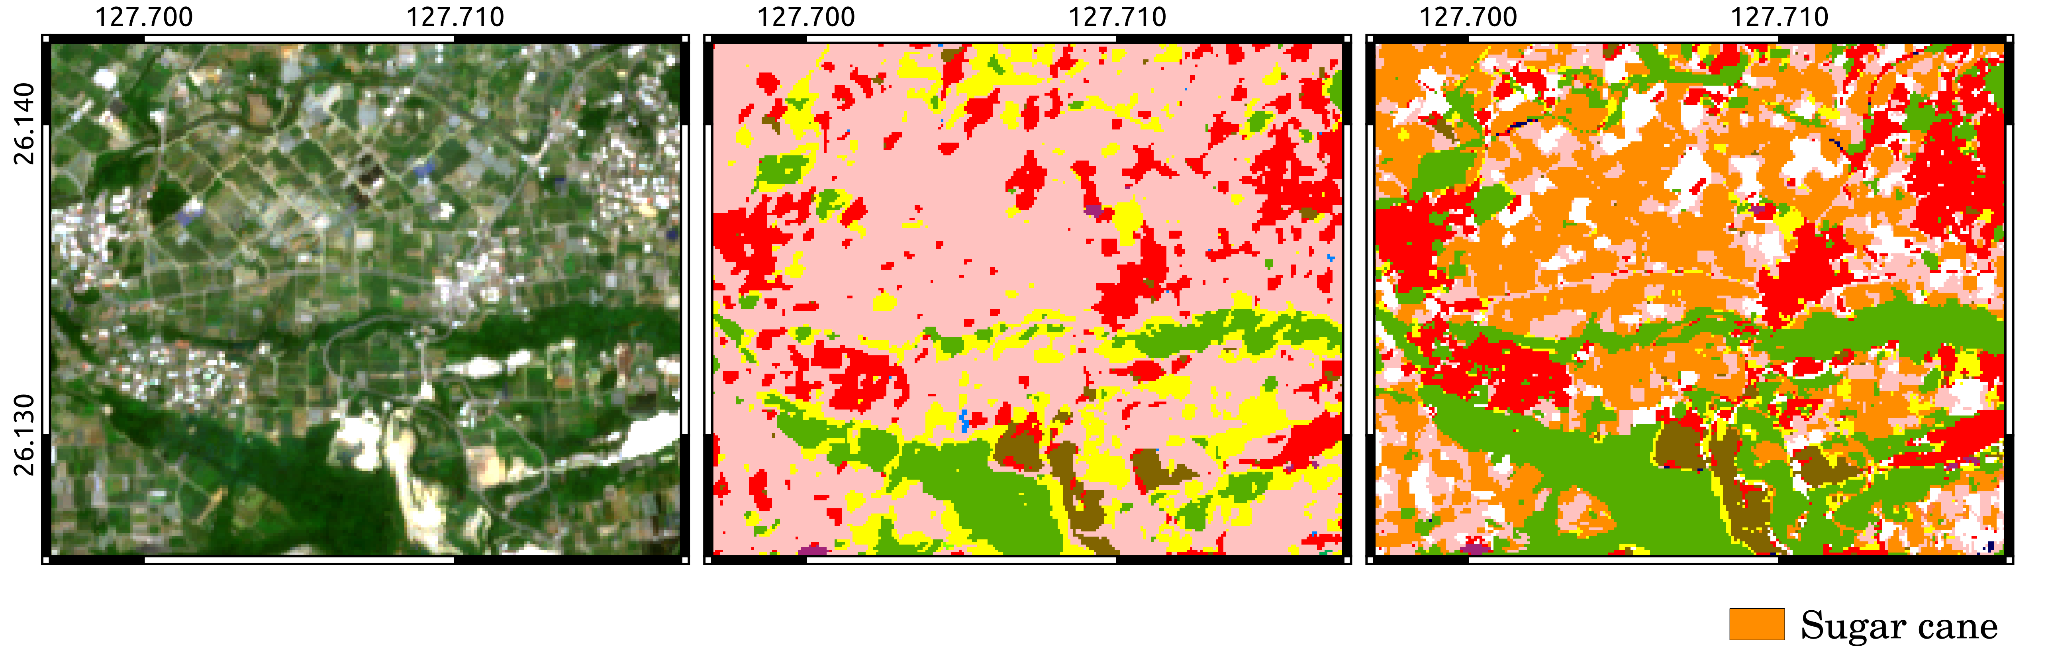
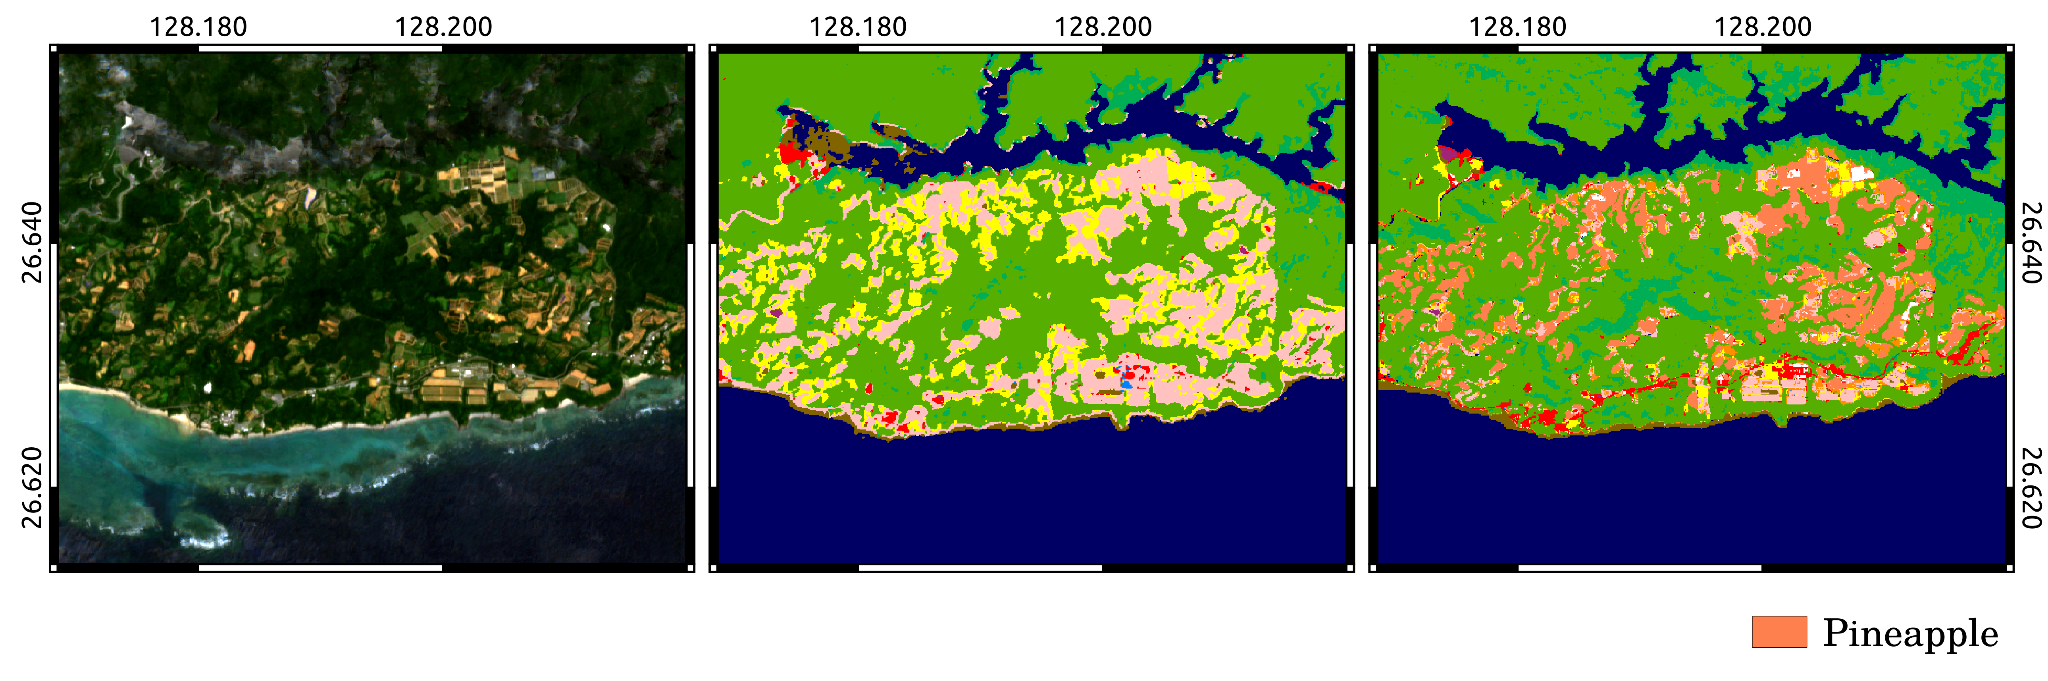
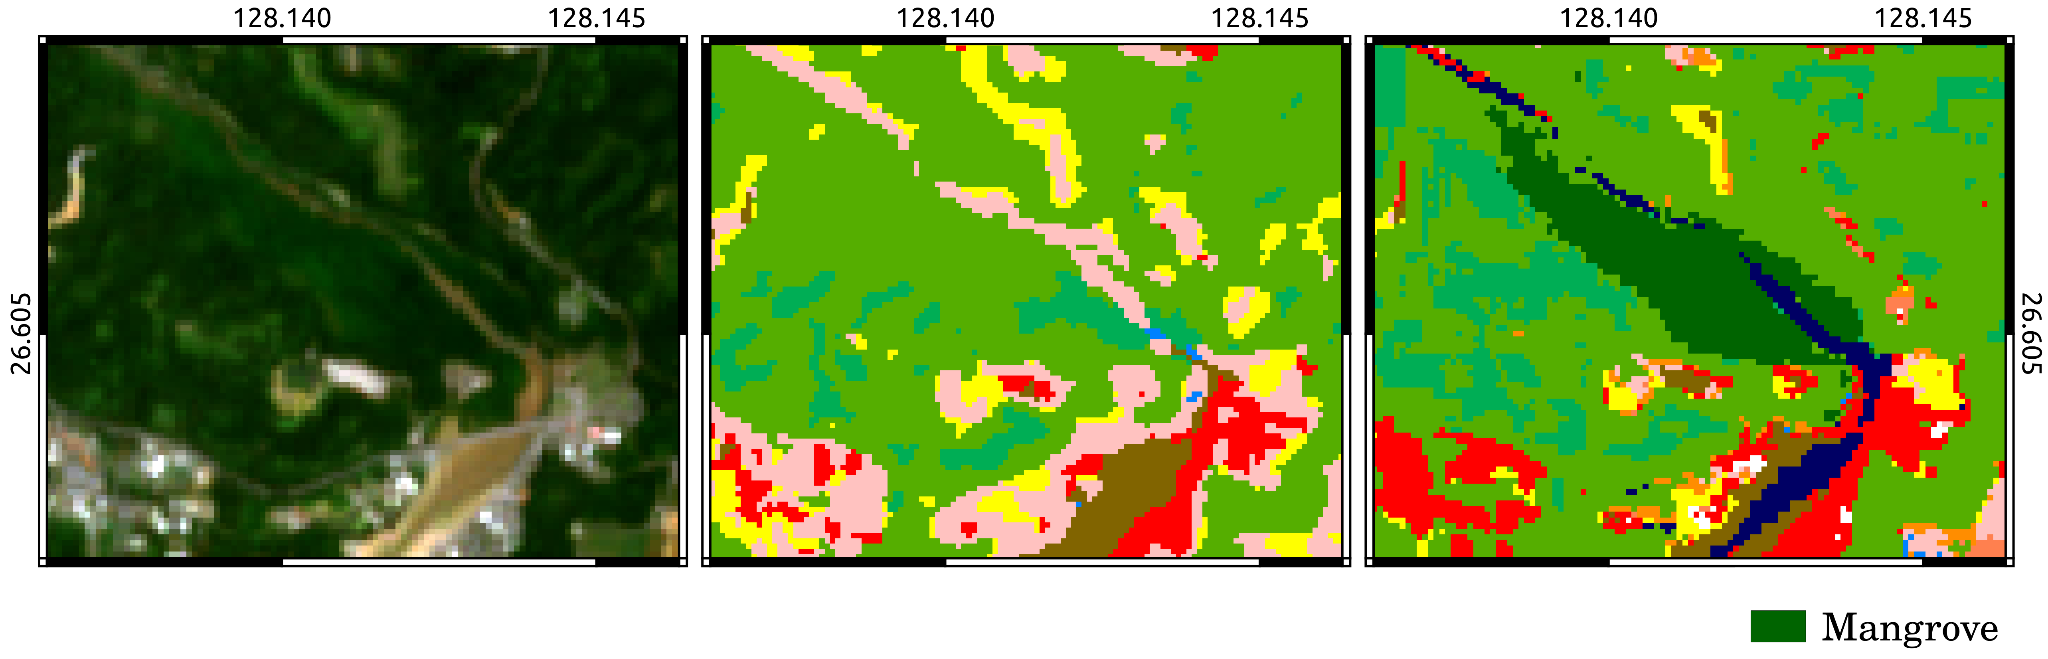
Figure 1 shows an overview of High-Resolution Land-Use and Land-Cover Map of Okinawa v23.01, and Figures 2 to 5 show examples of comparison between the RGB image (Sentinel-2) and High-Resolution Land-Use and Land-Cover Map of Japan v21.11. By optimizing the classification system to Okinawa Island, the land use land cover of Okinawa Island can be more detailed.
6. References
- Izumisama H., Hirayama S., Mizukami Y., Nasahara K.N. (2023) Creation of a High-Resolution Land Use and Land Cover Map for Okinawa Island by Integrated Localization. Journal of The Remote Sensing Society of Japan 43(2), pp. 73-85
- Sota Hirayama, Takeo Tadono, Masato Ohki, Yousei Mizukami, Kenlo Nishida Nasahara, Koichi Imamura, Naoyoshi Hirade, Fumi Ohgushi, Masanori Dotsu, and Tsutomu Yamanokuchi: Generation of High-Resolution Land Use and Land Cover Maps in JAPAN Version 21.11. Journal of The Remote Sensing Society of Japan Vol. 42 No. 3 pp. 199-216, 2022
- Brown, C.F., Brumby, S.P., Guzder-Williams, B. et al. Dynamic World, Near real-time global 10 m land use land cover mapping. Scientific Data 9, 251, 2022, doi:10.1038/s41597-022-01307-4
- Haruka Izumisawa, Sota Hirayama, Yousei Mizukami, and Kenlo Nasahara: Improving the accuracy of land cover map of Okinawa Main Island using ancillary data, Proceeding of the 73rd conference of the remote sensing society of Japan, pp. 13-16, 2022