Dataset
High-Resolution Land-Use and Land-Cover Map of Japan [2014 ∼ 2016]
(Released in March 2018 / Version 18.03)
Download product
User registration is required to download the data. Please click here about download and user registration details.
1. Summary
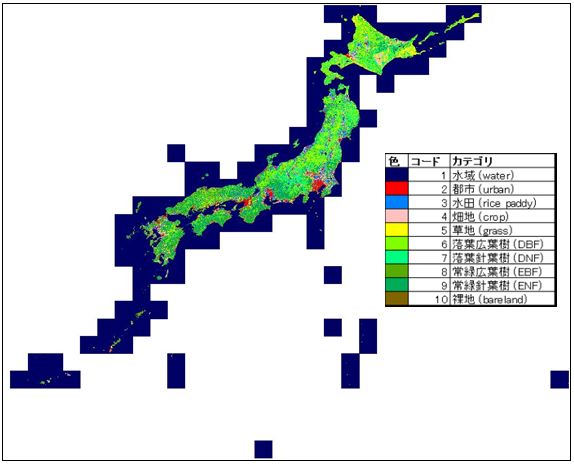
Japan Aerospace eXploration Agency (JAXA) Earth Observation Research Center (EORC) created the land cover classification map of entire Japan area ((excluding some isolated islands) to grasp the latest information of Land cover based on the classification algorism developed in ALOS / AVNIR-2 High Resolution Land-Use Land-Cover map. Aims of this product is to utilize it as fundamental information of various applications such as research materials of vegetation survey, forest management, landslide investigation, ecological research and so on.
The input data for classification is Landsat-8 surface reflectance data (collection-1) distributed by USGS. In addition, continuity was ensured by setting the classification category to the same as the items in the ALOS / AVNIR-2 HRLULC map. Furthermore, this product is planned to expand use to land cover classification map by GCOM-C which launched in December 2017 and currently under operation.
The version 18.03 released this time was targeted for a different period from the previous version v 16.09. In other words, the previous version (v16.09) represented the land cover around 2008 (2006 to 2011), but this version is intended for land cover around 2015 (2014 to 2016) about seven years later. In order to correspond to the new target period, input data different from the previous version was used. Accordingly, the following changes and improvements were made.
- Support for Landsat-8 satellite data input
- Apply cloud mask.
- Apply topographic correction (C-correction). Because topographic correction has already applied to AVNIR-2HLP, but there is no corresponding product in Landsat-8 Collection-1 data.
- Perform visual re-filtering of training data and reference data.
- As a result, overall accuracy by confusion matrix was 81.6%.
2. Data used for creating the map
- Data 1: Landsat-8 OLI (Collection-1), 4,257 scenes.
- Data 2: 10m spacing digital elevation data created by Geospatial Information Authority of Japan.
- Data 3: Raster map of surface slope data calculated by Data 2.
- Data 4: Global 25m resolutions ALOS-2 / PALSAR-2 mosaic dataset in 2015.
- Data 5: Suomi NPP nightlight satellite image (500m pixel spacing).
- Data 6: The map of distances from roads( Roadmap © OpenStreetMap Contributors).
- Data 7: Information on training data from SACLAJ database (Ground survey and interpretation of satellite data on the Internet), 35,000 points.
- Data 8: Information on the presence or absence of paddy rice cultivation for each municipality in Hokkaido (Statistics by municipality related to agriculture, Ministry of Agriculture, FY2014).
- Data 9: Sea mask information included in the Digital Surface Model (DSM) product created from ALOS PRISM data.
3. Classification algorithm
After applying topographic correction to Landsat-8 OLI data using Data 1 and Data 2, classification were done by post-classification editing which integrated below,
- Bayesian classifier with Kernel Density Estimation (KDE) using Data 1 and Data 9 (Hashimoto et al., 2014)
- Spatial distribution of topographic shadow on ALOS AVNIR-2 observation using Data 2.
- Prior probability estimation with KDE using Data 3–7.
- Prior probability estimation map using Data 7–9.
4. Data format
- Coordinate system: Latitude and longitude coordinate system with ITRF-94 on GRS-80 ellipsoid.
- Tile unit: 1 degree x 1 degree, (4,000 pixels x 4,000 lines)
- Mesh size: (1 / 4,000) degree × (1 / 4,000) degree (corresponding to approximate 30 m × 30 m)
- File naming convention: For example, LC_N45E142.tif indicates 45 to 46 degrees north latitude and 142 to 143 degrees east longitude.
- Format: GeoTIFF format
- Period of coverage: From year 2014 to 2016. It represents the average situation, not the specific point in time.
The value of each pixel is the ID number of the category for classification as follows:
- #0: Unclassified
- #1: Water bodies
- #2: Built-up
- #3: Paddy field
- #4: Cropland
- #5: Grassland
- #6: DBF (deciduous broad-leaved forest)
- #7: DNF (deciduous needle-leaved forest)
- #8: EBF (evergreen broad-leaved forest)
- #9: ENF (evergreen needle-leaved forest)
- #10: Bare
- #255: No data
5. Accuracy verification
As a result of accuracy verification of this data (v18.03) using 3,000 points of reference data independently obtained from the SACLAJ database separately from the training data, the overall accuracy was 81.6% and the kappa coefficient was 0.8 for 10 classification categories (see Table 1; Note 1).
| Validation | User's accuracy (%) |
||||||||||||
|---|---|---|---|---|---|---|---|---|---|---|---|---|---|
| 1 | 2 | 3 | 4 | 5 | 6 | 7 | 8 | 9 | 10 | TOTAL | |||
| Classified | 1 | 276 | 1 | 1 | 0 | 0 | 0 | 0 | 1 | 3 | 0 | 282 | 97.9 |
| 2 | 3 | 247 | 2 | 7 | 1 | 0 | 0 | 0 | 0 | 35 | 295 | 83.7 | |
| 3 | 0 | 5 | 284 | 5 | 1 | 1 | 1 | 0 | 0 | 1 | 298 | 95.3 | |
| 4 | 1 | 3 | 31 | 218 | 26 | 4 | 3 | 1 | 1 | 6 | 294 | 74.1 | |
| 5 | 0 | 2 | 6 | 14 | 240 | 14 | 0 | 8 | 0 | 5 | 289 | 83.0 | |
| 6 | 0 | 0 | 0 | 0 | 9 | 236 | 29 | 13 | 11 | 0 | 298 | 79.2 | |
| 7 | 0 | 0 | 0 | 1 | 4 | 24 | 252 | 4 | 14 | 0 | 299 | 78.6 | |
| 8 | 0 | 1 | 0 | 1 | 2 | 15 | 7 | 207 | 49 | 0 | 282 | 73.4 | |
| 9 | 0 | 0 | 0 | 0 | 1 | 6 | 4 | 24 | 264 | 0 | 299 | 88.3 | |
| 10 | 15 | 43 | 6 | 14 | 23 | 8 | 3 | 6 | 7 | 161 | 286 | 56.3 | |
| TOTAL | 295 | 302 | 330 | 260 | 307 | 308 | 299 | 264 | 349 | 208 | 2,922 | --- | |
| Producer's accuracy (%) |
93.6 | 81.8 | 86.1 | 83.8 | 78.2 | 76.6 | 84.3 | 78.4 | 75.6 | 77.4 | --- | Overall accuracy: 81.6% |
|
As reference information, the accuracy verification result of the previous version (v16.09) are shown in the confusion matrix below (see Table 2; Note 1).
| Validation | User's accuracy (%) |
||||||||||||
|---|---|---|---|---|---|---|---|---|---|---|---|---|---|
| 1 | 2 | 3 | 4 | 5 | 6 | 7 | 8 | 9 | 10 | TOTAL | |||
| Classified | 1 | 193 | 1 | 1 | 0 | 0 | 0 | 0 | 0 | 0 | 2 | 197 | 98.0 |
| 2 | 2 | 222 | 2 | 1 | 0 | 0 | 0 | 0 | 0 | 2 | 229 | 96.9 | |
| 3 | 1 | 2 | 260 | 18 | 6 | 2 | 0 | 1 | 0 | 1 | 291 | 89.3 | |
| 4 | 1 | 2 | 28 | 76 | 41 | 4 | 1 | 9 | 1 | 5 | 168 | 45.2 | |
| 5 | 0 | 0 | 10 | 14 | 42 | 4 | 2 | 8 | 0 | 1 | 81 | 51.9 | |
| 6 | 0 | 1 | 2 | 8 | 5 | 74 | 13 | 15 | 13 | 0 | 131 | 56.5 | |
| 7 | 0 | 0 | 0 | 0 | 1 | 1 | 11 | 0 | 1 | 0 | 14 | 78.6 | |
| 8 | 0 | 0 | 0 | 0 | 1 | 5 | 1 | 32 | 16 | 0 | 55 | 58.2 | |
| 9 | 1 | 0 | 0 | 1 | 0 | 11 | 4 | 30 | 167 | 0 | 214 | 78.0 | |
| 10 | 0 | 2 | 1 | 1 | 3 | 0 | 0 | 0 | 0 | 22 | 29 | 75.9 | |
| TOTAL | 198 | 230 | 304 | 119 | 99 | 101 | 32 | 95 | 198 | 33 | 1,409 | --- | |
| Producer's accuracy (%) |
97.5 | 96.5 | 85.5 | 63.9 | 42.4 | 73.3 | 34.4 | 33.7 | 84.3 | 66.7 | --- | Overall accuracy: 78.0% |
|
Next, figures 1 - 3 show an example of HRLULC map v18.03
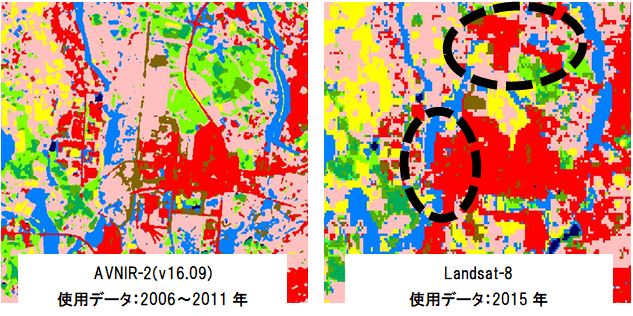
Left: v16.09 (by AVNIR-2), Right: v18.03 (by Landsat-8 OLI).
The progress of development accompanying the opening of the Tsukuba Express railway were confirmed from the time series analysis results.
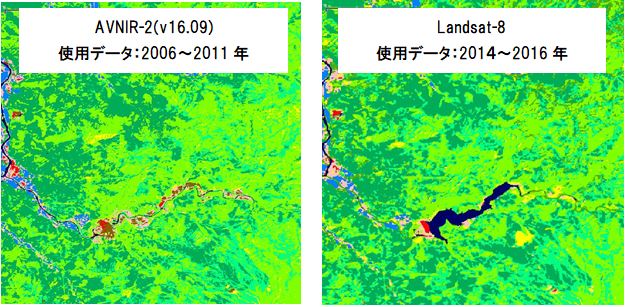
Left: v16.09 (by AVNIR-2), Right: v18.03 (by Landsat-8 OLI).
The state of before and after the completion of Moriyoshisan dam (2011) can be confirmed from the time series analysis result.
6. References
- "A New Method to Derive Precise Land-use and Land-cover Maps Using Multi-temporal Optical Data", Shutaro Hashimoto, Takeo Tadono, Masahiko Onosato, Masahiro Hori and Kei Shiomi (2014) Journal of The Remote Sensing Sociery of Japan, 34 (2), 102-112.
- "Development of "SACLAJ" a multi-temporal ground truth dataset of land cover", K. Kobayashi, K. Nasahara, T. Tadono, F. Ohgushi, M. Dotsu, R. Dan, proceedings of 61th autumn conference of the Japan Remote Sensing Society of Japan, pp.89-90. (Oral presentation).
- "Reduction of Misclassification Caused by Mountain Shadow in a High Resolution Land use and Land Cover Map Using Multi-temporal Optical Images", J. Katagi, K. Nasahara, K. Kobayashi, M. Dotsu and T. Tadono (2018), Journal of the Remote Sensing Society of Japan, 38(1), 30-34.
- Teillet, P.M. et al. (1982), On the slope-aspect correction of multispectral scanner data, Can. J. Remote Sensing 8, 84-106.
Acknowledgements
- United States Geological Survey (USGS)
- Suomi NPP VIIRS Daily Mosaic Image and Data processing by NOAA's National Geophysical Data Center.
- OpenStreetMap © OpenStreetMap contributors