Dataset
High-Resolution Land-Use and Land-Cover Map of Japan
(Released in September 2016 / Version 16.09)
Download product
User registration is required to download the data. Please click here about download and user registration details.
1. Summary
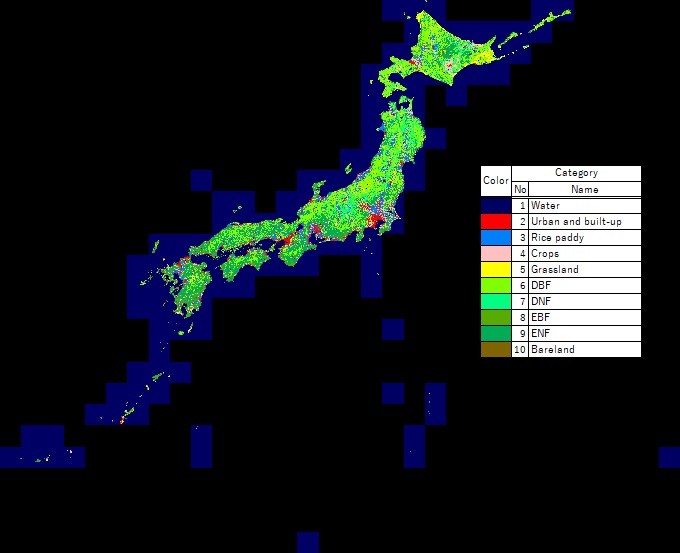
ALOS / AVNIR-2 High-Resolution Land-Use Land-Cover Map ("HRLULC Map") is a land cover classification map of entire Japan area (excluding some isolated islands). Aims of this product is to utilize it as fundamental information of various applications such as research materials of vegetation survey, forest management, landslide investigation, ecological research and so on.
The main input data is observation data of the Advanced Visible and Near Infrared Radiometer type 2 (AVNIR-2) equipped on Japanese satellite "Daichi" (ALOS) and these input data were called AVNIR-2 High Level Product (HLP) subjected to orthorectification, atmospheric correction, and topographic correction. In addition, classification categories can be tuned according to the purpose of each user by limiting it to major items.
It is expected that this approach will be extended to the land cover classification map by the Global Change Observation mission - Climate (GCOM-C) and advanced Land Observation Satellite - 3 (ALOS-3).
In version 16.09 (v16.09) released this time, the following points were improved from previous version (v16.02).
- Removal of images after the Great East Japan Earthquake (part of 55 scenes including the Tohoku region Pacific coast): see Figure 2.
- Delete misregistration image (18 scenes).
- Removal of some training data (including land cover change, mislabeled, misregistration and double counted ) (1,696 points).
2. Data used for creating the map
-
Data 1: ALOS AVNIR-2 HLP (After applying orthorectification, atmospheric correction and topographic correction), 2,791 scenes.
- Data 2: ALOS PRISM 5m spacing Digital Surface Model (DSM).
- Data 3: ALOS PALSAR 25m resolution mosaic dataset (2008).
- Data 4: 10m spacing digital elevation data created by Geospatial Information Authority of Japan and raster map of surface slope data calculated by it.
- Data 5: Suomi NPP nightlight satellite image (500m pixel spacing).
- Data 6: Raster map of distance information from the road calculated using vector data of road network, waterway network, railway network and buildings supplied by © OpenStreetMap Contributors.
- Data 7: Information on the presence or absence of paddy rice cultivation for each municipality in Hokkaido (Statistics by municipality related to agriculture, Ministry of Agriculture, FY2014).
- Data 8: Information on training data from SACLAJ database (Ground survey and interpretation of satellite data on the Internet), 18,636 points.
3. Classification algorithm
Classification were done by post-classification editing which integrated below,
- Bayesian classifier with Kernel Density Estimation (KDE) using Data 1 and Data 8 (Hashimoto et al., 2014)
- Spatial distribution of topographic shadow on ALOS AVNIR-2 observation using Data 2.
- Prior probability estimation with KDE using Data 3–8.
4. Data format
- Coordinate system: Latitude and longitude coordinate system with ITRF-94 on GRS-80 ellipsoid.
- Tile unit: 1 degree x 1 degree, (12,000 pixels x 12,000 lines)
- Mesh size: (1 / 12,000) degree × (1 / 12,000) degree (corresponding to approximate 10 m × 10 m)
- File naming convention: For example, LC_N45E142.tif indicates 45 to 46 degrees north latitude and 142 to 143 degrees east longitude.
- Format: GeoTIFF format
- Period of coverage: From year 2006 to 2011, except for the impact of the Great East Japan Earthquake. It represents the average situation, not the specific point in time.
The value of each pixel is the ID number of the category for classification as follows:
- #0: Unclassified
- #1: Water bodies
- #2: Built-up
- #3: Paddy field
- #4: Cropland
- #5: Grassland
- #6: DBF (deciduous broad-leaved forest)
- #7: DNF (deciduous needle-leaved forest)
- #8: EBF (evergreen broad-leaved forest)
- #9: ENF (evergreen needle-leaved forest)
- #10: Bare
- #253: Other
- #255: No data
5. Accuracy verification
| Classified | Producer's accuracy (%) |
||||||||||||
|---|---|---|---|---|---|---|---|---|---|---|---|---|---|
| 1 | 2 | 3 | 4 | 5 | 6 | 7 | 8 | 9 | 10 | TOTAL | |||
| Validation | 1 | 193 | 1 | 1 | 0 | 0 | 0 | 0 | 0 | 0 | 2 | 197 | 98.0 |
| 2 | 2 | 222 | 2 | 1 | 0 | 0 | 0 | 0 | 0 | 2 | 229 | 96.9 | |
| 3 | 1 | 2 | 260 | 18 | 6 | 2 | 0 | 1 | 0 | 1 | 291 | 89.3 | |
| 4 | 1 | 2 | 28 | 76 | 41 | 4 | 1 | 9 | 1 | 5 | 168 | 45.2 | |
| 5 | 0 | 0 | 10 | 14 | 42 | 4 | 2 | 8 | 0 | 1 | 81 | 51.9 | |
| 6 | 0 | 1 | 2 | 8 | 5 | 74 | 13 | 15 | 13 | 0 | 131 | 56.5 | |
| 7 | 0 | 0 | 0 | 0 | 1 | 1 | 11 | 0 | 1 | 0 | 14 | 78.6 | |
| 8 | 0 | 0 | 0 | 0 | 1 | 5 | 1 | 32 | 16 | 0 | 55 | 58.2 | |
| 9 | 1 | 0 | 0 | 1 | 0 | 11 | 4 | 30 | 167 | 0 | 214 | 78.0 | |
| 10 | 0 | 2 | 1 | 1 | 3 | 0 | 0 | 0 | 0 | 22 | 29 | 75.9 | |
| TOTAL | 198 | 230 | 304 | 119 | 99 | 101 | 32 | 95 | 198 | 33 | 1,409 | --- | |
| User's accuracy (%) |
97.5 | 96.5 | 85.5 | 63.9 | 42.4 | 73.3 | 34.4 | 33.7 | 84.3 | 66.7 | --- | Overall accuracy: 78.0% |
|
As reference information, the accuracy verification result of the previous version (v16.02) using the same verification data are shown in the confusion matrix below (see Table 2; Note 1).
| Classified | Producer's accuracy (%) |
||||||||||||
|---|---|---|---|---|---|---|---|---|---|---|---|---|---|
| 1 | 2 | 3 | 4 | 5 | 6 | 7 | 8 | 9 | 10 | TOTAL | |||
| Validation | 1 | 193 | 2 | 1 | 0 | 0 | 0 | 0 | 0 | 0 | 1 | 197 | 98.0 |
| 2 | 2 | 221 | 2 | 1 | 0 | 0 | 0 | 0 | 0 | 3 | 229 | 96.5 | |
| 3 | 1 | 2 | 260 | 18 | 8 | 1 | 0 | 0 | 0 | 1 | 291 | 89.3 | |
| 4 | 2 | 2 | 38 | 71 | 39 | 5 | 0 | 6 | 0 | 5 | 168 | 42.3 | |
| 5 | 0 | 0 | 8 | 15 | 43 | 5 | 2 | 7 | 0 | 1 | 81 | 53.1 | |
| 6 | 0 | 1 | 2 | 6 | 8 | 65 | 19 | 17 | 13 | 0 | 131 | 49.6 | |
| 7 | 0 | 0 | 0 | 0 | 1 | 1 | 11 | 0 | 1 | 0 | 14 | 78.6 | |
| 8 | 0 | 0 | 0 | 0 | 1 | 4 | 1 | 33 | 16 | 0 | 55 | 60.0 | |
| 9 | 1 | 0 | 0 | 1 | 0 | 12 | 5 | 29 | 166 | 0 | 214 | 77.6 | |
| 10 | 0 | 4 | 1 | 1 | 2 | 0 | 0 | 0 | 0 | 21 | 29 | 72.4 | |
| TOTAL | 199 | 232 | 312 | 113 | 102 | 93 | 38 | 92 | 196 | 32 | 1,409 | --- | |
| User's accuracy (%) |
97.0 | 95.3 | 83.3 | 62.8 | 42.2 | 69.9 | 28.9 | 35.9 | 84.7 | 65.6 | --- | Overall accuracy: 76.9% |
|
Next, figures 1 and 2 show an example of HRLULC map v16.09
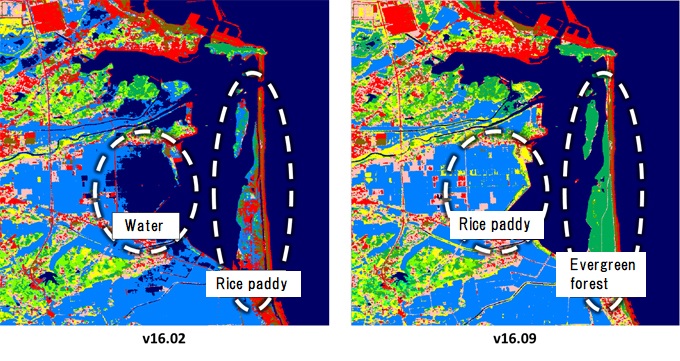
As a result of the removal of the image after the earthquake included in the input image of v16.02, misclassification due to the influence of tsunami etc. were decreased.
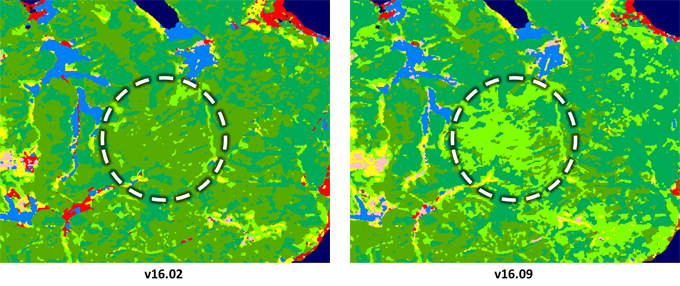
The misclassification of deciduous trees to evergreen trees was decreased.
As reference information, Figure 4 shows the optical image in the same area as in Figure 3.
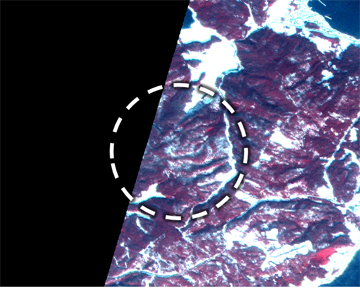
(False color composite image observed on 29, Jan., 2009)
6. References
- "A New Method to Derive Precise Land-use and Land-cover Maps Using Multi-temporal Optical Data", Shutaro Hashimoto, Takeo Tadono, Masahiko Onosato, Masahiro Hori and Kei Shiomi (2014) Journal of The Remote Sensing Sociery of Japan, 34 (2), 102-112.
- "Updates of JAXA high resolution LULC map in Japan (Version 16.09)", J. Katagi, K. Kobayashi, T. Tadono, and K. Nasahara (2016),proceedings of 61th autumn conference of the Remote Sensing Society of Japan, pp.87-88. (Oral Presentation).
- "Development of "SACLAJ" a multi-temporal ground truth dataset of land cover", K. Kobayashi, K. Nasahara, T. Tadono, F. Ohgushi, M. Dotsu, R. Dan, proceedings of 61th autumn conference of the Japan Remote Sensing Society of Japan, pp.89-90. (Oral presentation).
Acknowledgements
- Suomi NPP VIIRS Daily Mosaic Image and Data processing by NOAA's National Geophysical Data Center.
- OpenStreetMap © OpenStreetMap contributors