
ALOS-2/PALSAR-2 observation results on Hualien Earthquake, Taiwan
Posted: Feb. 16, 2018, 9:00 (UTC)
| Observed date(UTC) | Orbit number | Observation mode | Polarization | Observation direction | Beam number | |
| (1) | Feb. 8, 2018 | 32 | Stripmap 3m | HH | Left | U2-7 | (2) | Feb. 10, 2018 | 136 | Stripmap 6m | HH+HV+VH+VV | Right | FP6-3 | (3) | Feb. 11, 2018 | 27 | Stripmap 10m | HH+HV | Right | F2-7 |
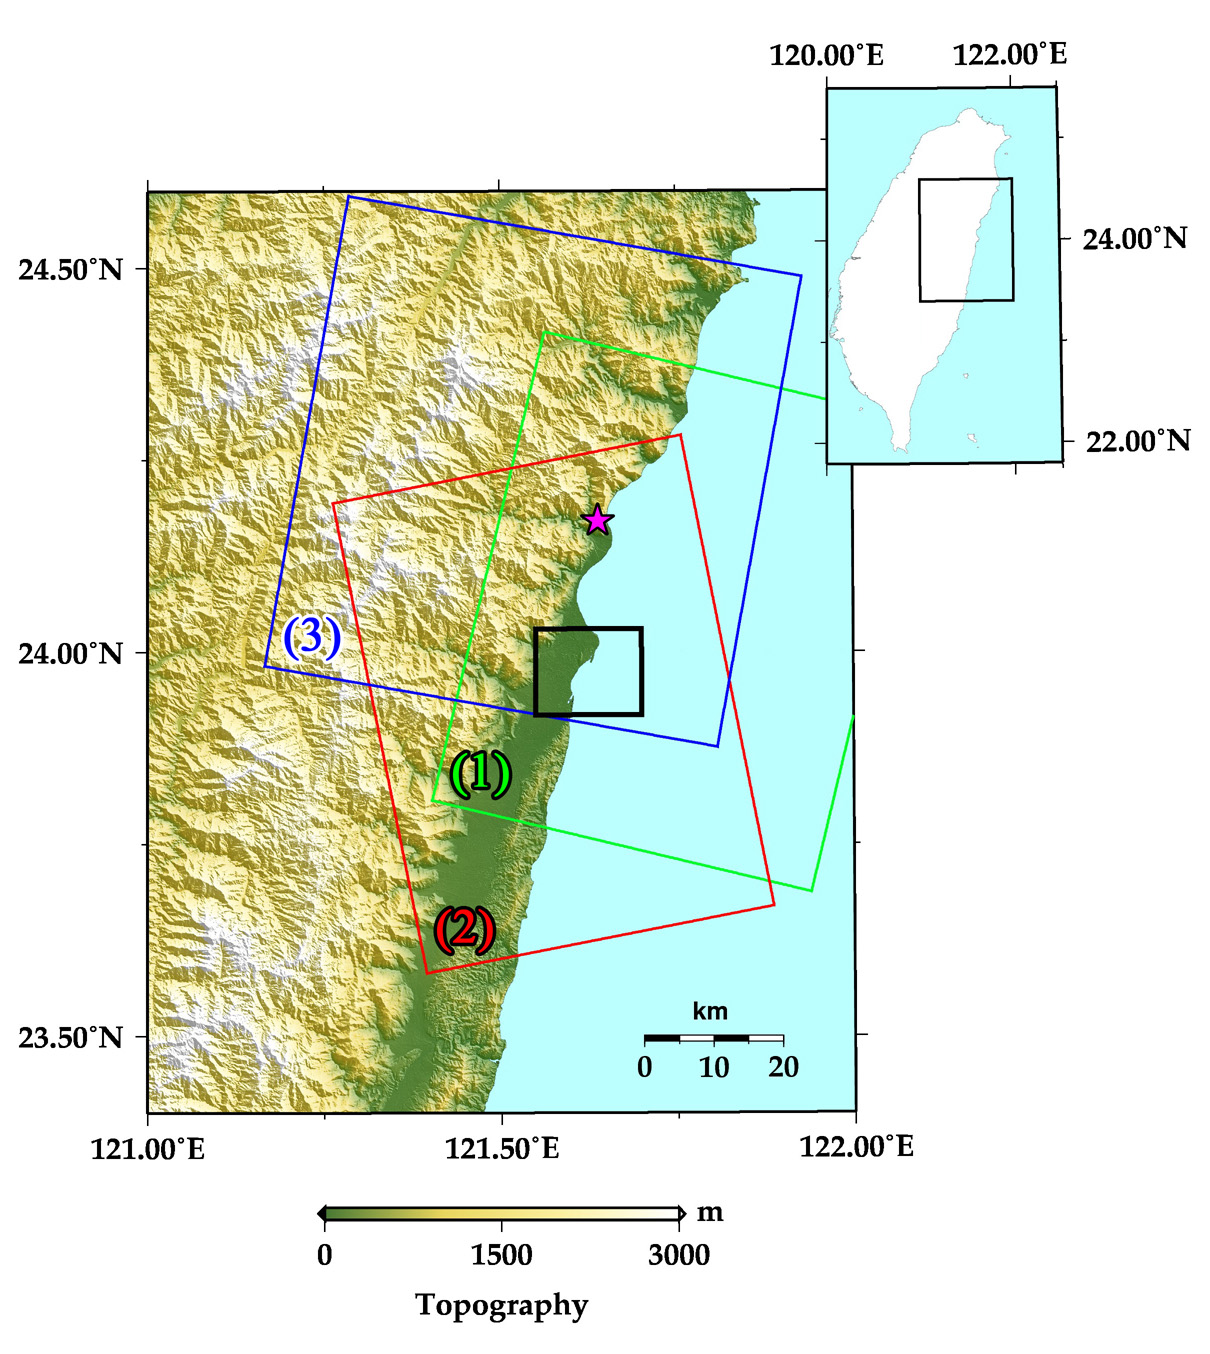 Fig. 1: An overview of the island of Taiwan (upper right panel) and a closed-up topographic map containing ALOS-2 coverages. The yellow-green, red, and blue rectangles denote the observed areas of data (1), (2), and (3) in Table 1, respectively. The black rectangle denotes the analyzed area in Figure 2 and 3, around Hualien city. A star mark is the epicenter of the earthquake.
(Click to view enlarged image)
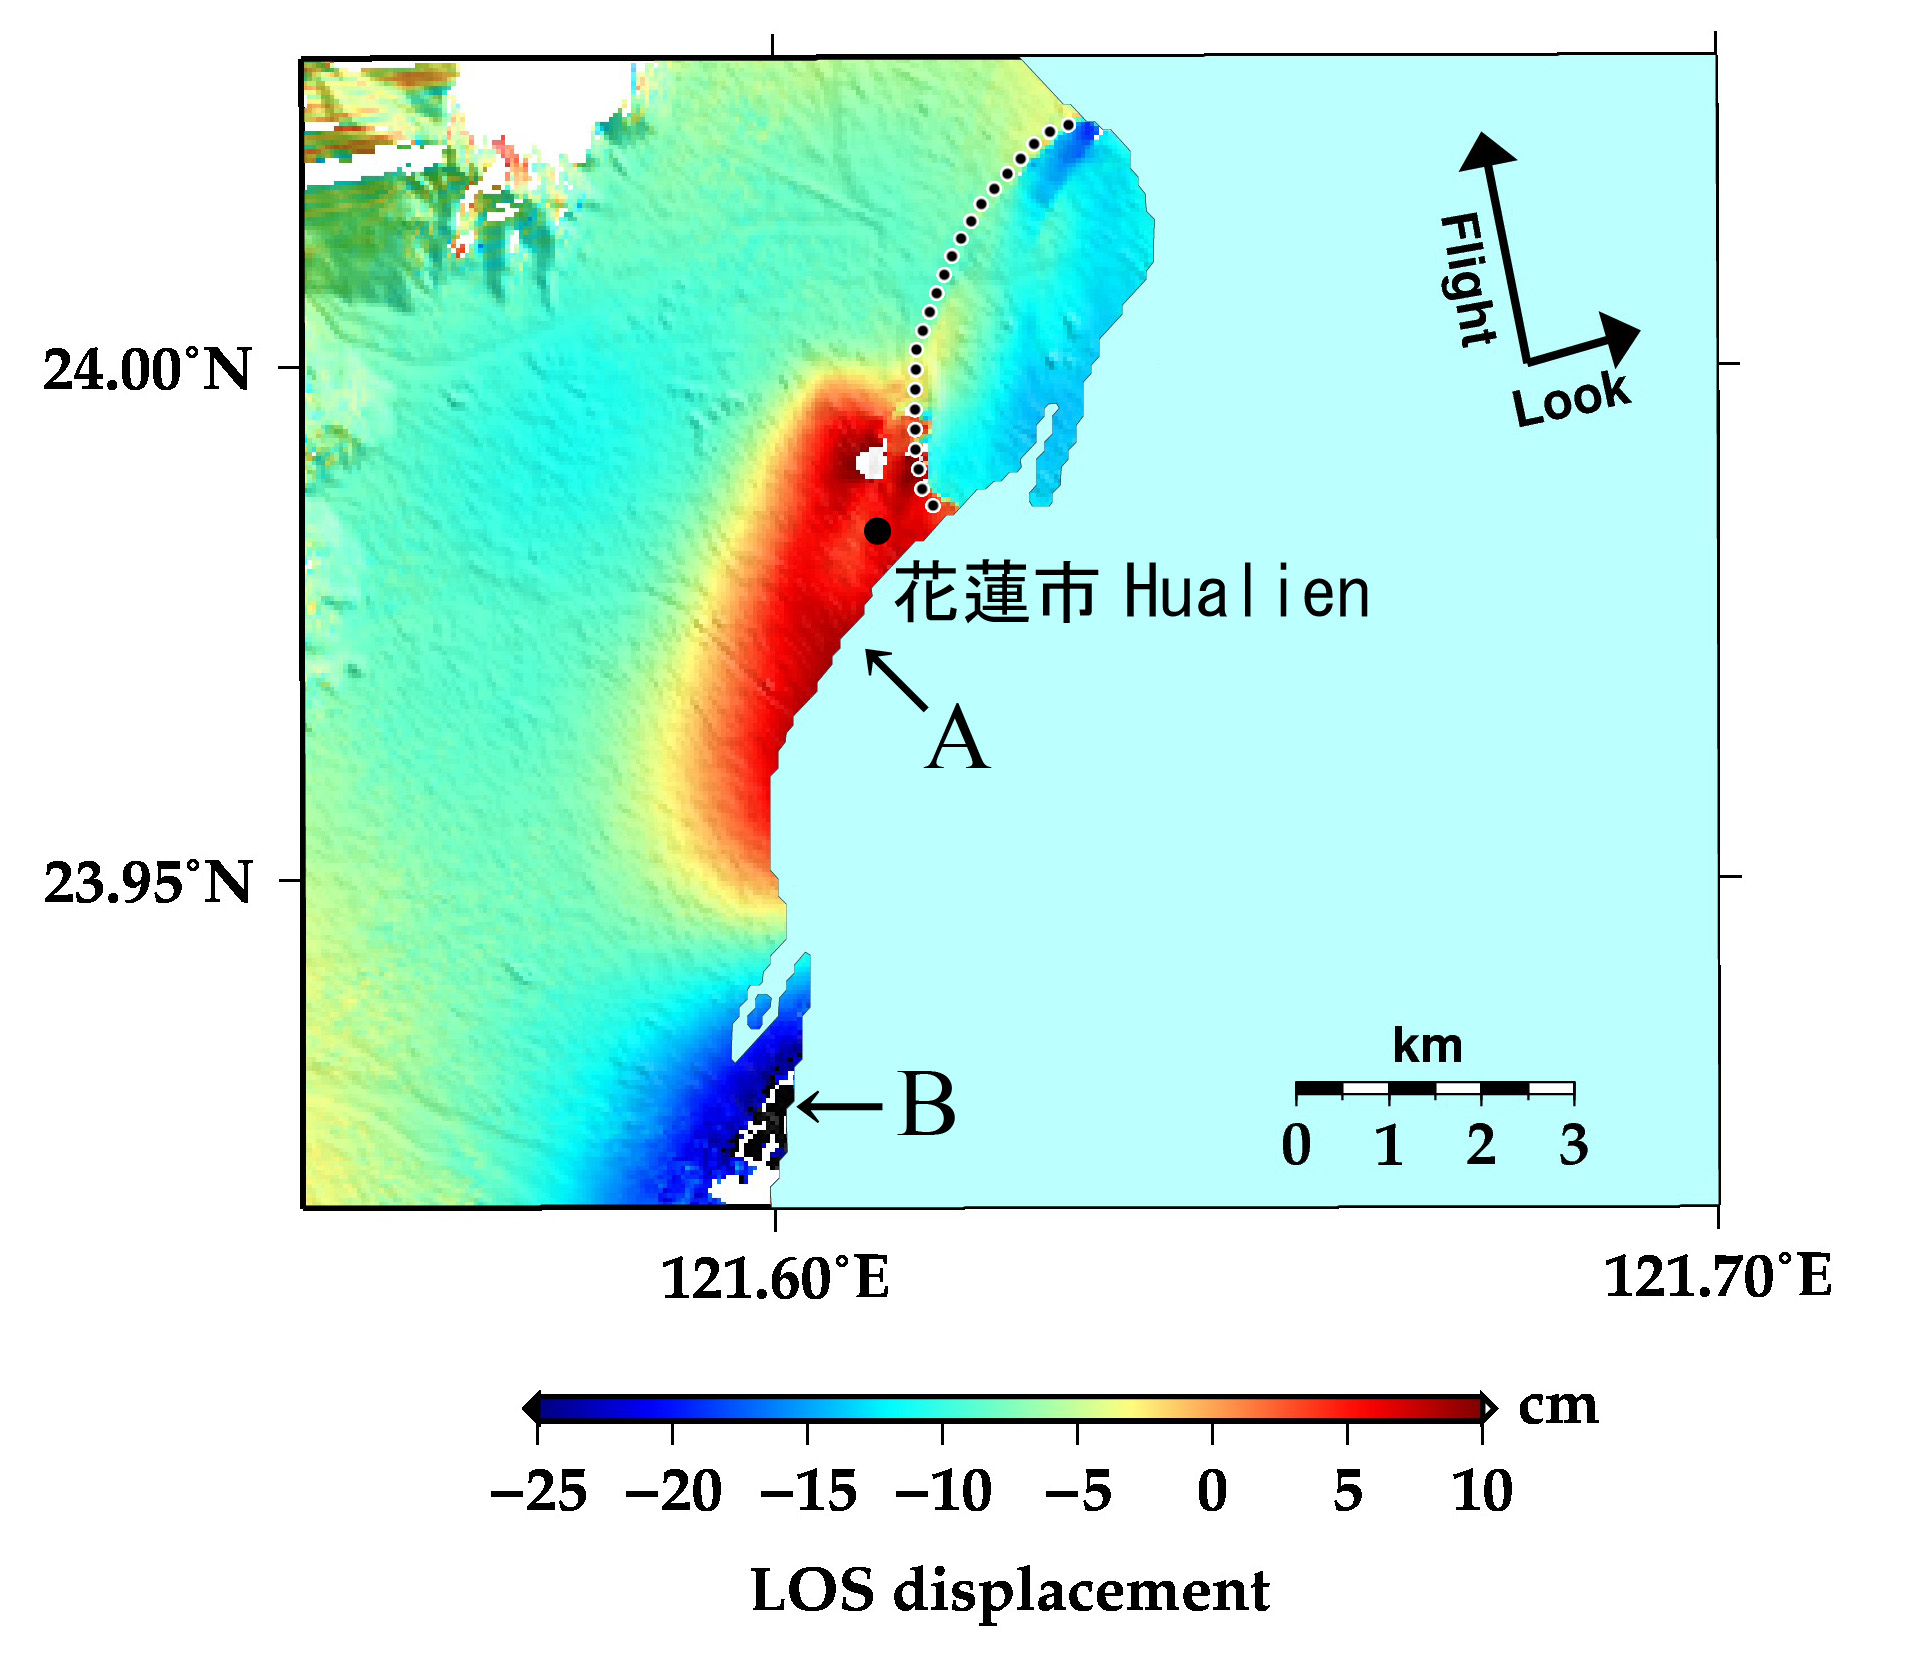 Fig. 2: An interferometric image of the ALOS-2 PALSAR-2 data acquired before (November 5, 2016) and after (February 10, 2018) the earthquake (data (2) in table1).
(Click to view enlarged image)
Figure 2 shows the interferogram using the ALOS-2 PALSAR-2 data acquired on November 5, 2016 and after February 10, 2018. This image shows ~10 cm displacement away from the satellite (subsidence or eastward movement) in area A, around Hualien city, which is 20 km away from the epicenter. There is also ~25 cm displacement toward the satellite (uplift or westward movement) detected in area B. Moreover, there is a discontinuity of surface displacement in upper part of Figure 2 (shown in a dotted line), which may correspond to surface fault along this line.
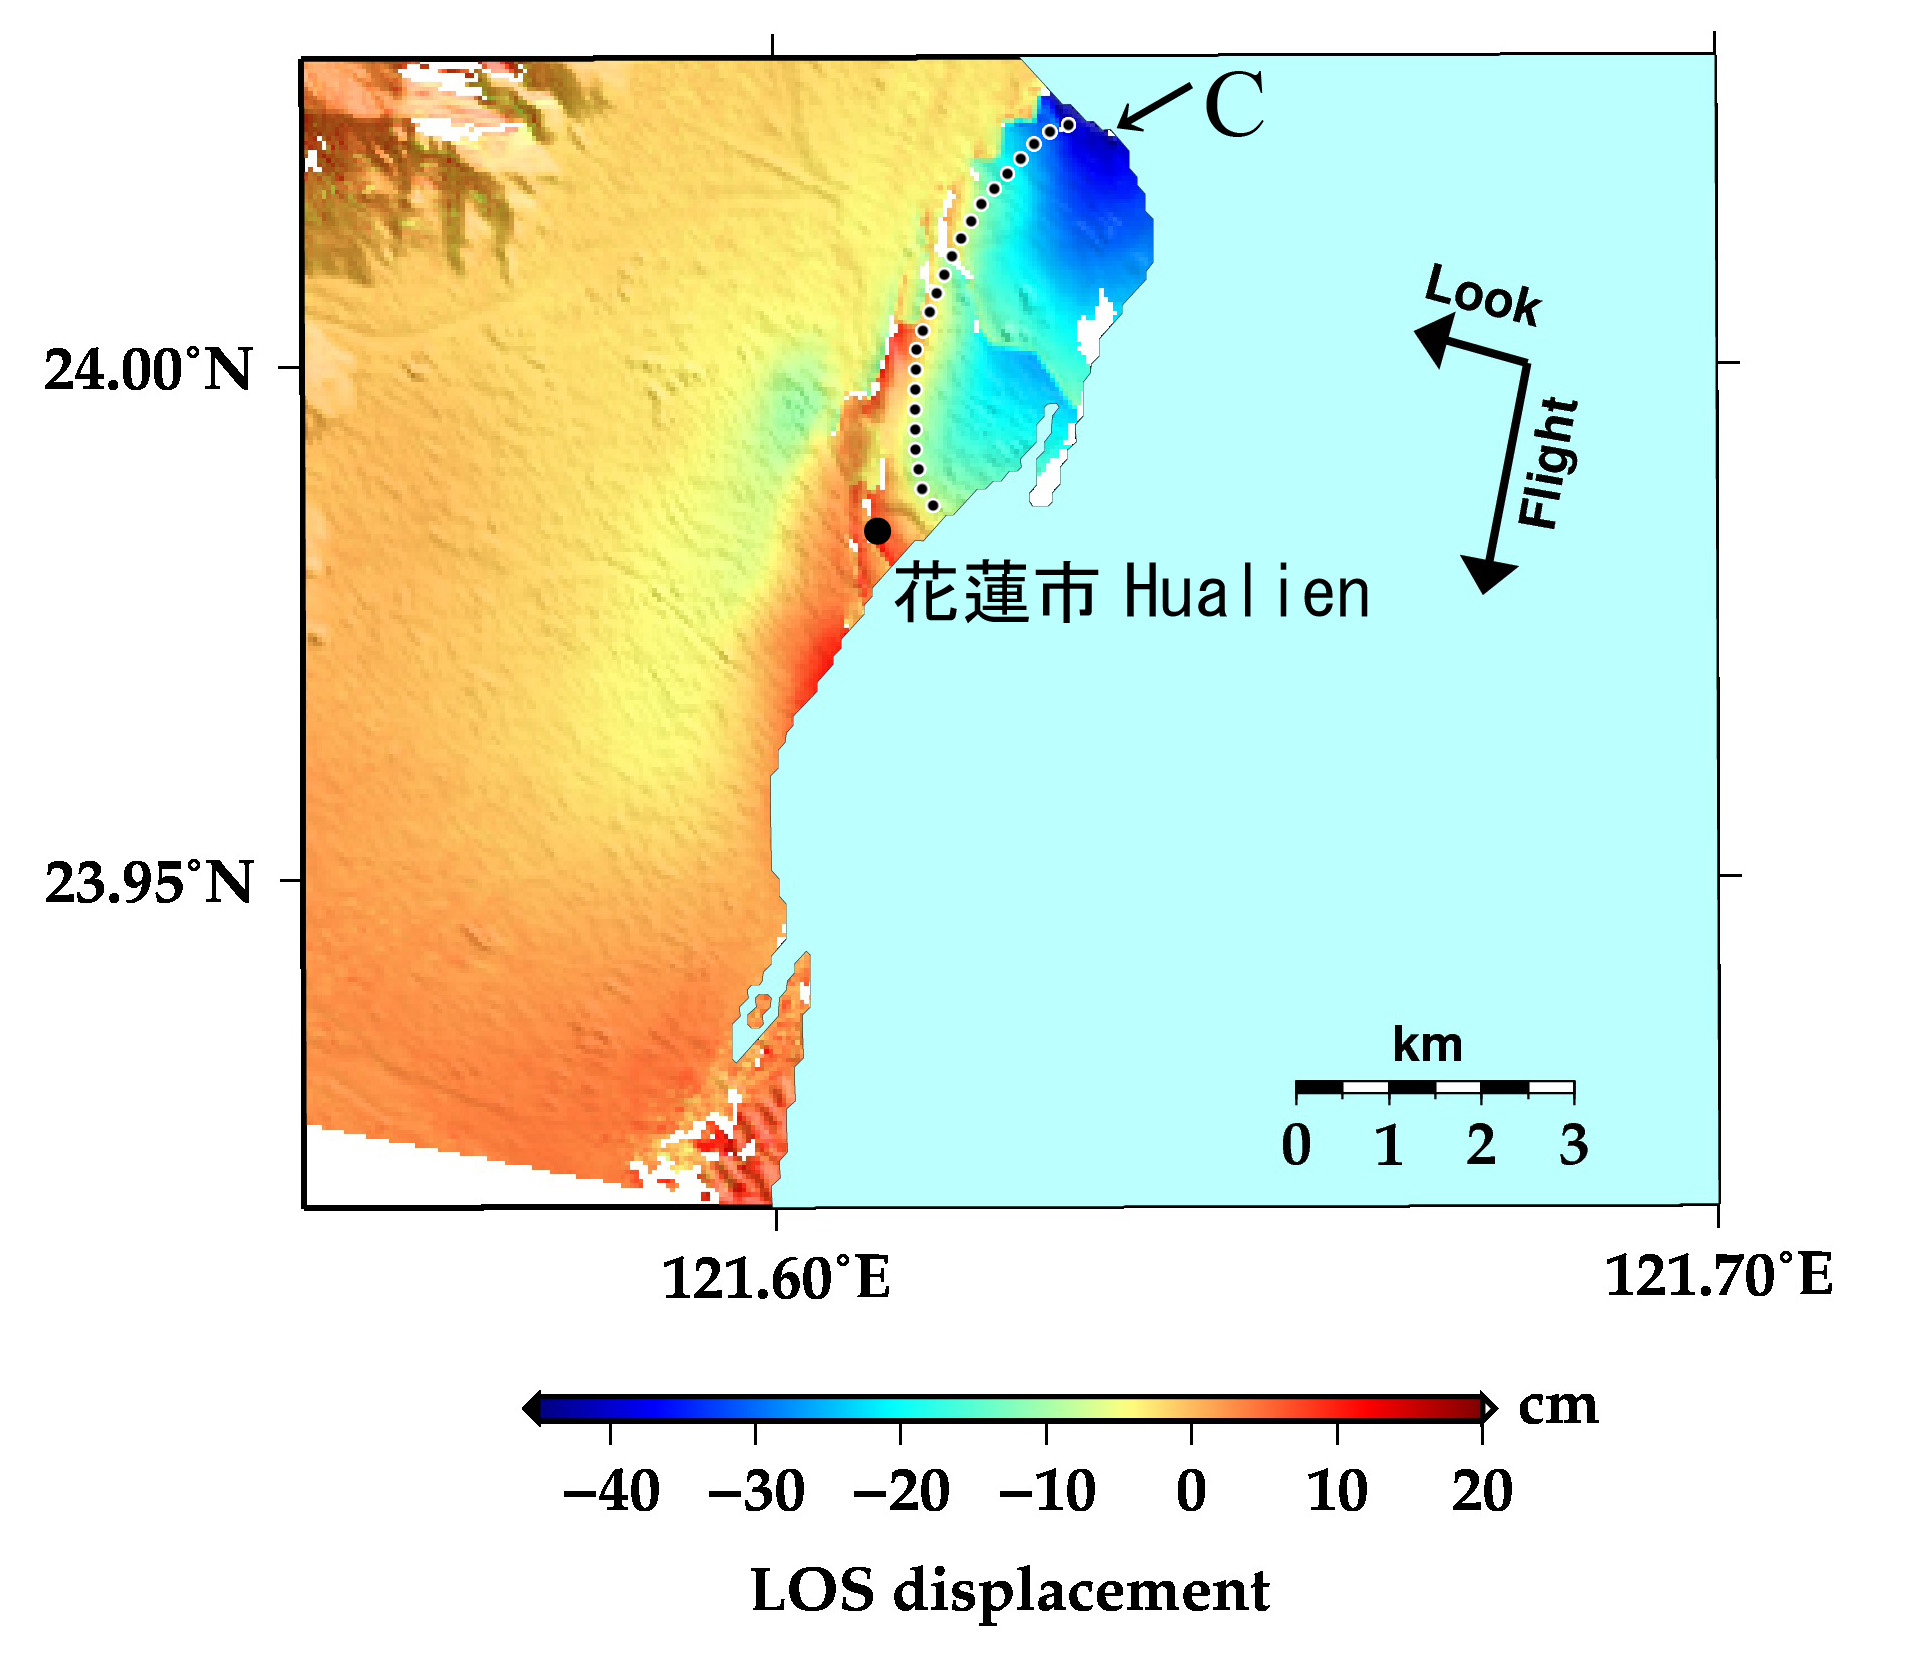 Fig. 3: An interferometric image of the ALOS-2 PALSAR-2 data acquired before (June 18, 2017) and after (February 11, 2018) the earthquake (data (3) in table1).
(Click to view enlarged image)
Figure 3 is another interferometric image using the ALOS-2 PALSAR-2 data obtained on June 18, 2016 and after February 11, 2018. This image shows ~ 40 cm displacement toward the satellite (uplift or eastward movement) in area C, and there is a discontinuity of displacement shown in a dotted line as well as that in Figure 2.
© JAXA EORC
© Copyright 1997- All Rights Reserved.