
ALOS-2 PALSAR-2 Observation Results on New Zealand
Posted: November 16, 2016, 7:30 (UTC)
On November 15, 2016 at 23:00 (UTC), an emergency observation with the Phased Array-type L-band Synthetic Aperture Radar-2 (PALSAR-2) aboard the Advanced Land Observing Satellite-2 (ALOS-2, "DAICHI-2") was performed in response to the magnitude-7.8 earthquake in New Zealand on November 13, 2016 at 1:36 (UTC). Table 1 and Figure 1 shows the observation area.
Japan Aerospace Exploration Agency (JAXA) has provided the acquired data to corresponding authorities.
| Observation date (UTC) | Path No. | Observation mode | Polarization | Direction | Beam No. |
| 2016/11/15 | 194 | ScanSAR | HH+HV | Right | W2 |
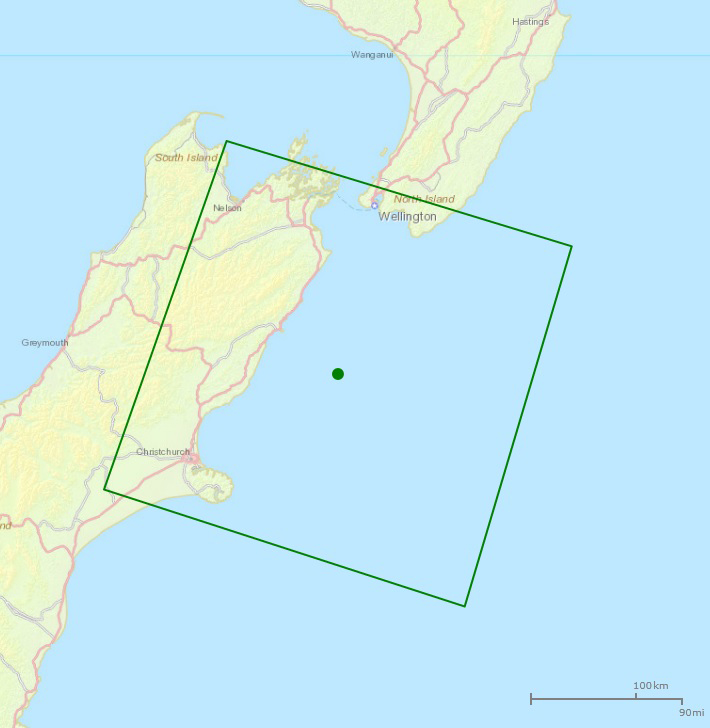 Fig.1: Area of the emergency observation.
(Click to view enlarged image)
Observation on Nov 15, 2016:
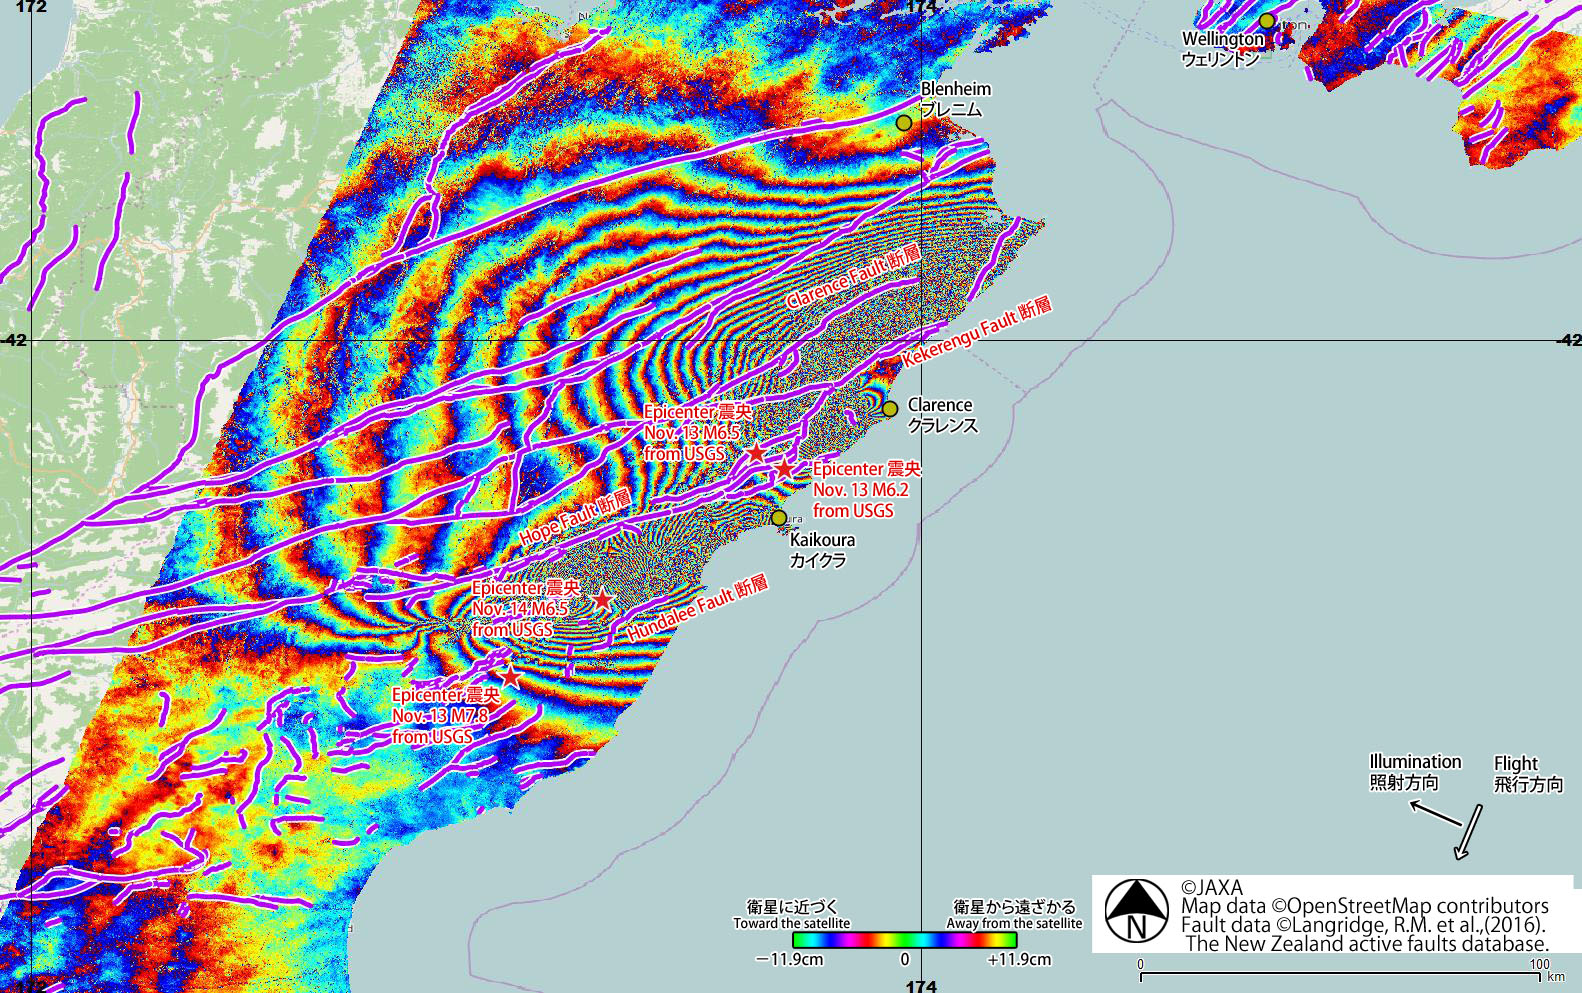
Fig. 2 shows a differential interferometry (DInSAR) result derived from the PALSAR-2 data acquired before (October 18, 2015; UTC) and after (November 15, 2016; UTC) the earthquake. Two major deformation regions were found, approx. 100 km length deformation in north west of Clarence and approx. 70 km length deformation in south west of Kaikoura. Over 3m deformation close to the satellite (eastward and / or upward movement) was detected in the west region of Clarence. The deformation should be larger in the area between Kekerengu Fault and Clarence Fault.
(Click to view enlarged image)
» KMZ File is here
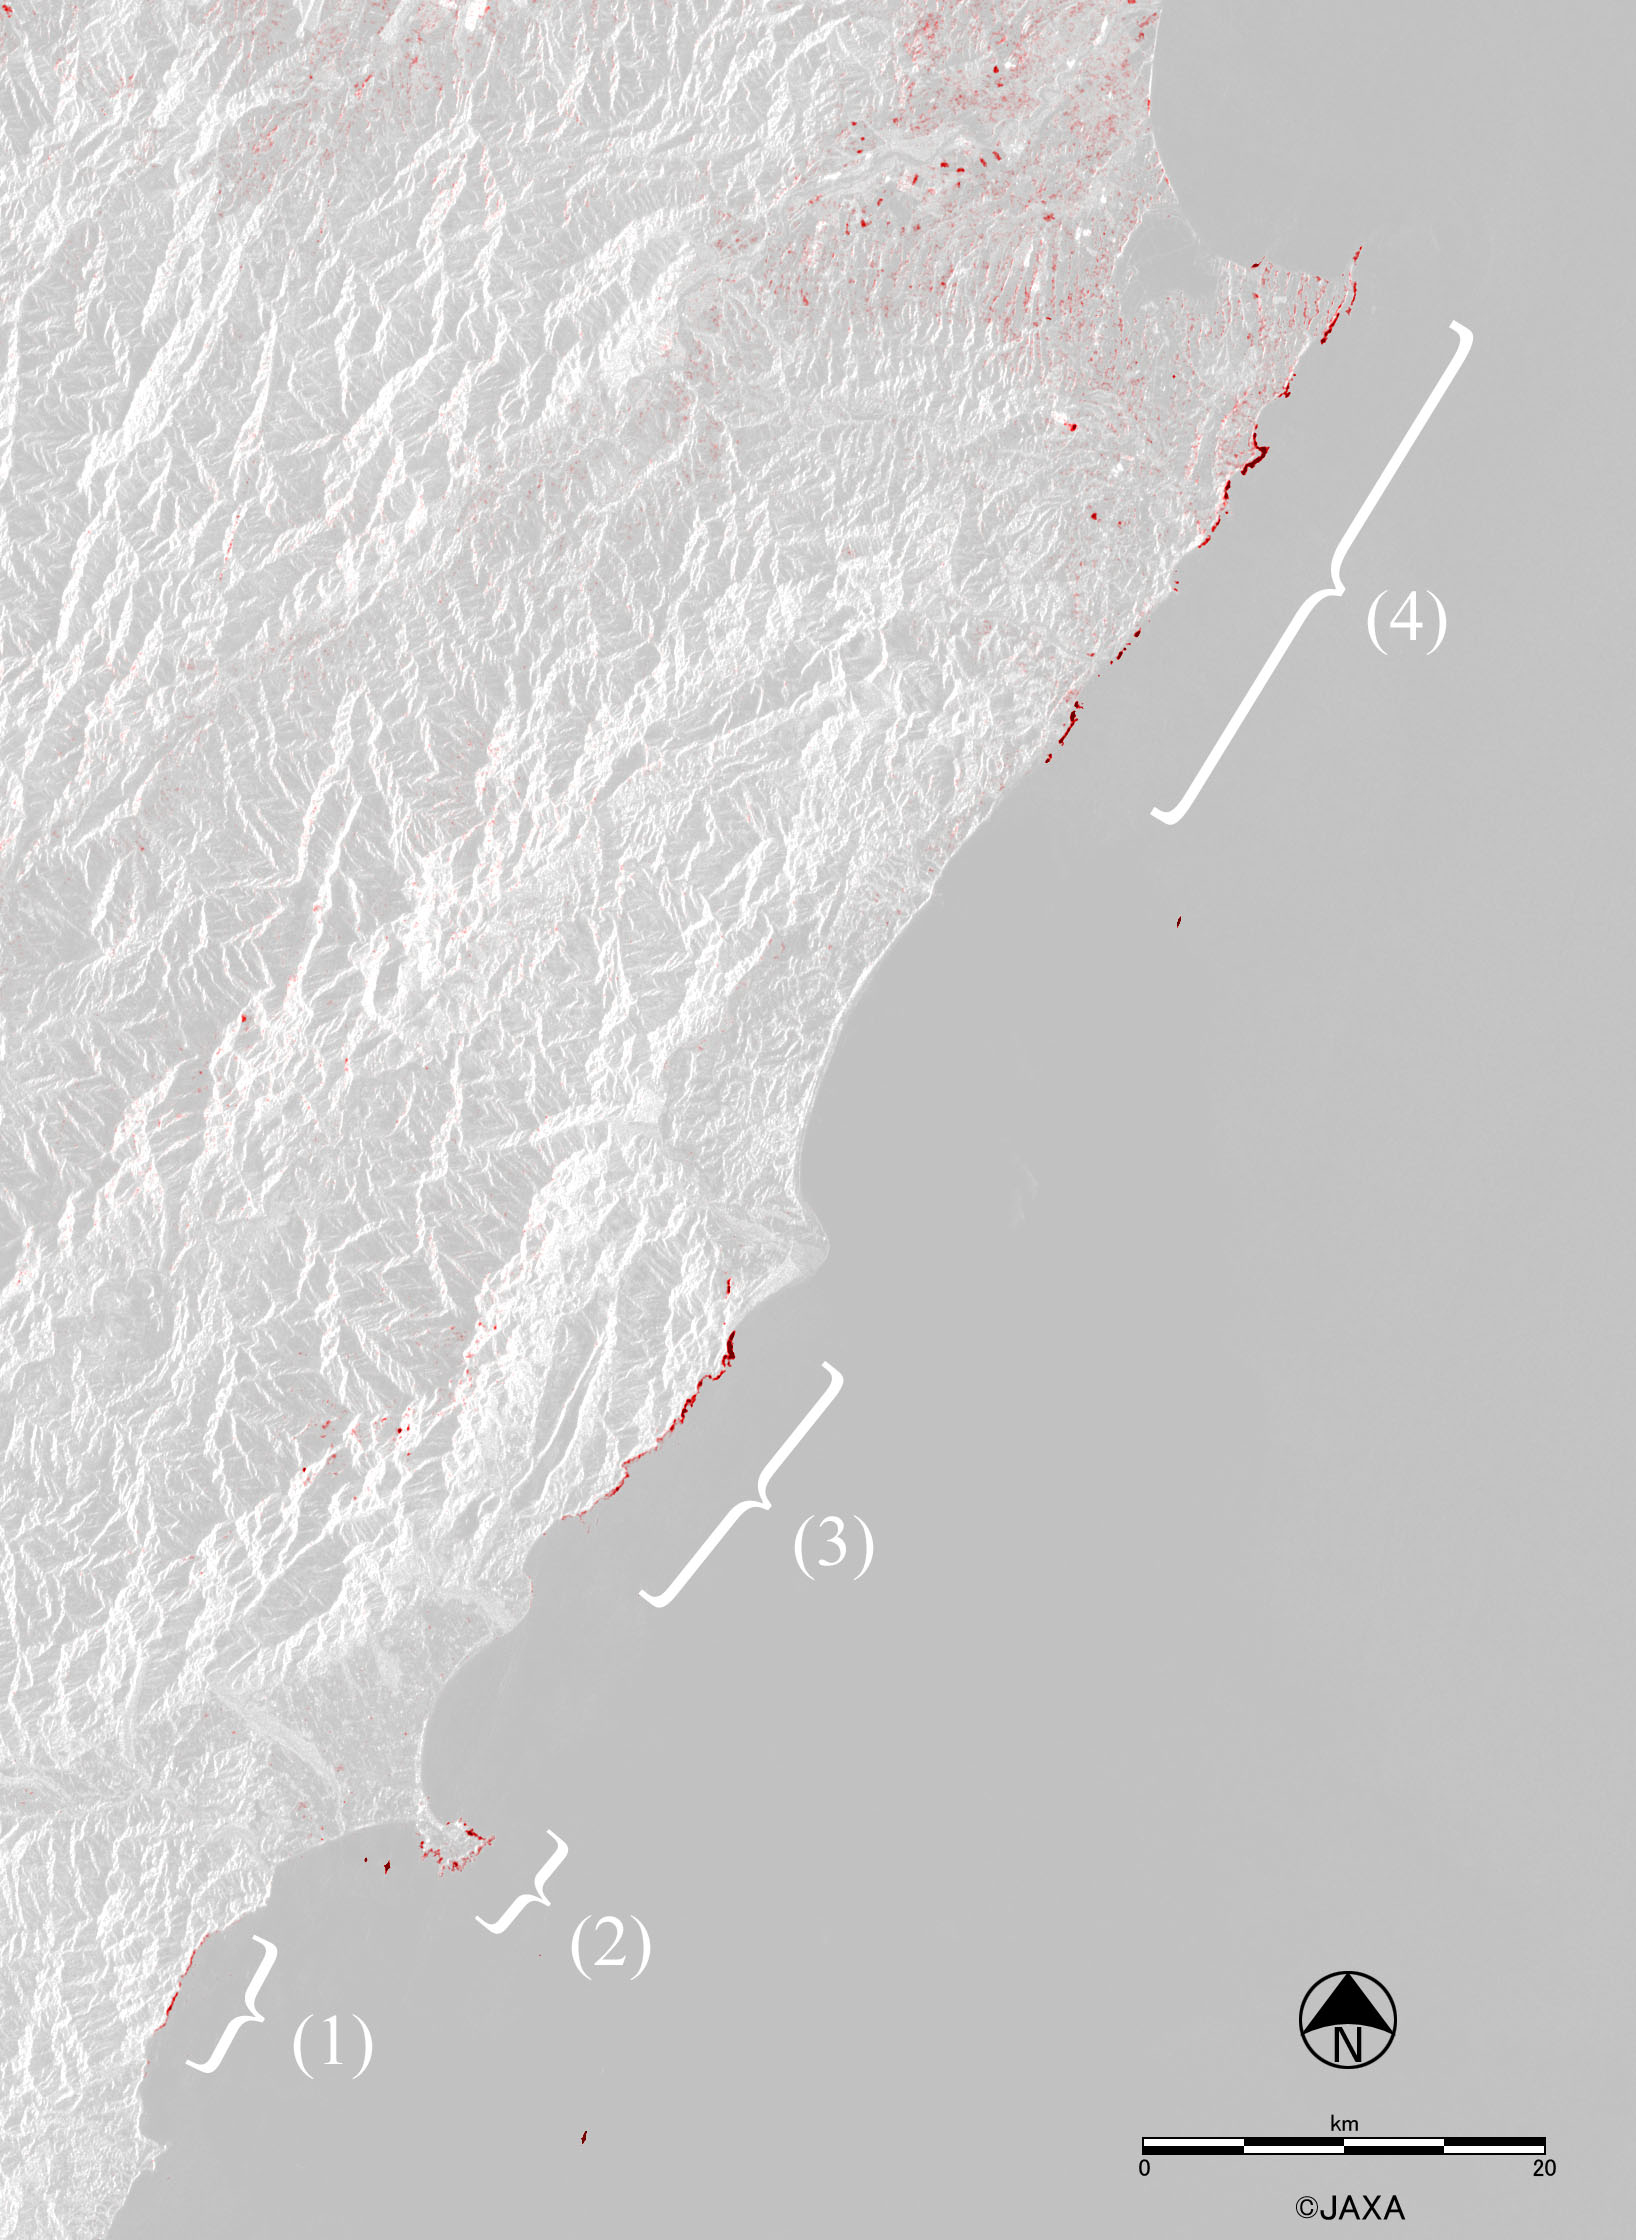
Fig. 3 shows coastal line changes detected from the same dataset on Oct.18 and Nov.15, 2016. Red colored lines represent new land areas probably appeared during the crustal deformation of the earthquake. Significant changes can be seen in marked areas with numbers in this figure: (1) Goose Bay, (2) Kaikoura, (3) Half Moon Bay and (4) Ward.
(Click to view enlarged image)
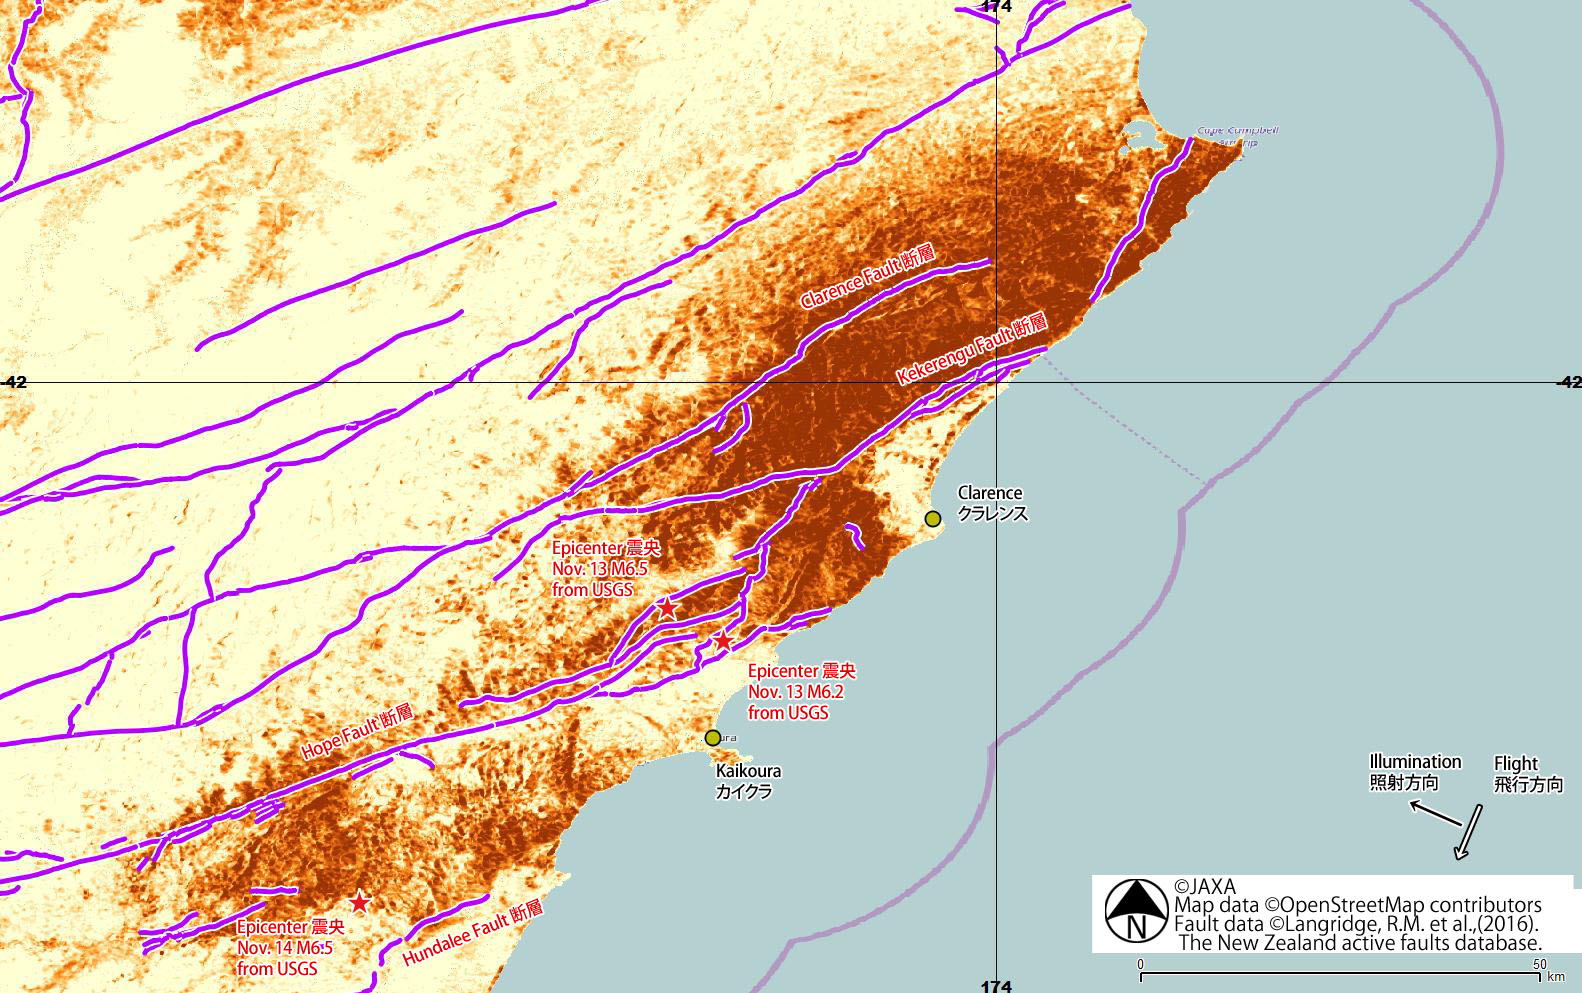
Fig. 4 shows the damage proxy map of large deformation area generated by comparing the interferometric coherence values before (Jul. 26, 2016 and Oct. 18, 2016) and after (Nov. 15, 2016) the earthquake. The dense orange parts illustrate significant decrease of coherence caused by surface changes. Seasonal changes are included.
(Click to view enlarged image)
» KMZ File is here
Related articles:
Mar. 4, 2011: Magnitude-6.3 Earthquake in the South Island of New Zealand in 2011
Reference:
New Zealand Active Faults Database: https://data.gns.cri.nz/af/
Langridge, R.M., Ries, W.F., Litchfield, N.J., Villamor, P., Van Dissen, R.J., Rattenbury, M.S., Barrell, D.J.A., Heron, D.W., Haubrock, S., Townsend, D.B., Lee, J.A., Cox, S., Berryman, K.R., Nicol, A., Stirling, M. (2016). The New Zealand active faults database: NZAFD250. accepted to New Zealand Journal of Geology and Geophysics 59 (1)
© JAXA EORC
© Copyright 1997- All Rights Reserved.