
ALOS-2/PALSAR-2 Observation Results of the 2015 Nepal Earthquake (4)
Summary:
- We observed the crustal deformation due to the quake over Kathmandu area with the ALOS-2 PALSAR-2 data.
- The deformation area extended more than 100 km from north to south. The land around the central Kathmandu moved toward the satellite about 1 meter.
- Several local displacements detected around Kathmandu indicate the occurrence of ground subsidence that possibly causes the damage of roads and buildings.
- Further detailed analysis detected the building and road areas damaged by the disaster.
The Japan Aerospace Exploration Agency (JAXA) has been performing observations of the 2015 Nepal earthquake struck on April 25, 2015 (local time) with the Phased Array type L-band Synthetic Aperture Radar-2 (PALSAR-2) aboard the Advanced Land Observing Satellite-2 (ALOS-2, "DAICHI-2"). The emergency observations were requested from Sentinel Asia and the International Charter.
We applied an interferometric analysis to the PALSAR-2 data acquired before (Feb. 21, 2015) and after (May 2, 2015) the quake to map the crustal deformation. Figure 1 illustrates the whole interferogram obtained by the analysis. Colored fringes denote the change of line-of-sight (LoS) distance (distance between the satellite and the ground) between the two observation dates. The dense fringe distributed throughout the image shows that the deformation extended at least 100 km from north to south. A large elliptical fringe at just south of the image center means that LoS distance became shortened, and the land at the center of the fringe moved at least 1.5 meter. The central Kathmandu moved toward the satellite approximately 1 meter. A different ellipsoidal fringe at the north side means that LoS distance became extended. Note that the noises distributed over the north side are due to the changes of surface condition between the observations such as snow cover.
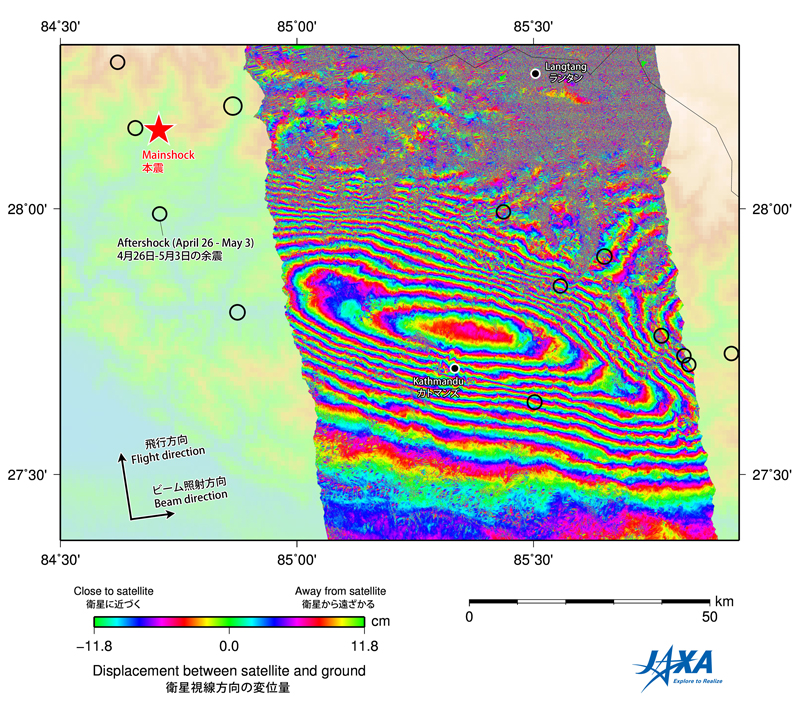 Fig.1: Interferogram obtained by the analysis of the ALOS-2 PALSAR-2 data acquired
before (Feb. 21) and after (May 2) the quake.
Observation mode: Stripmap Fine (10 m resolution), swath width: 70 km. The red star and black line circles indicate the epicenters of the mainshock (Mw 7.8) and the aftershock (more than Mw 5), respectively.
(Click to view enlarged image)
Figure 2 shows an enlarged image over the central Kathmandu. Several local-scale displacements are found in the boxes (1) and (2). The land at the box (1) moved by up to 30 cm in the satellite-ground direction compared to the outside of the box. The local displacements possibly caused different damages of structures depending on the area. According to the quick report from the in situ investigation by Japan Society of Civil Engineers, Japanese Geotechnical Society, and Japan Association of Earthquake Engineering, ground subsidence and damage of roads and buildings were found at the box (2) (Figure 3). We continue to look for similar changes in the interferogram and share the information with the in situ investigators.
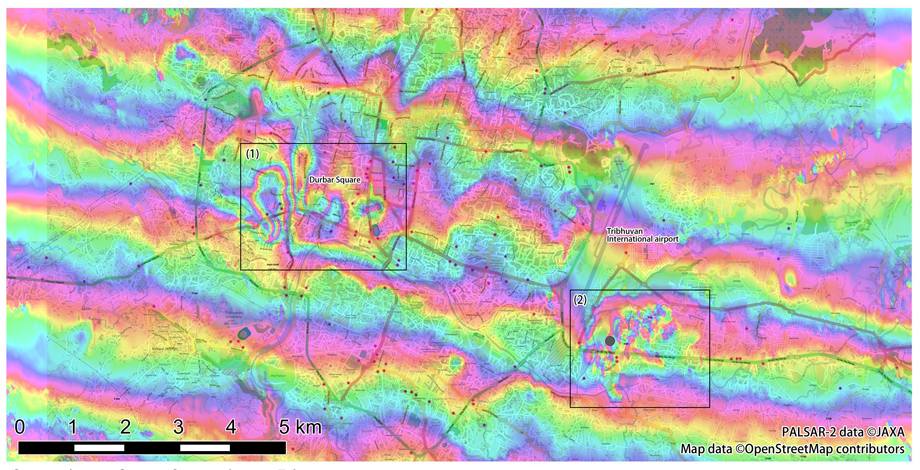
Local displacements are found in the box (1) and (2).
(Click to view enlarged image)
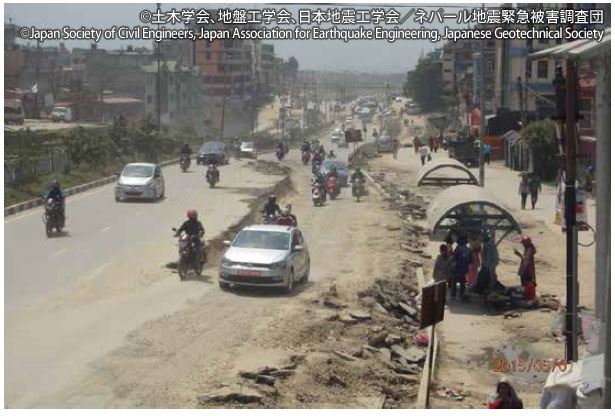 Fig.3: In situ photo taken on May 1 at the grey-color point in the box (2).
Courtesy of the investigation team of the Japan Society of Civil Engineers, Japanese Geotechnical Society, and Japan Association of Earthquake Engineering.
The subsided road is found in the photo.
Fig. 4 shows the prospective damaged building and road areas obtained by difference of coherence analysis for Fig. 2 (2) area. The analysis evaluates the difference of coherene obtained before the disaster (Oct. 4, 2014 - Feb. 21, 2015) and between the disaster (Feb. 21, 2015 - May 2, 2015). Large difference indicates large radar image difference between the three observations. Large radar image difference includes collapse of buildings, damage of roads, change of agruculture field, and snow cover. Significant decrease of coherence is observed for the areas, where building and road are damaged.
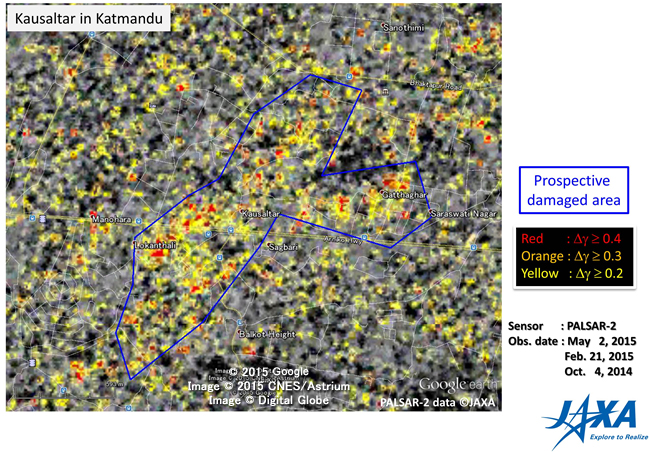 Fig.4: Prospective damaged building and road areas obtained by
difference of coherence analysis for Fig. 2 (2) area.
Significant decrease of coherence is observed for collapsed building areas (Darbar square, Dharahara tower, etc.) in Katmandu (Fig. 5).
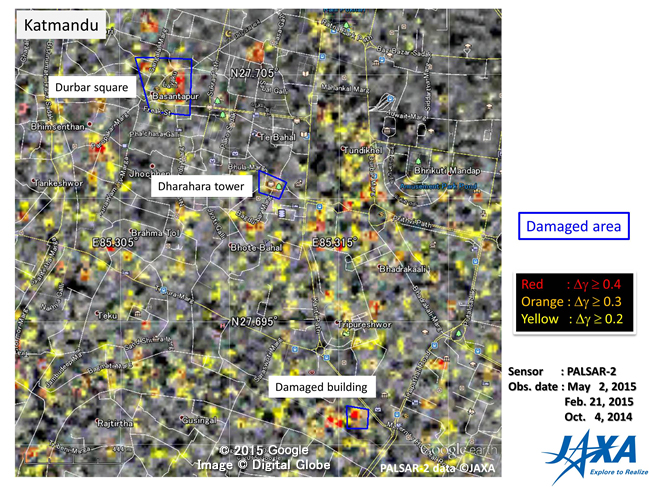 Fig.5: Prospective damaged building and road areas obtained by
difference of coherence analysis for Katmandu.
Difference of coherence image in Fig. 6 indicates prospective damaged urban area spread over the city.
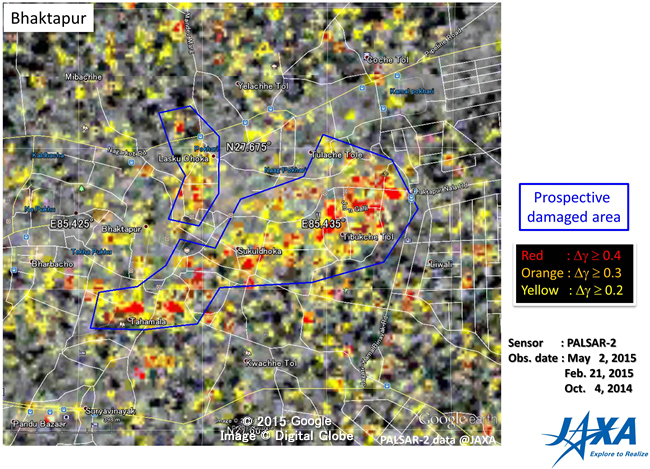 Fig.6: Prospective damaged building and road areas obtained by
difference of coherence analysis for Bhaktapur.
- * The KML file for Fig. 4-6 are downloaded from here (zip compressed file / 1.8MB)
JAXA will collaborate with relevant organization, and continue the observation at this area. The data and analysis results were provided to the International Charter, "Space and Major Disasters"
See also:
2015/5/3: Result of damage interpretations in the Nepal Himalayas using Commercial Very-High-Resolution Satellite Images and ALOS Images
2015/5/3: ALOS-2/PALSAR-2 Observation Results of the 2015 Nepal Earthquake (3)
2015/5/1: ALOS-2/PALSAR-2 Observation Results of the 2015 Nepal Earthquake (2)
2015/5/1: ALOS-2/PALSAR-2 Observation Results of the 2015 Nepal Earthquake (1)
The 2015 Nepal Earthquake: Crustal deformation detected by ALOS-2 data (Geospatial Information Authority of Japan) http://www.gsi.go.jp/cais/topic150429-index-e.html
© JAXA EORC
© Copyright 1997- All Rights Reserved.