
ALOS-2/PALSAR-2 Observation Result for Eruption of Mt. Kilauea and Earthquake in Hawaii
Posted: May 9, 2018, 12:00 (UTC)
Updated:May 15, 2018, 9:00 (UTC)
Updated:May 21, 2018, 8:00 (UTC)
Overviews
- On May 3 and 4, 2018, Mt. Kilauea in Big Island, Hawaii, started the eruption.
- On May 4, a major earthquake of Mw 6.9 (USGS) occurred close to Mt. Kilauea.
- JAXA performed an emergency observation by ALOS-2 (“DAICHI-2”) on May 8, 2017 (UTC), and ALOS-2 captured part of surface displacement.
- The interferogram using the two images on May 12, 2018 and Jan. 20, 2018 revealed the wider crustal deformation, and the changes in lava lakes’ level.
- The interferogram using the two images on May 17, 2018 and Jan. 25, 2018 showed the change in Halemaumau crater due to the explosive eruption on May 17.
- The observation data were provided to local institutions. ALOS-2 will be able to be contributed to monitor volcanic activity regardless of clouds, volcanic plumes, and sun light.
| Observation time (UTC) | Orbit number | Observation mode | Polarization | Observation direction | Beam number | |
| ① | May 8, 2018 | 89 | Stripmap 10m | HH+HV | Right | F2-6 |
| ② | May 12, 2018 | 185 | ScanSAR | HH+HV | Right | W2 |
| ③ | May 17, 2018 | 186 | ScanSAR | HH+HV | Right | W2 |
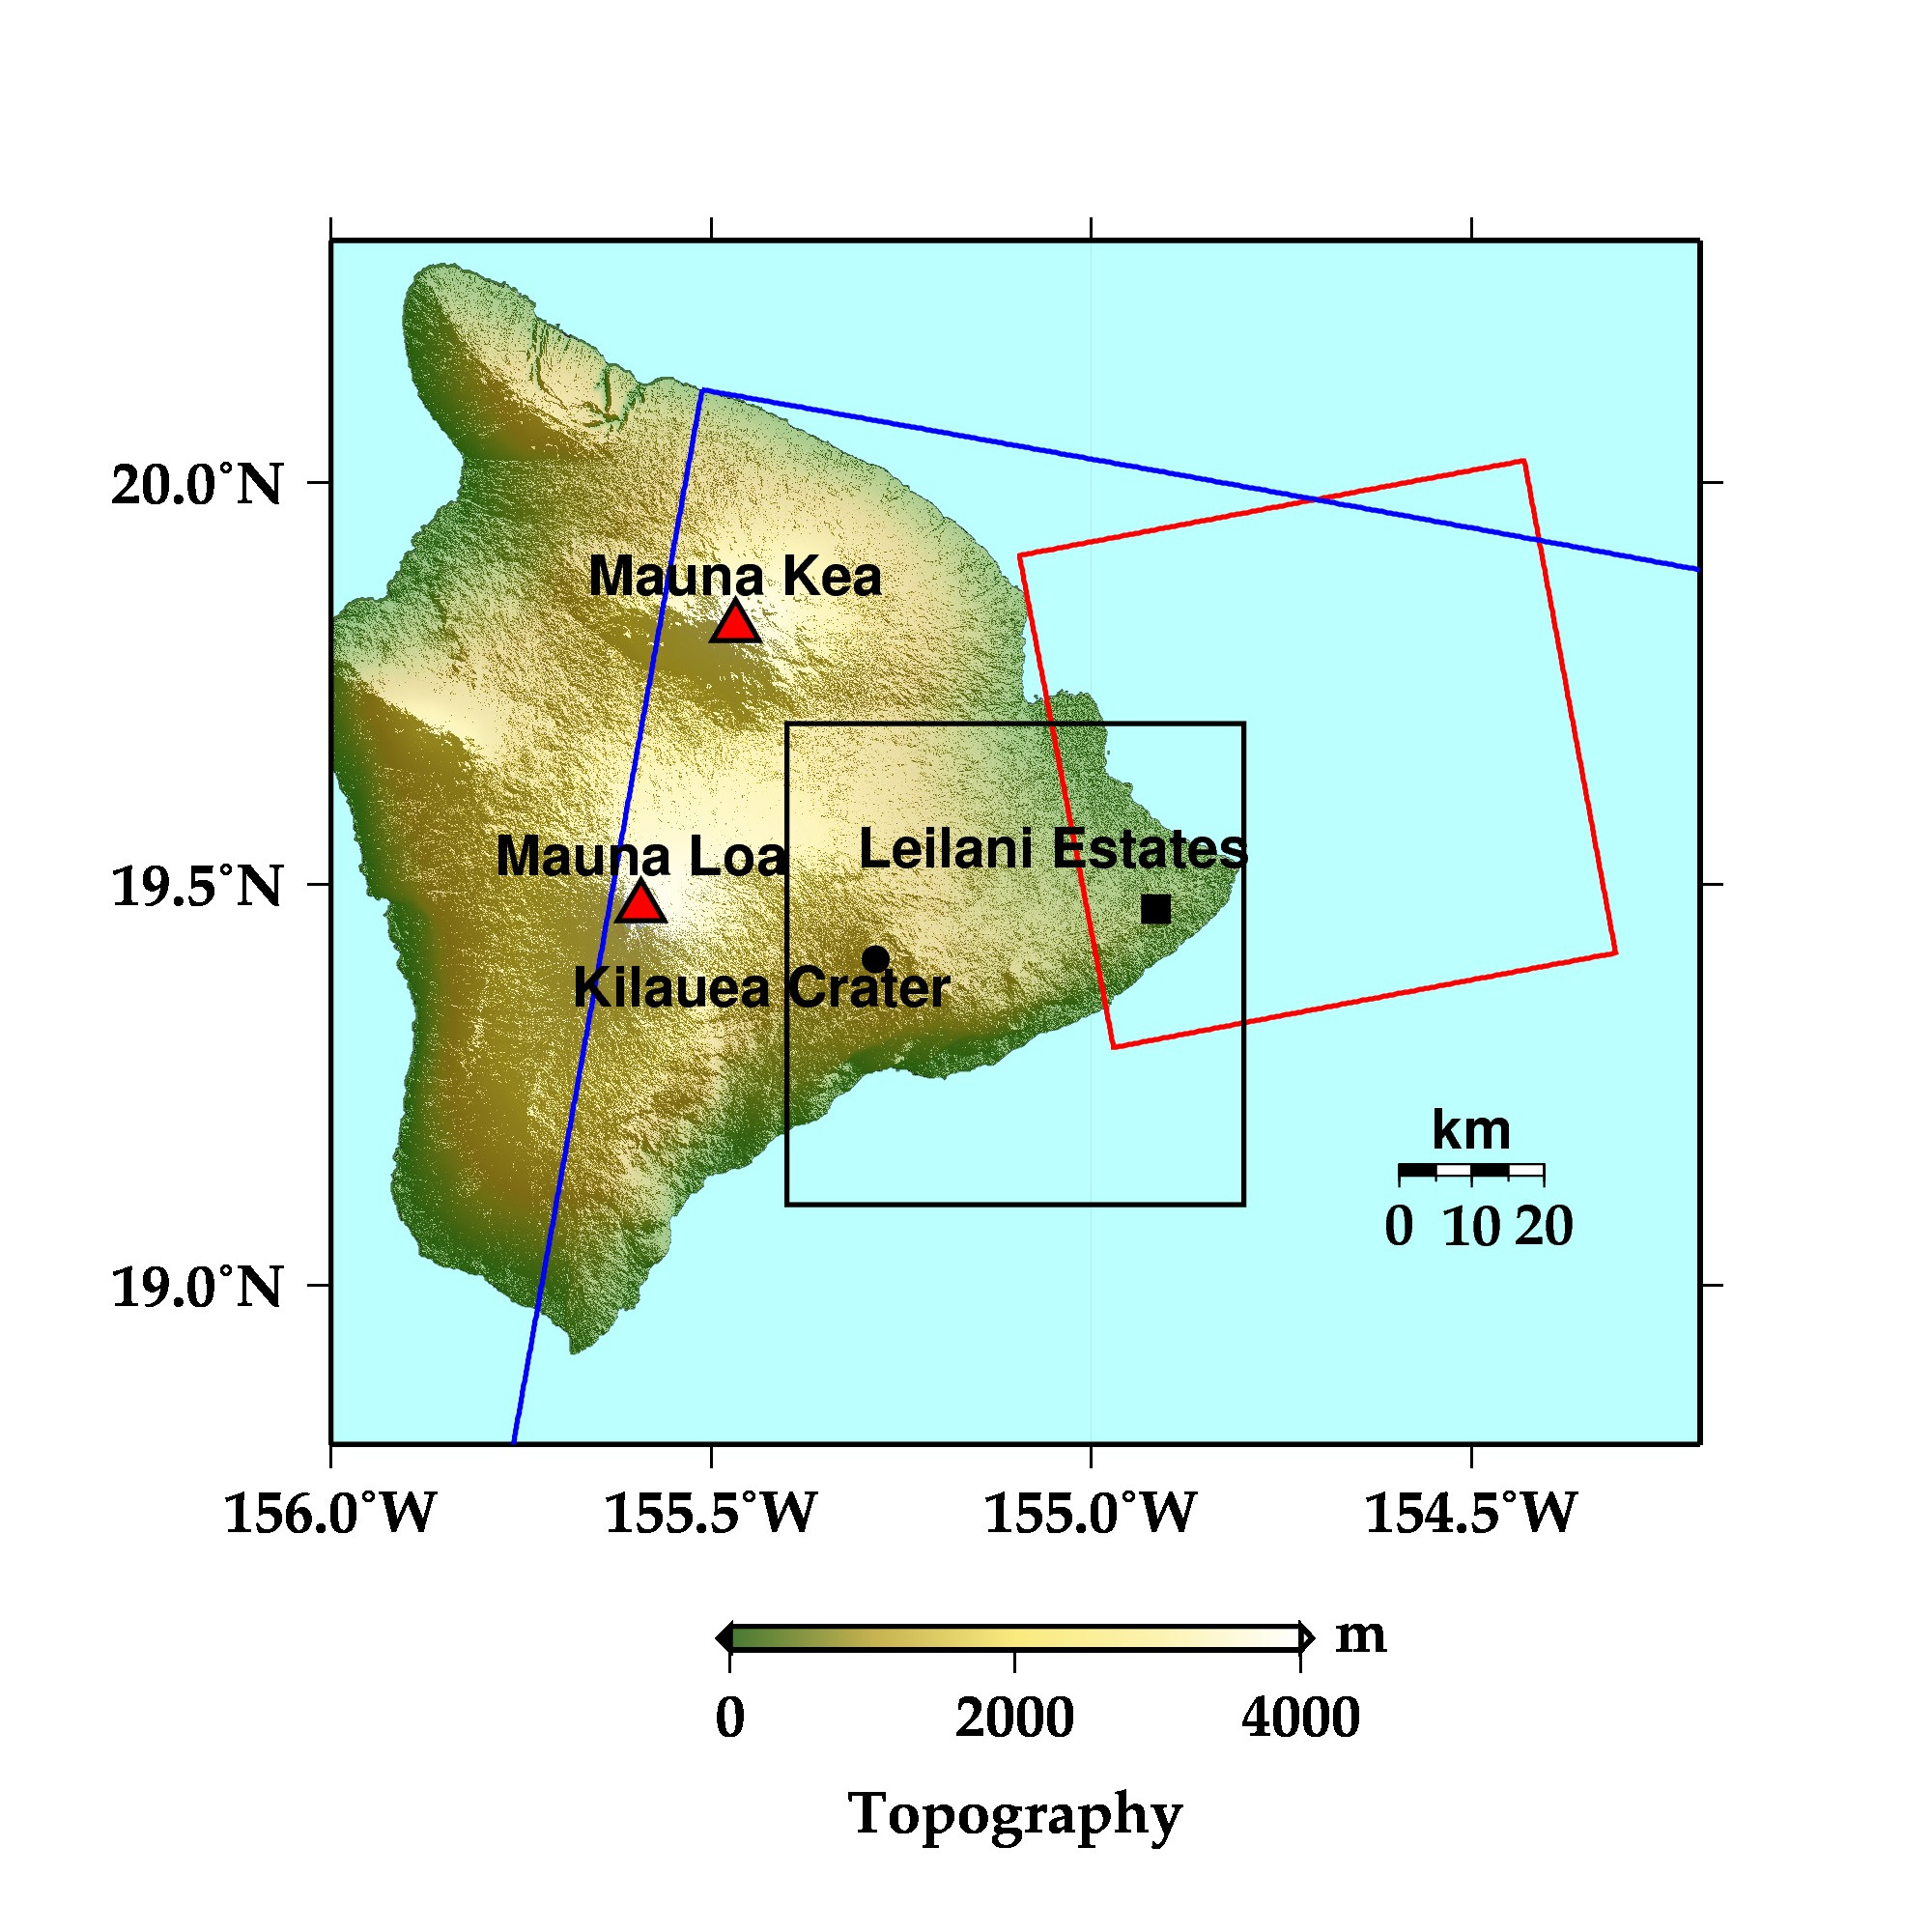 Fig. 1: Topography on Big Island and the observation area by ALOS-2.The red rectangle shows the area by Stripmap mode(data ① in Table 1), and the blue one shows that by ScanSAR mode(data ② in Table 1). The black one shows the area shown in Fig. 5.
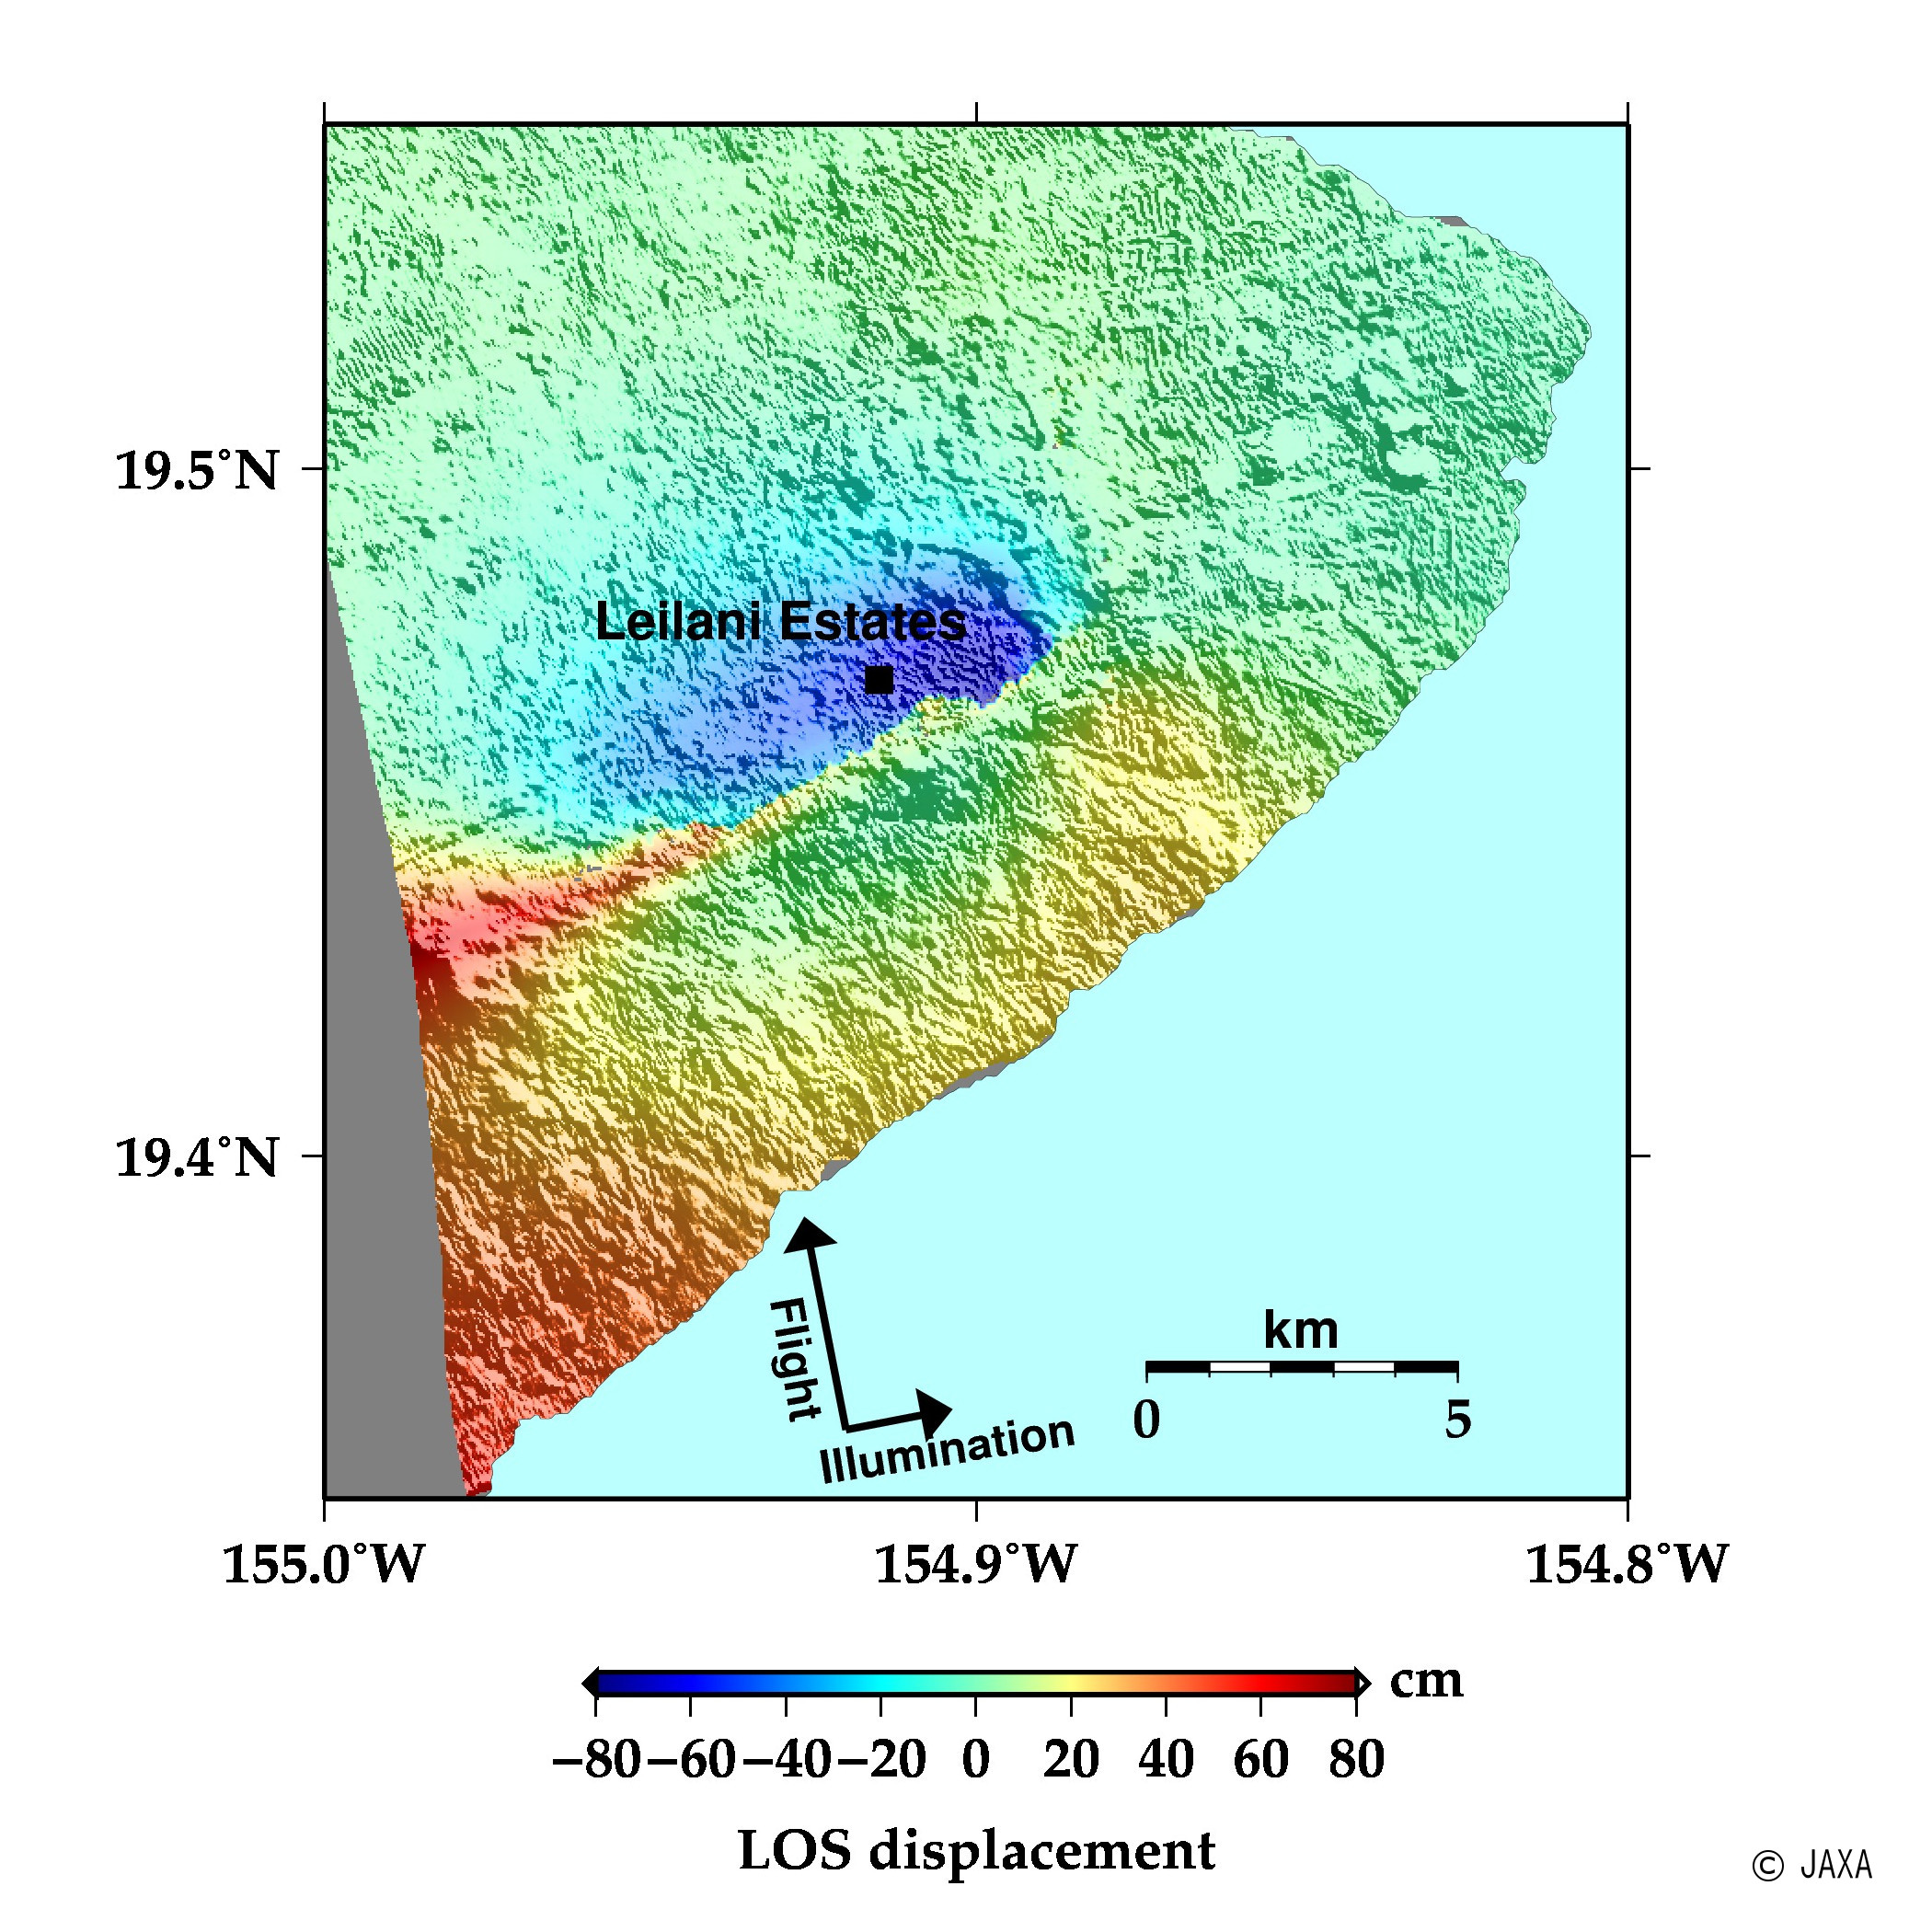 Fig. 2: An interferometric image of the ALOS-2 PALSAR-2 data acquired before (February 27, 2018) and after (May 8, 2018) the eruption and earthquake.
(Click to view enlarged image)
Figure 2 shows the interferogram using the ALOS-2 PALSAR-2 data acquired on February 27, 2018 and May 8, 2018. This image shows ~70 cm displacement toward the satellite (uplift or westward movement) in northern Leilani Estates. There is also ~60 cm displacement away from the satellite (subsidence or eastward movement) in southern Leilani Estates. Moreover, there is a discontinuity of surface displacement in central part of Figure 2, which may correspond to surface fault along this line.
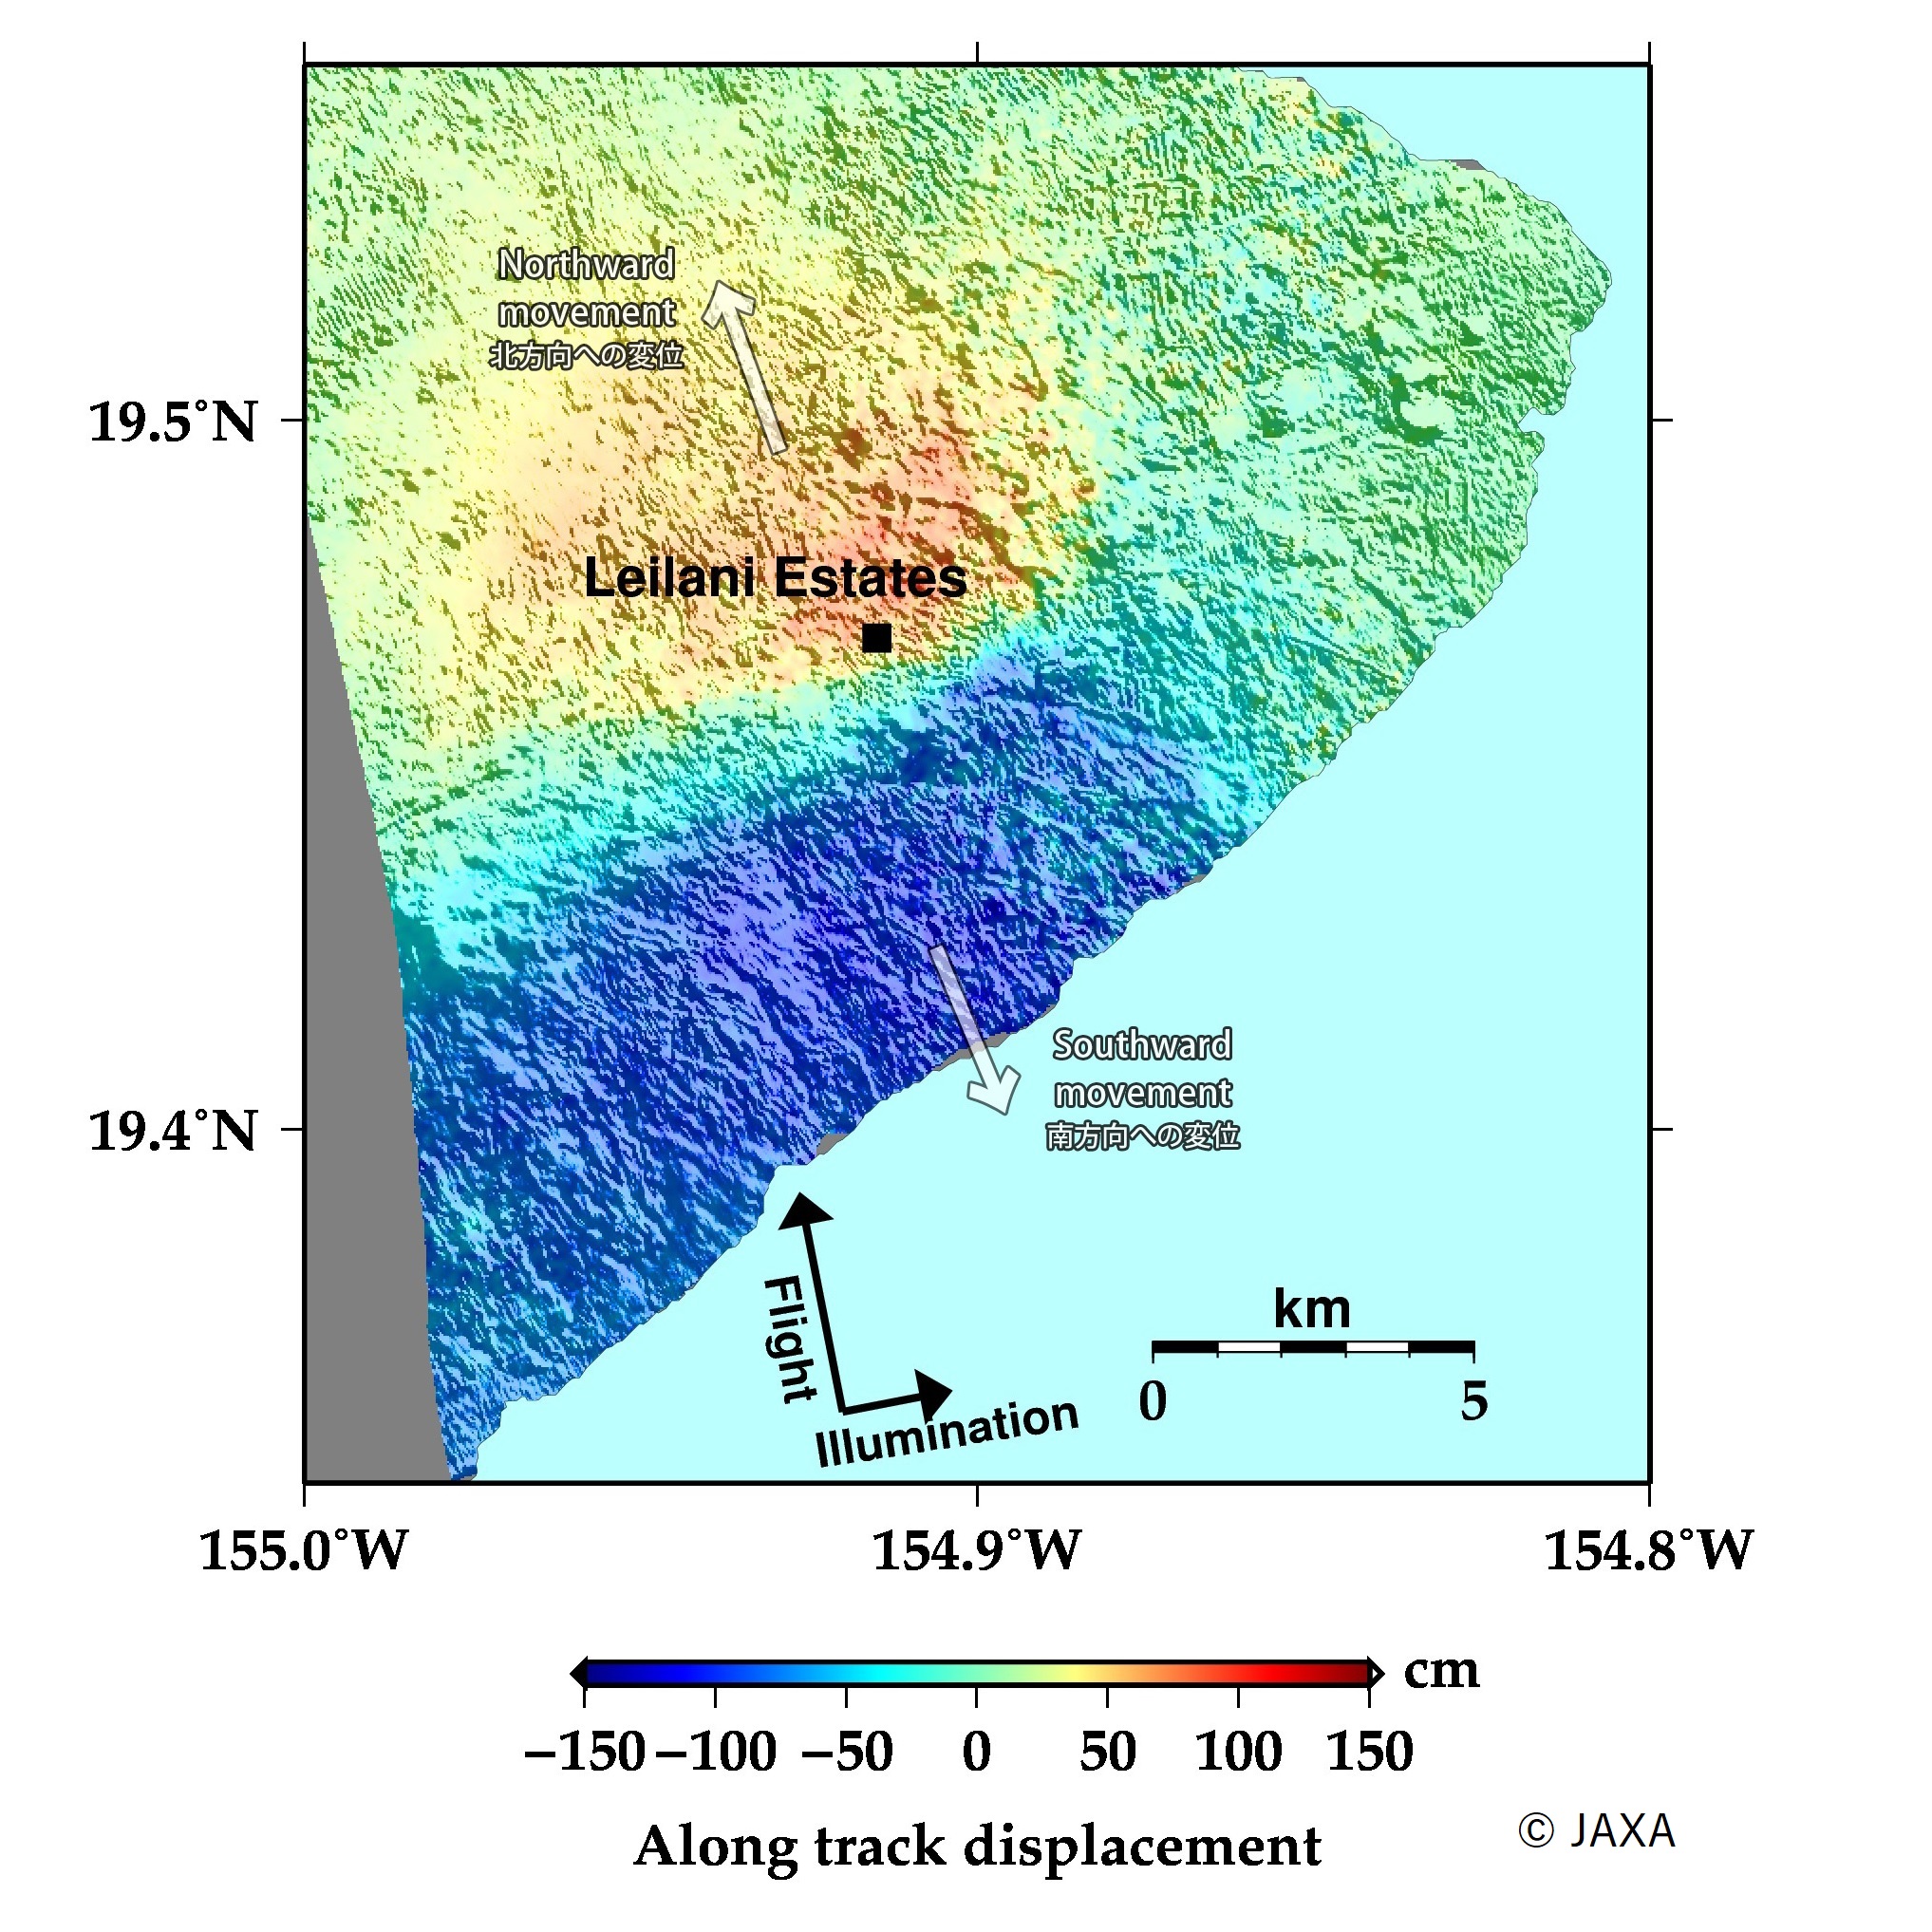 Fig. 3: A Multiple Aperture Interferometry image of the ALOS-2 PALSAR-2 data acquired before (February 27, 2018) and after (May 8, 2018) the eruption and earthquake.
(Click to view enlarged image)
Figure 3 shows the result by Multiple Aperture Interferometry using the same data in Fig.2. This technique can derive the displacement along the direction of the satellite traveling. The image shows ~70 cm displacement toward the satellite movement northern Leilani Estates. There is also ~110 cm displacement along the reverse direction of the satellite traveling in southern Leilani Estates.
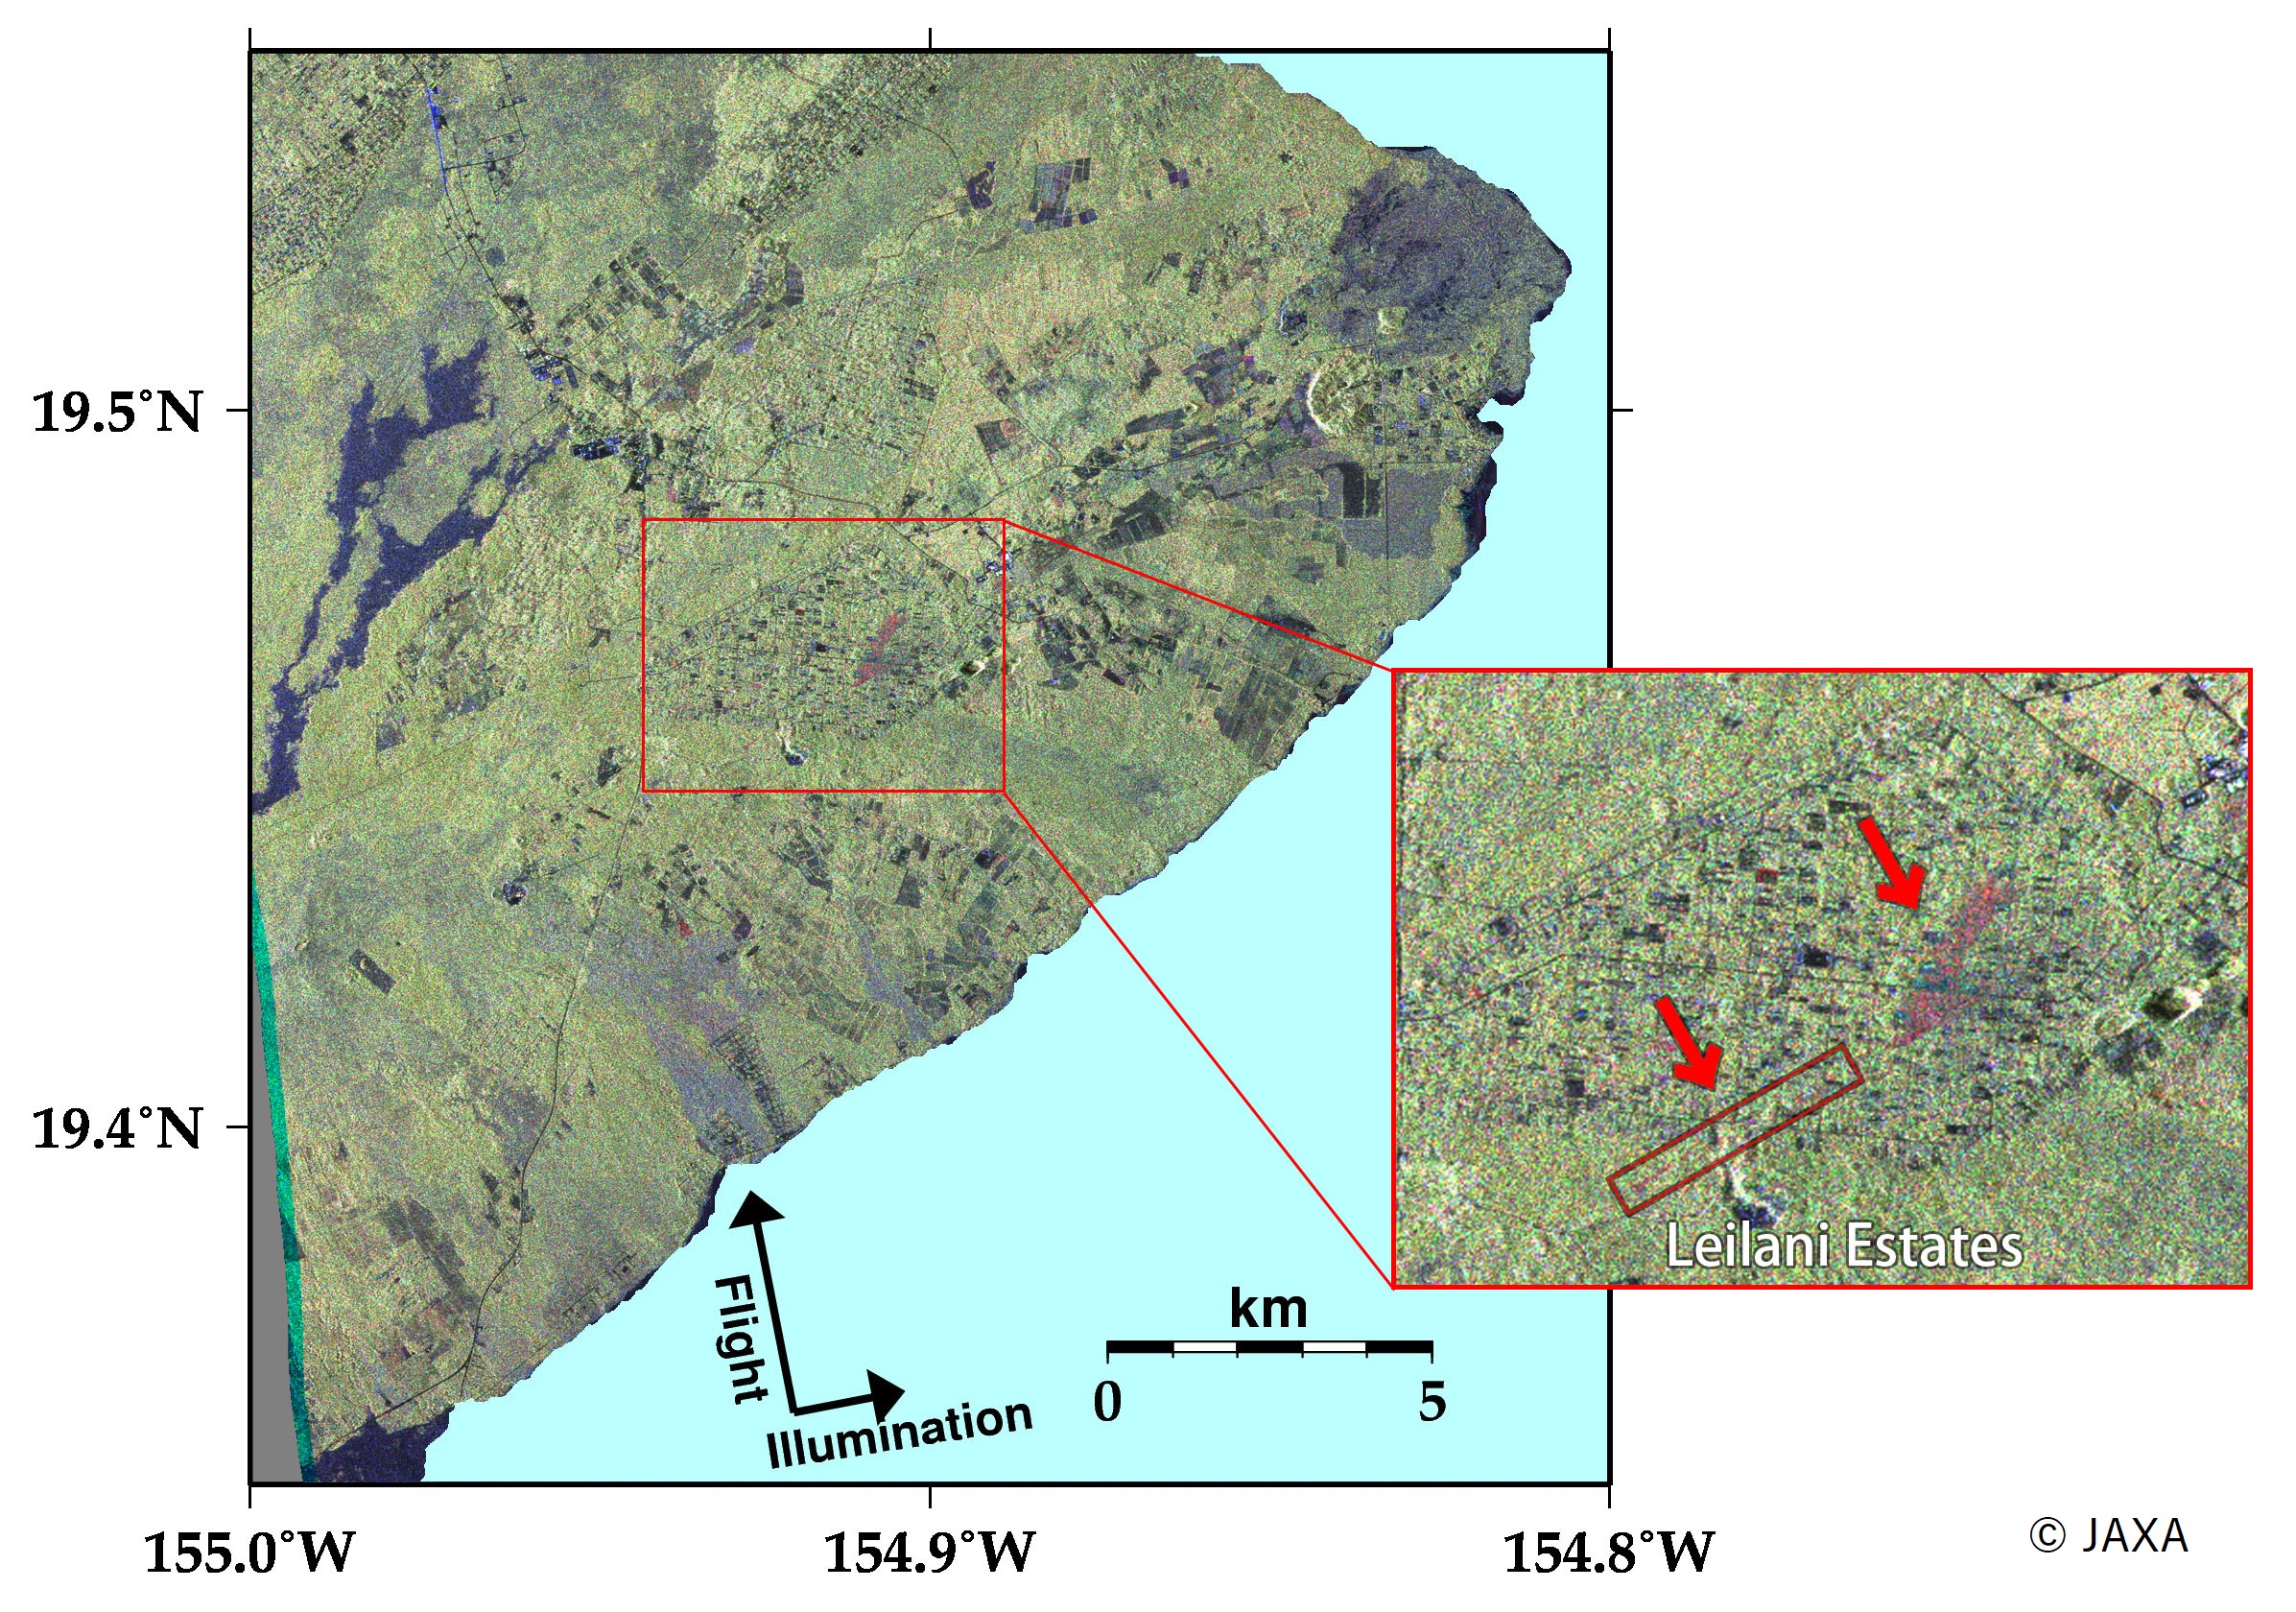 Fig. 4: Polarimetric color-composite image of the ALOS-2 PALSAR-2 data acquired before (February 27, 2018) and after (May 8, 2018) the eruption and earthquake.
(Click to view enlarged image)
Figure 4 shows a color-composite image (red: Feb 27 HV polarization, green: May 8 HV pol., blue: May 8 HH pol.) where eruptive fissures and lava flow can be seen in red color (red arrows in Fig. 4).
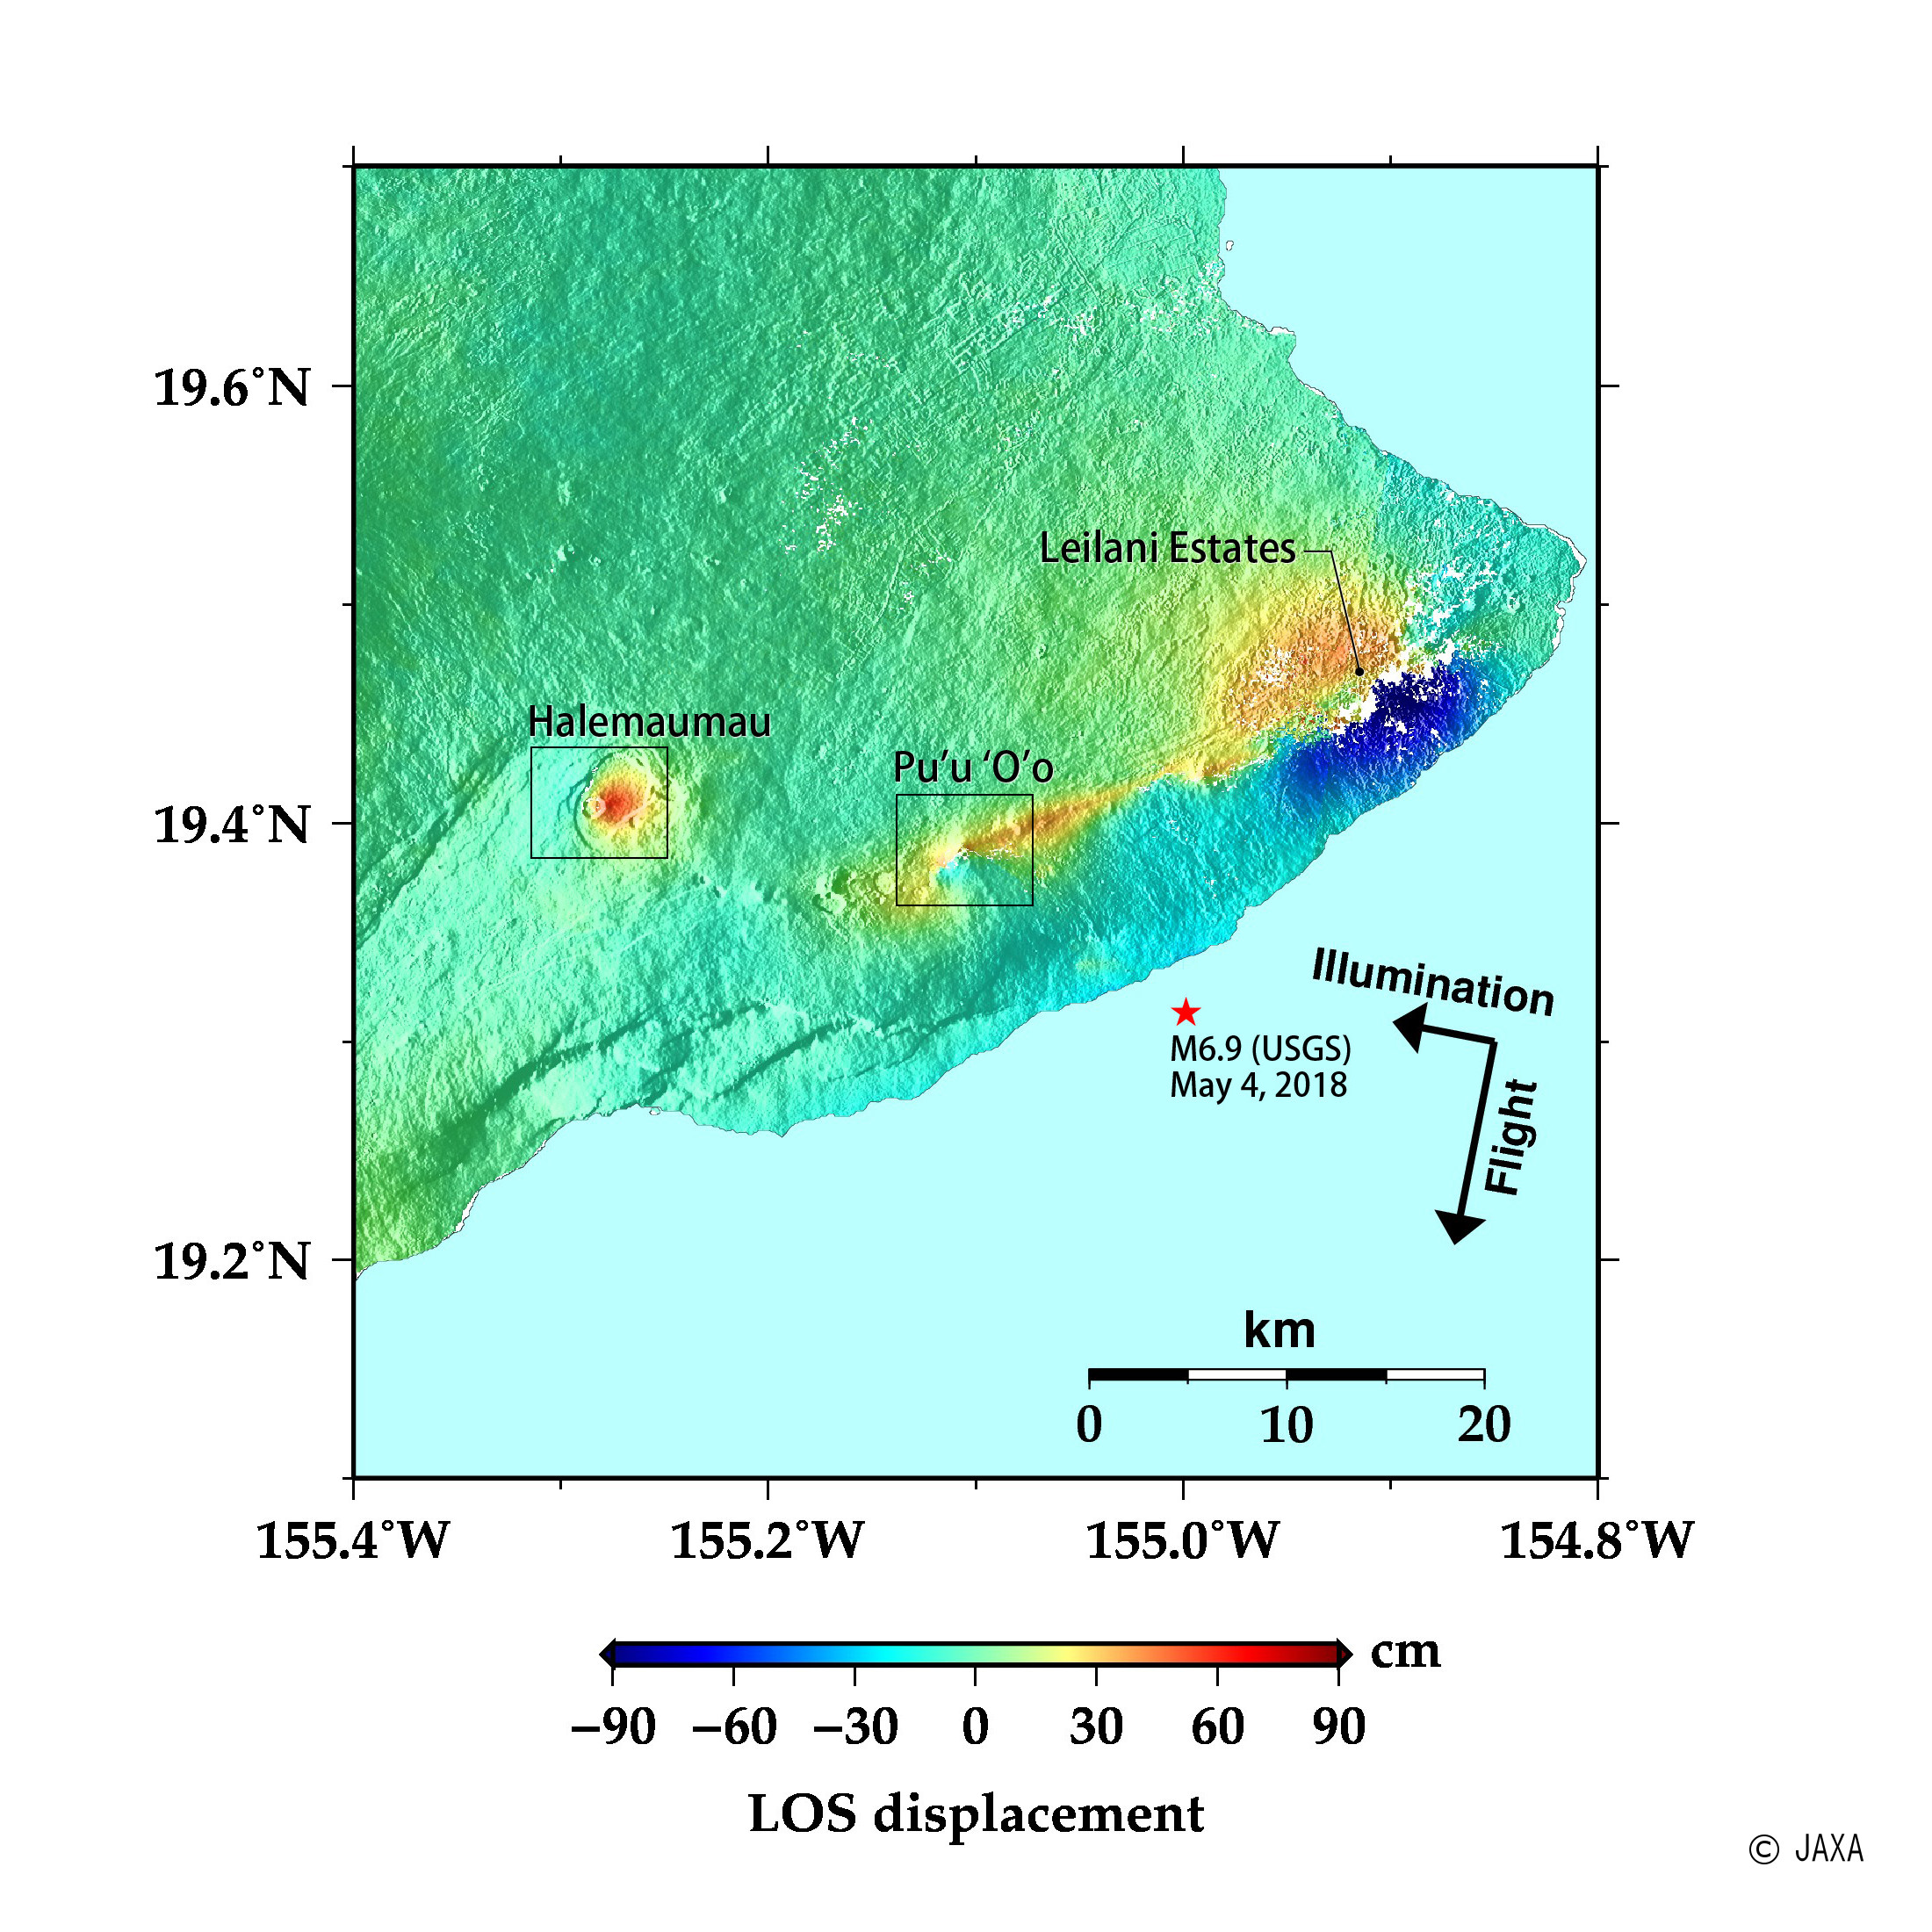 Fig. 5: An interferometric image of the ALOS-2 PALSAR-2 data acquired before (January 20, 2018)
and after (May 12, 2018) the eruption and earthquake.
Fig. 5: An interferometric image of the ALOS-2 PALSAR-2 data acquired before (January 20, 2018)
and after (May 12, 2018) the eruption and earthquake.
(Click to view enlarged image)
Figure 5 shows the interferogram using the ALOS-2 PALSAR-2 data acquired on January 20, 2018 and May 12, 2018. The wider crustal deformation has been revealed. The image shows ~100 cm displacement toward the satellite in south part from Leilani Estates. Moreover, ~ 50 cm displacement away from satellite was detected around Halemaumau Crater.
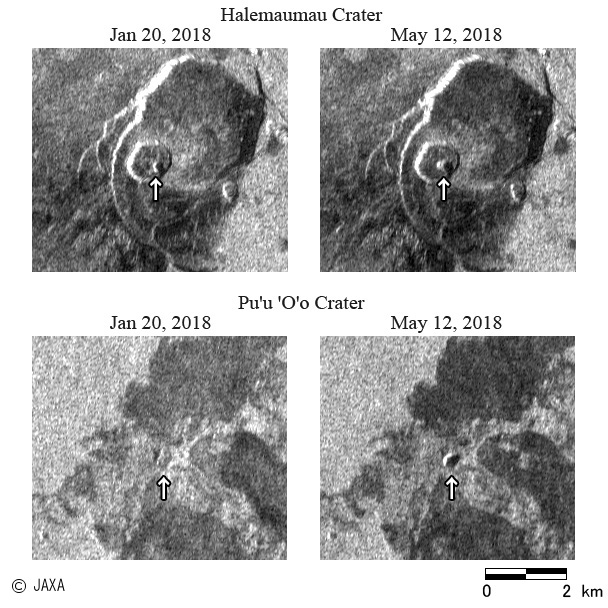 Fig. 6: Comparison of the two HH amplitude images acquired before (January 20, 2018) and after
(May 12, 2018) the eruption and earthquake.
Fig. 6: Comparison of the two HH amplitude images acquired before (January 20, 2018) and after
(May 12, 2018) the eruption and earthquake.
(Click to view enlarged image)
Figure 6 shows comparisons of amplitude images around Halemaumau crater and Pu'u 'O'o crater on May 12 and Jan. 20, 2018. In both craters, terrain inside the craters has changed due to the lowered lava lake level.
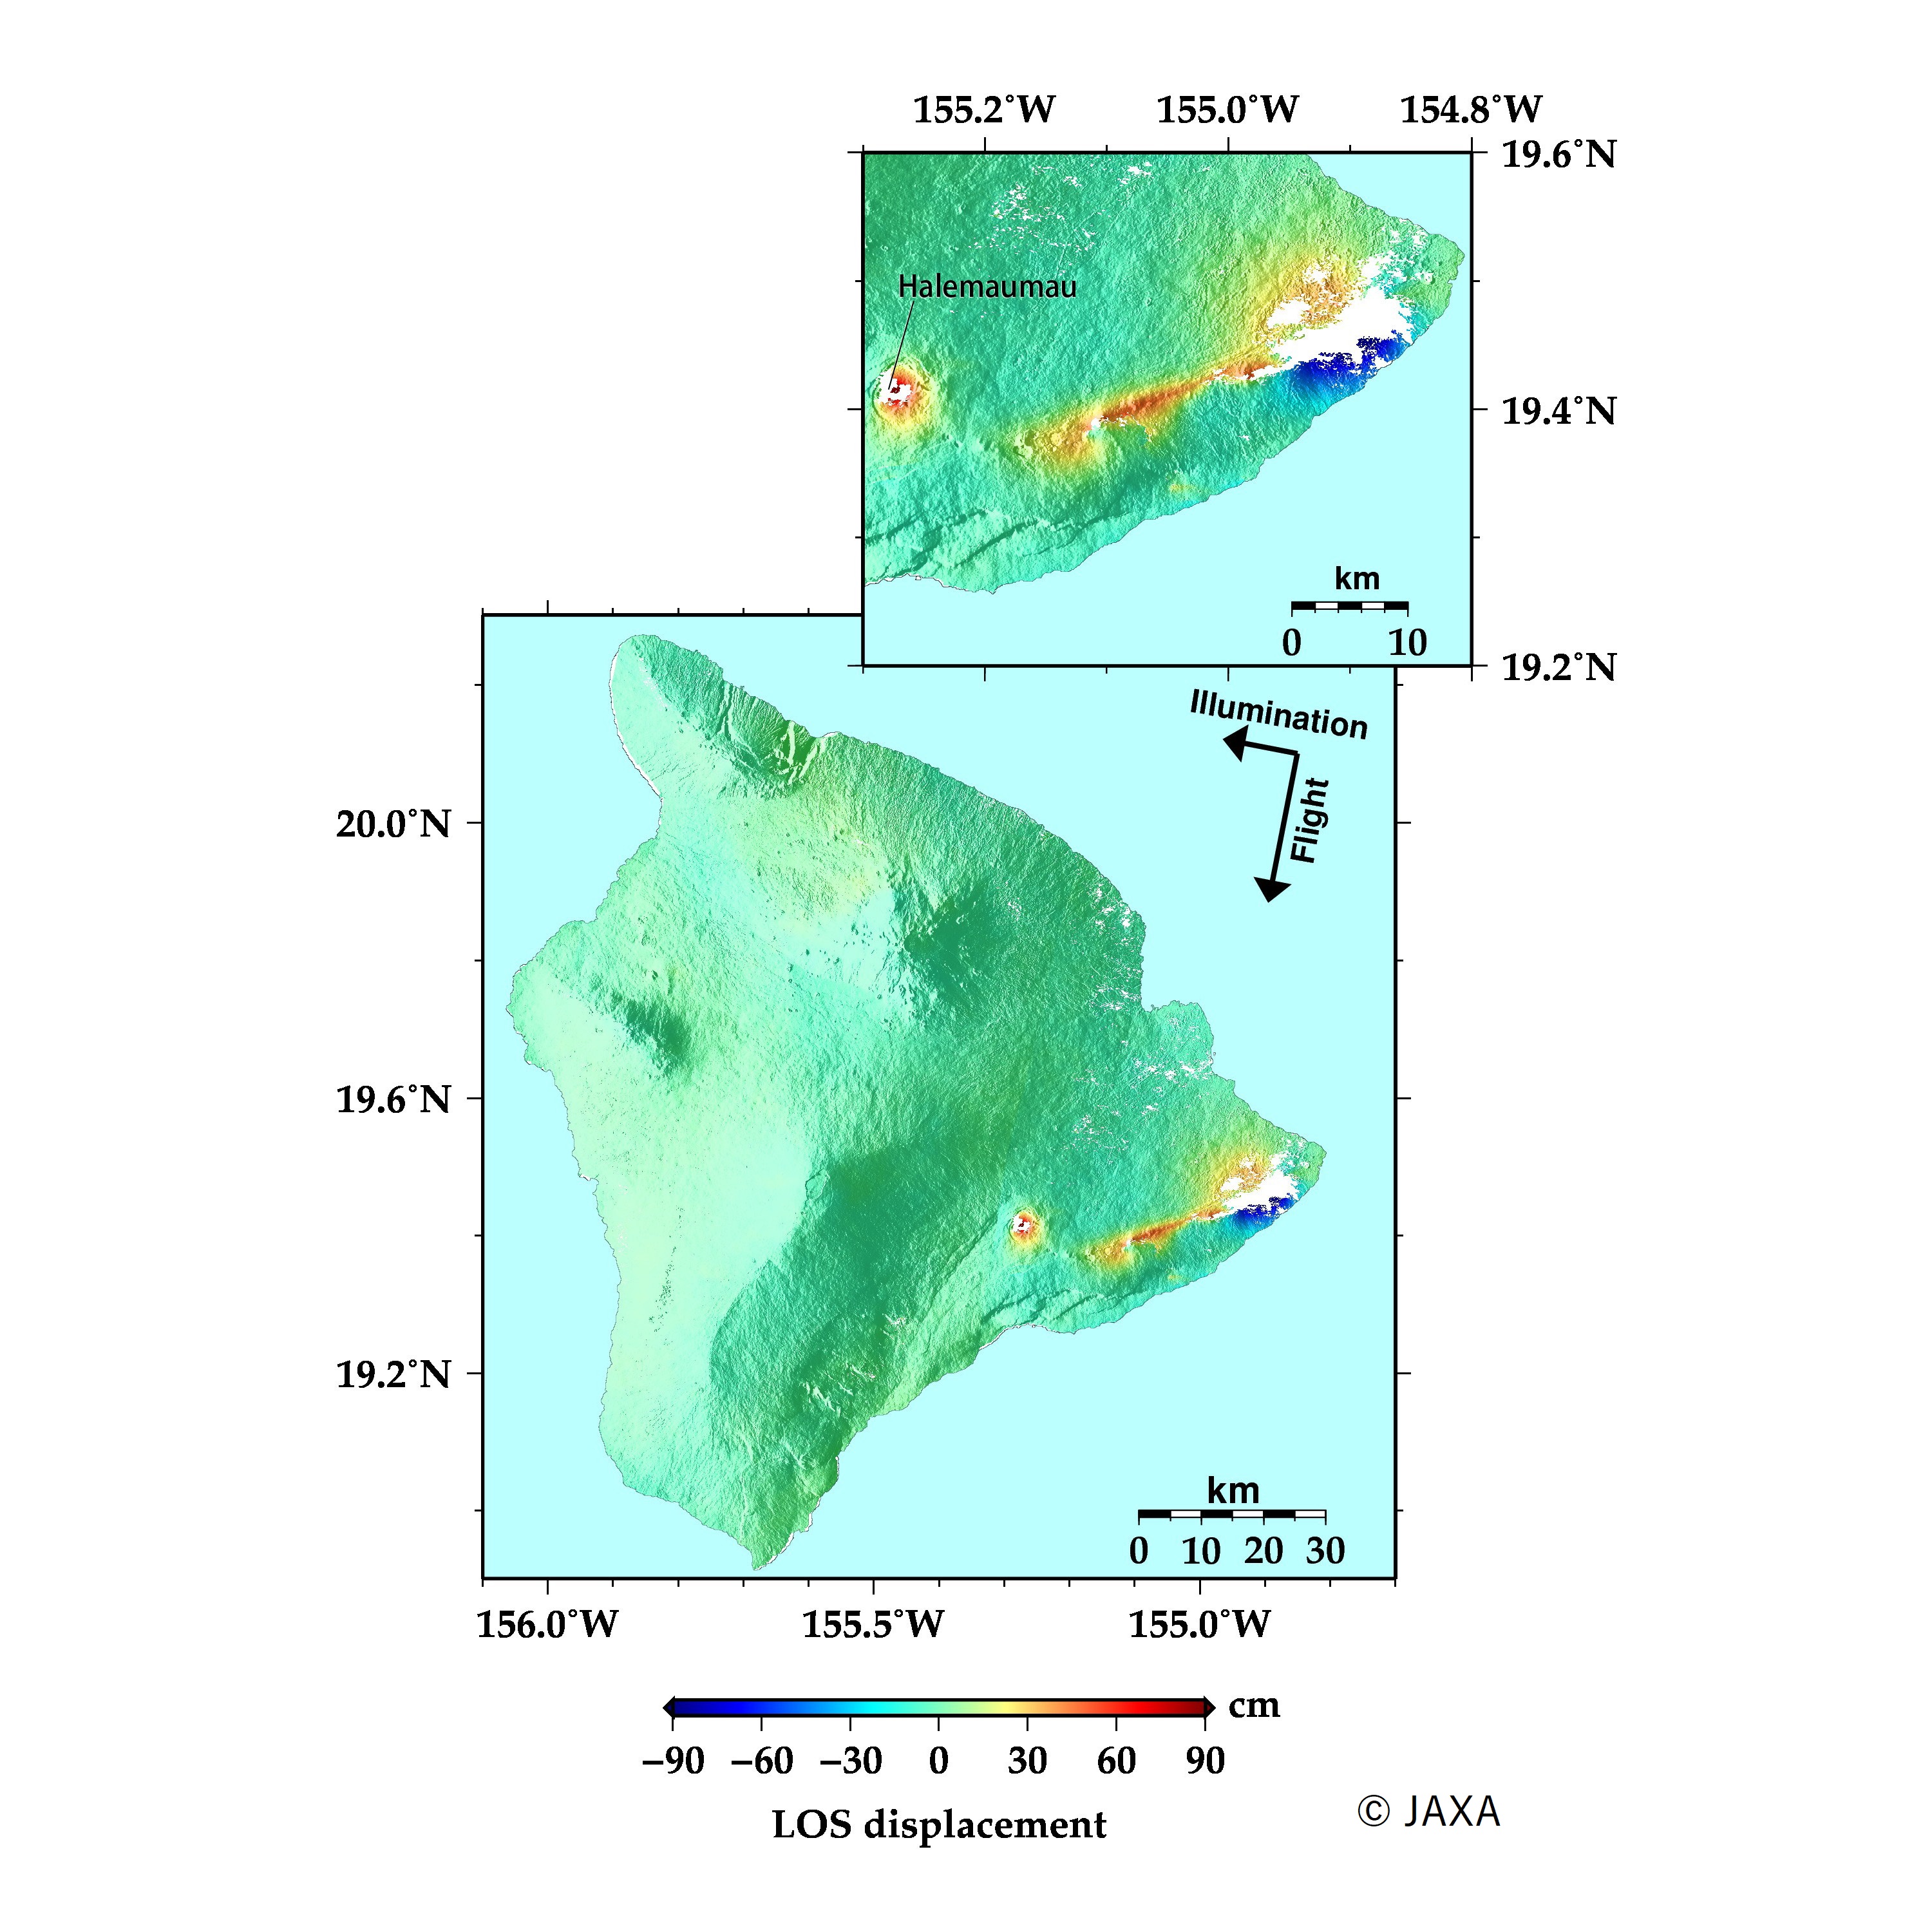 Fig. 7: An interferometric image of the ALOS-2 PALSAR-2 data acquired before (January 25, 2018) and after (May 17, 2018) the eruption and earthquake.
(Click to view enlarged image)
Figure 7 shows the interferogram using the ALOS-2 PALSAR-2 data acquired on January 25, 2018 and May 17, 2018. The result seems similar to that in Fig.5, but there is up to 110 cm displacement away from satellite in Halemaumau crater.
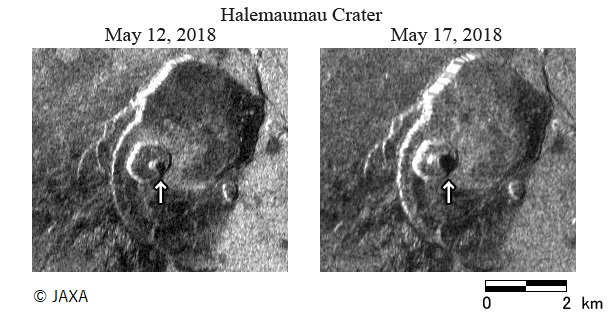 Fig. 8: Comparison of the two HH amplitude images acquired on May 12, and 17, 2018.
(Click to view enlarged image)
Figure 8 shows a comparison of amplitude images around Halemaumau crater on May 12 and 17. The crater became bigger after the large eruption.
We will continue to monitor Mt. Kilauea by ALOS-2.
© JAXA EORC
© Copyright 1997- All Rights Reserved.