2020
Mar 9, 2020
EORC/JAXA
Global Extreme Heavy Rainfall and Drought detected by GSMaP
∼ "JAXA Climate Rainfall Watch" website is now available∼
JAXA has been addressing global precipitation-related issues under the Global Precipitation Measurement (GPM) Mission by utilizing the 3D precipitation product "Dual-frequency Precipitation Radar (DPR)" onboard GPM core observatory and multi-satellite precipitation product "Global Satellite Mapping of Precipitation (GSMaP)".
We are pleased to inform that the new website called "JAXA Climate Rainfall Watch" is now available, which provides information about extreme heavy rainfall and drought over the world (Fig. 1). You can easily monitor global extreme weather and climate by displaying accumulated rainfall in some temporal scale (daily, pentad, weekly, 10-days and monthly), indices related to extreme heavy rainfall (percentiles*) and drought (SPI**) as shown in Fig. 2. A specified date after April 2000 can be selected, please see the User’s guide for more information.
*Percentiles...
A measure indicating the number from the smallest one with 100 as the total observations. Larger value indicates heavier rainfall. For example, 90th percentile means the value that becomes the 10th counting from the largest with the observations as 100.
**SPI...
Standardized Precipitation Index (SPI) is an index from which we can evaluate drought using only precipitation amount. Larger negative values indicate severe or even extreme drought.
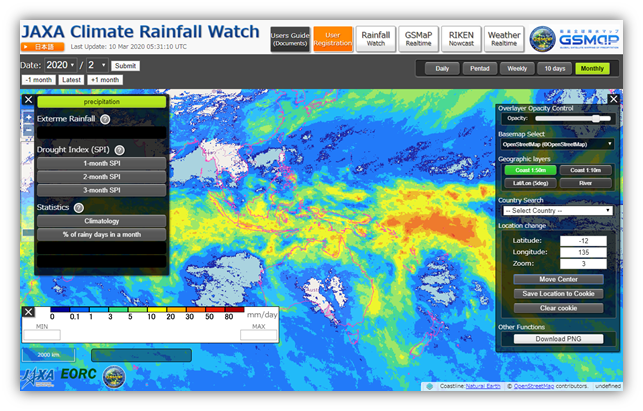
Fig.1 Graphical User Interface of the "JAXA Climate Rainfall Watch" website
(Monthly precipitation in February 2020)
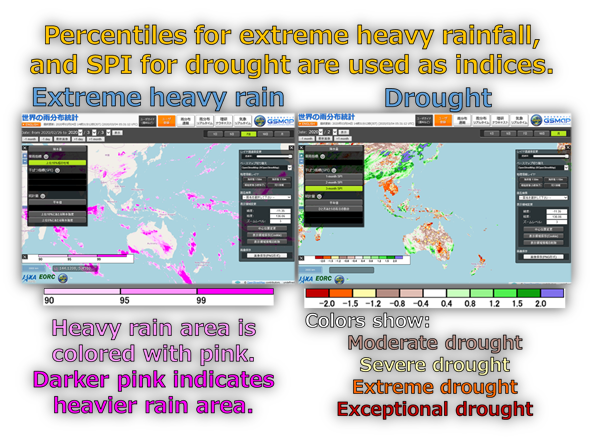
Fig.2 Indices related to extreme heavy rainfall and drought
Please see the video how to use the "JAXA Climate Rainfall Watch" (Fig. 3)
Fig. 3. How to use the "JAXA Climate Rainfall Watch"
For using hourly-based GSMaP rainfall, please visit the "JAXA Global Rainfall Watch" website.


