Seen from Space 2020
Measuring the decline of sea surface temperature from satellite during typhoon passage
The Super Typhoon "HAISHEN"(T2010), which approached the Kyushu region from Daito Island in Okinawa Prefecture from September 6 to 7, 2020, threatened to approach and make landfall over Japan with special warning class strength, and there were many reports urging caution in various quarters in advance. Although no special warning was issued because its intensity did not develop as much as expected, the typhoon with large-scale and very strong intensity caused a lot of damage, including a large-scale power outage in Kyushu, as approaching. We wish to extend our deepest sympathy to all those who have suffered hardship from the disasters caused by this typhoon.
This article reports how the sea surface temperature (SST) behaves when typhoon passed through, mainly introducing observations by the JAXA satellite, the Advanced Microwave Scanning Radiometer 2 (AMSR2) onboard the Global Change Observation Mission - Water "SHIZUKU" (GCOM-W) and the latest ocean model outputs. The characteristics of satellite-based SST observations are summarized at the end of the article. Please refer to it if you are interested in.
What track did the typhoons take?
In contrast to previous month, which has no typhoon at all, there were eight typhoons from Typhoon No.3 to No.10 in August 2020 (T2003-T2010). Among these, three typhoons passed near the East China Sea from late August to early September: Typhoon "BAVI" (T2008) (August 21-28), Typhoon "MAYSAK" (T2009) (August 28 - September 3), and Super Typhoon "HAISHEN" (T2010) (August 31 - September 8). Figure 1-1 shows each track and intensity (wind speed) of typhoons. The three typhoons passed through the East China Sea one after another in less than 20 days from late August to early September.
In order to see the intensity of each typhoon when passing through the East China Sea, precipitation and all-weather sea surface wind speed (intensity of wind over the ocean; estimate is available even during rainy weather) observed by AMSR2 are shown in Figure 1-2. At this time, the maximum wind speed of Typhoon "BAVI" reported by the Japan Meteorological Agency (JMA) was 42.2 m/s, and those of Typhoon "MAYSAK" and Super Typhoon "HAISHEN" were 50 m/s each. The wind speeds near the center of each typhoon observed by AMSR2 was well correspondent with the JMA's reported values. Also, it was distinctive for Super Typhoon "HAISHEN" that the orange-red areas, which indicate wind speeds of 40 m/s or higher, were much larger than those in the two preceding typhoons.
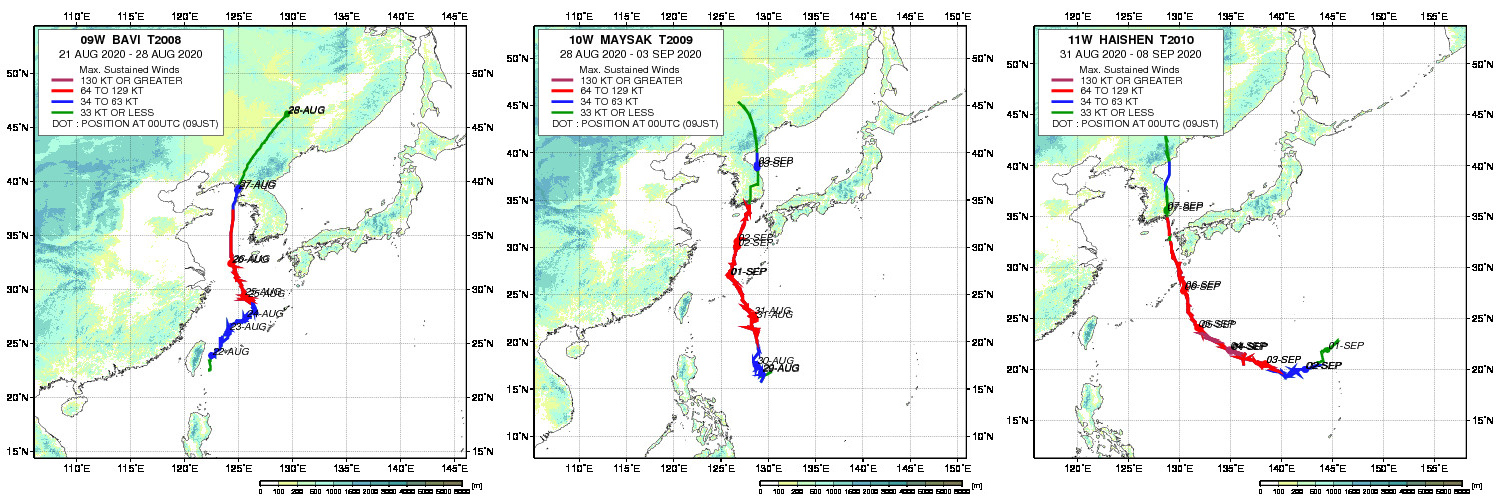
Figure 1-1. Track of Typhoon "BAVI" (left), Typhoon "MAYSAK" (center) and Super Typhoon "HAISHEN" (right) in 2020
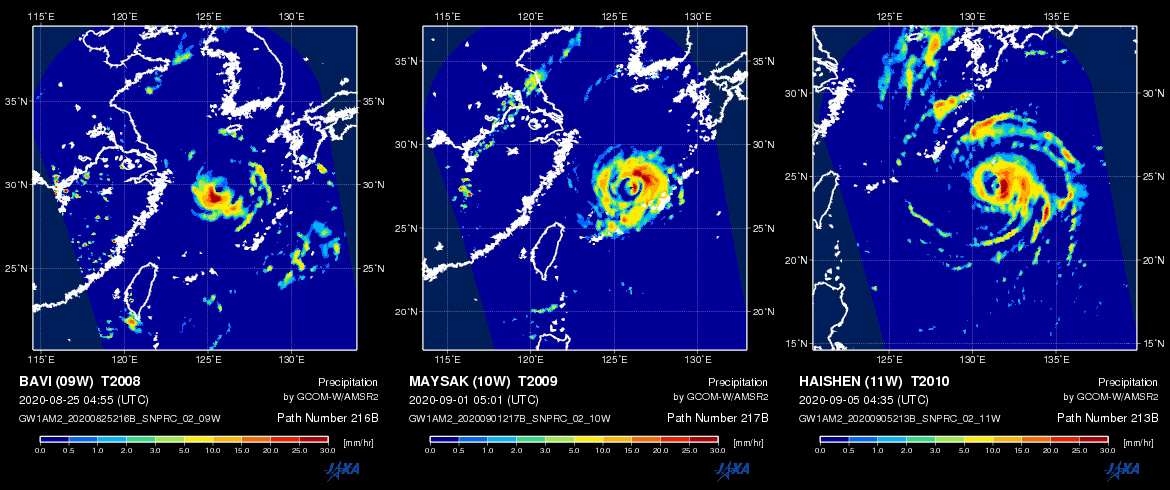
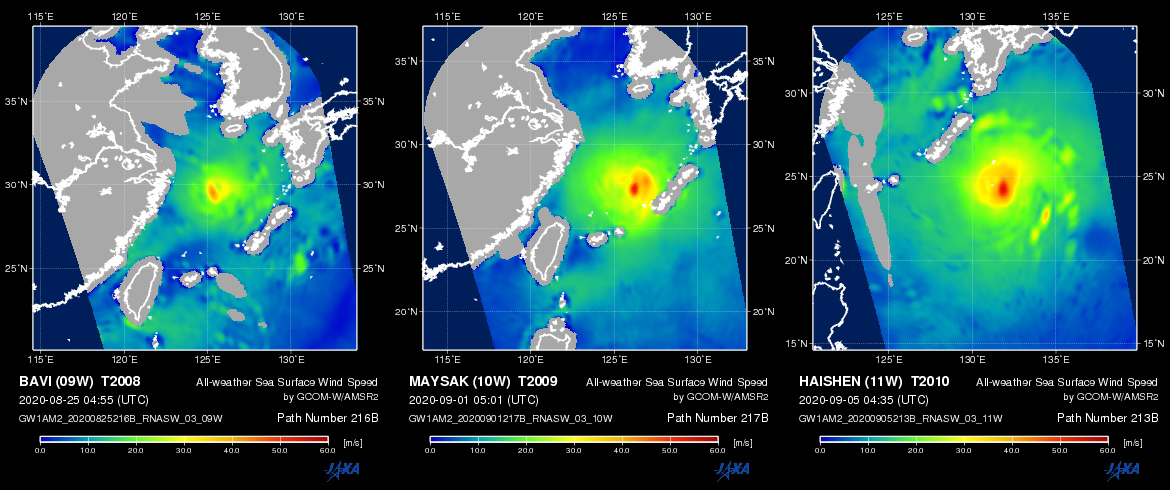
Figure 1-2. Precipitation when a typhoon approaches the East China Sea (top line) and all-whether sea surface wind speed (bottom line)observed by AMSR2. From left to right, Typhoon "BAVI" (August 25, 04:55 UTC), Typhoon "MAYSAK" (September 1, 05:01 UTC)and Super Typhoon "HAISHEN" (September 5, 04:35 UTC).
Typhoon passage and the change of SST
What was the condition of SST around Japan in August? Figure 2-1 shows monthly average of SST in August 2020 (left) and anomaly from normal year (right) by AMSR2. The rainy season ended nationwide Japan in August, and SST was higher 2-3 ℃ on average than normal year over a wide range on the south of Japan. In some places, the SST rose to almost 32℃. In contrast, the temperature near the East China Sea, where the typhoon passed through this time, was around 30 ℃, slightly higher than normal year.
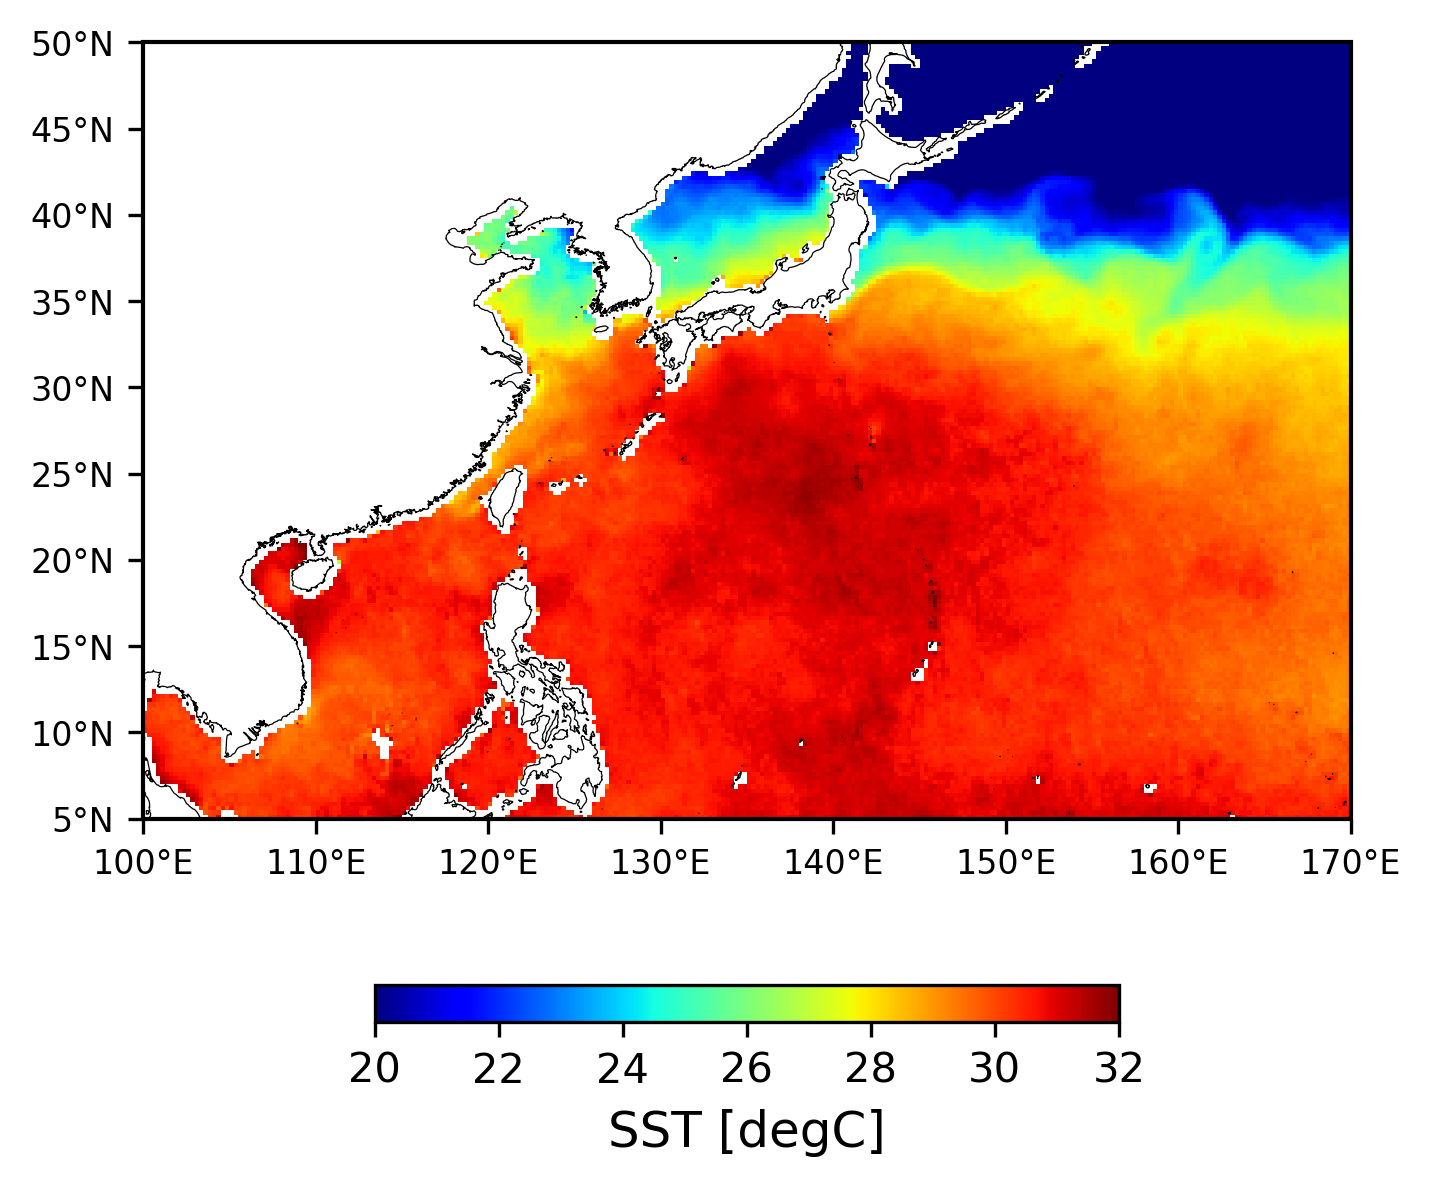
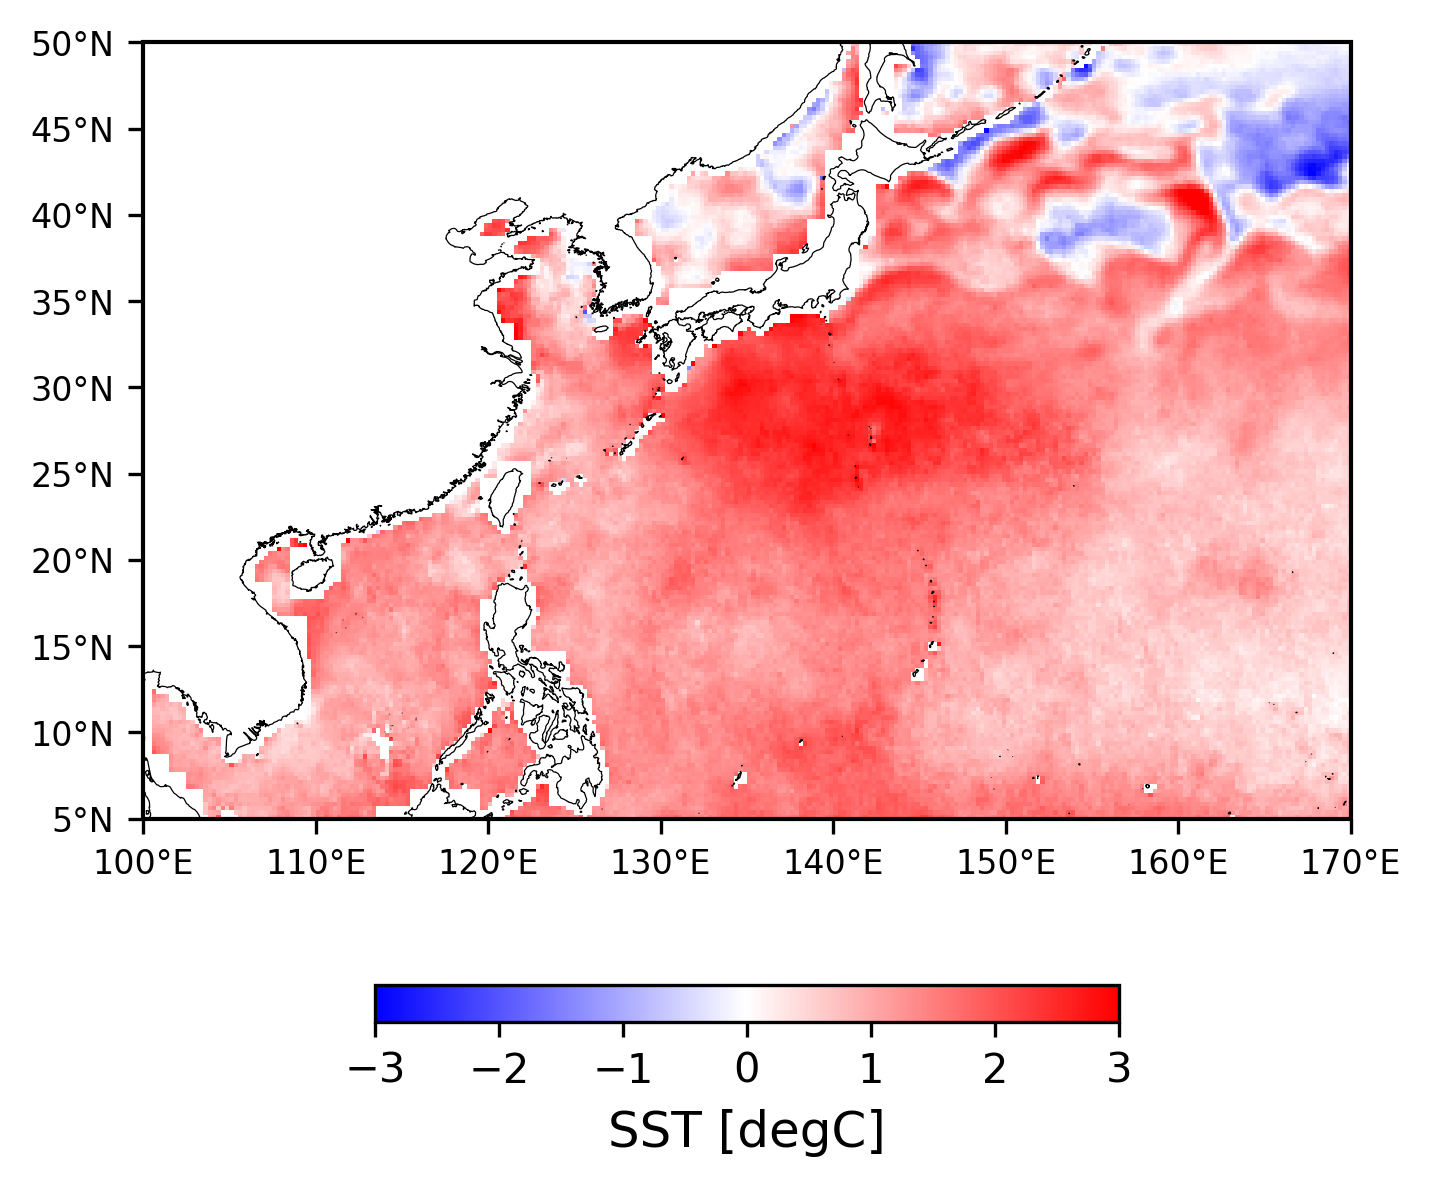
Figure 2-1. Monthly averaged SST in August 2020 (left) and its anomalies from normal year (right) by AMSR2. Normal year is defined as 30-year mean value produced by JMA's monthly averaged SST during 1990-2019.
Let's take a look at how the SST around Japan changed before and after the three typhoons' passage. Figure 2-2 is a superimposed animation on minimum values of AMSR2 daily SST for successive five days (minimum values for the past five days including the relevant date) with cloud images every six hours by the Geostationary Meteorological Satellite "Himawari-8" from August 10 to September 10, 2020.
Around mid-August, there were many areas of high SST exceeding 30 ℃ from the East China Sea to the Pacific Ocean, but when Typhoon "BAVI" passed over the East China Sea in late August, the temperature decreased below 30 ℃ along the track of the typhoon. Continuously, when Typhoon "MAYSAK" passed through the area in early September, SST in the East China Sea around its storm track dropped even about 24 ℃. After that, we can clearly find the situation of further decease in SST over a wide area of the Pacific Ocean east side of the Nansei Islands of Japan, including Amami Oshima and Okinawa, along with the passage of Super Typhoon "HAISHEN".
It is said that SST decreases due to two main effects when a typhoon passes through. One is the effect that relatively cold seawater below sea level upwells to the sea surface mainly by the counterclockwise winds along with a typhoon. The other is the stirring effect of warm seawater on the sea surface and cold seawater beneath it by the strong typhoon winds. This time, due to very strong intensity of typhoon, winds are also strong with low pressure. Both effects were possible to contribute the decrease in SST. Since AMSR2 can observe the sea surface through clouds, the rapid changes in SST just before and after the typhoon passage could be captured.
Figure 2-2. Animation of AMSR2 SST (minimum values for the past five days including the relevant date) from August 10 to September 10, 2020. Superimpose cloud images every six hours (0:00, 6:00, 12:00 and 18:00 UTC) by "Himawari-8". Typhoon "BAVI" originated on the east side of Taiwan on August 21 and passed from Okinawa to the East China Sea from August 22 to 26. Typhoon "MAYSAK" originated in eastern ocean of the Philippines on August 28 and moved toward the north, passing from Okinawa to the East China Sea during August 31 and September 1. Super Typhoon "HAISHEN" formed near 145E degrees longitude over the far south of Japan on August 31, then moved in northwest, approaching the Okinawa and Kyushu regions from September 6 to 7.
These changes in SST associated with the passage of typhoons are also reproduced in ocean model. Figure 2-3 is an animation showing a comparison of the model output SST with AMSR2 SST by assimilating the satellite SST created by JAXA into JCOPE-T DA, a regional ocean model with a spatial resolution of about 3 km developed by the Japan Agency for Marine-Earth Science and Technology's (JAMSTEC). This data assimilation system was jointly developed by JAXA and JAMSTEC. Images and model SST data have been routinely released from the JAXA website since November 2018.
Six satellite SST products, observed from such as the Second-generation GLobal Imager (SGLI) onboard on AMSR2 and GCOM-C, "Himawari-8", and so on, are assimilated into this ocean model, and we can also see the decline of SST correspondence with typhoon passage in SST of model output.
Figure 2-3. Animation of SST at every six-hour (00:00, 06:00, 12:00 and 18:00 UTC) from August 10 to September 10, 2020 from the output of the ocean model assimilating satellite SSTs (right) and daily AMSR2 SST (left). AMSR2 SST is the same data as Fig. 2-2 but adjusted to the same region and color bar as the ocean model.
Figure 2-4 shows SST output from ocean model and the vertical cross sections of water temperature below the sea surface along red lines. The vertical water temperature profile on the right shows the change in water temperature from the ocean surface (SST) to a depth of 500 m at the intersecting point of red cross lines in the left figure. In the ocean area where Super Typhoon "HAISHEN" was passing through, we can see the ocean status that the water temperature was mixed to depths reaching 100 meters below surface. By combining satellite data and ocean model, we can get information on undersea which cannot be observed from satellites alone.
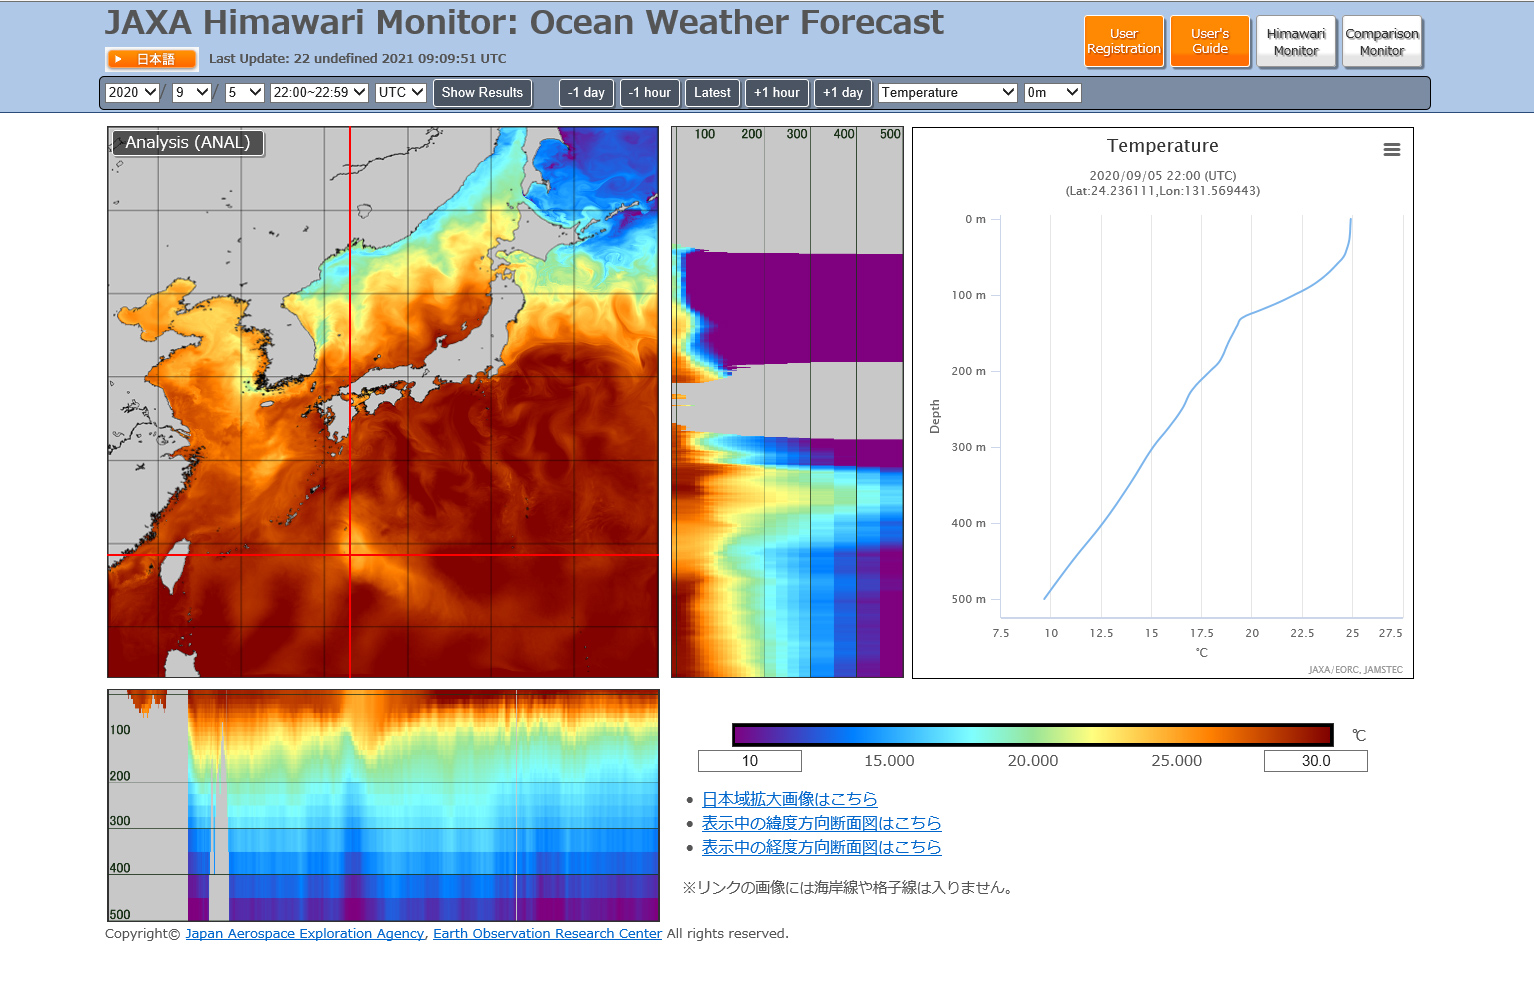
Figure 2-4. SST from the ocean model and vertical sections of water temperature along latitude and longitude indicated by red lines on September 5, 2020 22:00-22:59 (UTC). The vertical water temperature profile at intersection of red lines within the affected area of Super Typhoon "HAISHEN" is shown on the right.
This year's typhoon season is not over yet. Although the SST near Japan had moderated compared with high season, that in the south of Japan still shows high temperature, above 28 ℃. As of September 23, 2020, Typhoon "DOLPHIN" (T2012) occurred in the far south of Japan on September 20 is forecasted to approach Kanto-Koshin region from September 24 to 25. It has possibility to bring heavy rainfall in eastern Japan along with activation of the autumn rainy front. Please pay considerable attention to future information. JAXA/EORC releases the satellite observation information in near-real-time on "Tropical Cyclone Real-Time Monitoring", "JAXA Global Rainfall Watch" and "AMSR Earth Environment Viewer", also ocean model information on "JAXA Himawari Monitor: Ocean Weather Forecast". Please refer to these websites.
(Reference) Characteristics of SST observation by satellites
Radiometers with infrared wavelengths, such as onboard on "Himawari-8" or "GCOM-C", have a long history of SST observation from satellites. It has high spatial resolution (for example, spatial resolution of "Himawari-8" is 2 km and that of "GCOM-C" is 250 m) and the detailed observations close to the coast is possible. However, in case there are clouds above, it cannot observe SST below them.
On the other hand, the microwave radiometer onboard "GCOM-W" uses 6-10 GHz microwave band. Even if there are clouds above, it can penetrate them and observe the SST under clouds. Unfortunately, it is not possible to estimate SST in case of heavy rainfall, and the spatial resolution is coarser compared with infrared radiometers (30-50 km spatial resolution by AMSR2). However, since the most of parts of the typhoon clouds has no rainfall, the microwave radiometer can capture the decrease of SST when a typhoon passes through.
Therefore, observations of SST by infrared and microwave radiometers, which have different strengths and weaknesses, can complement each other. Satellite SSTs with not only single observation but also a combination of multi-sensor observations, such as input to a numerical model, can be utilized depending on the users' purposes and applications.
Explanation of the Images
Figure 1-2, 2-2, 2-3
| Satellite | Global Change Observation Mission - Water "SHIZUKU"(GCOM-W) |
|---|---|
| Sensor | Advanced Microwave Scanning Radiometer 2 (AMSR2) |
| Date | August 25, 2020 04:55 UTC (Figure 1-2. left) September 1, 2020 05:01 UTC (Figure 1-2. center) September 5, 2020 04:35 UTC (Figure 1-2. right) August 10 - September 10, 2020 (Figure 2-2., Figure 2-3.) |
Figure 2-2, 2-3 (Cloud images)
| Satellite | Geostationary Meteorological Satellite "Himawari-8" |
|---|---|
| Sensor | Advanced Himawari Imager (AHI) |
| Date | August 10 - September 10, 2020 00:00, 06:00, 12:00, 18:00 (UTC) |


