Seen from Space 2014
Public Data Release of the Global Precipitation Measurement (GPM) Core Observatory
|
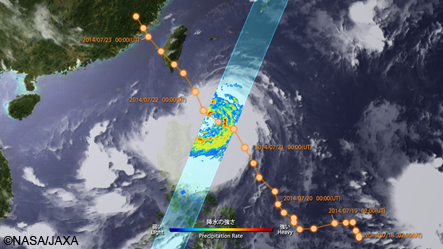
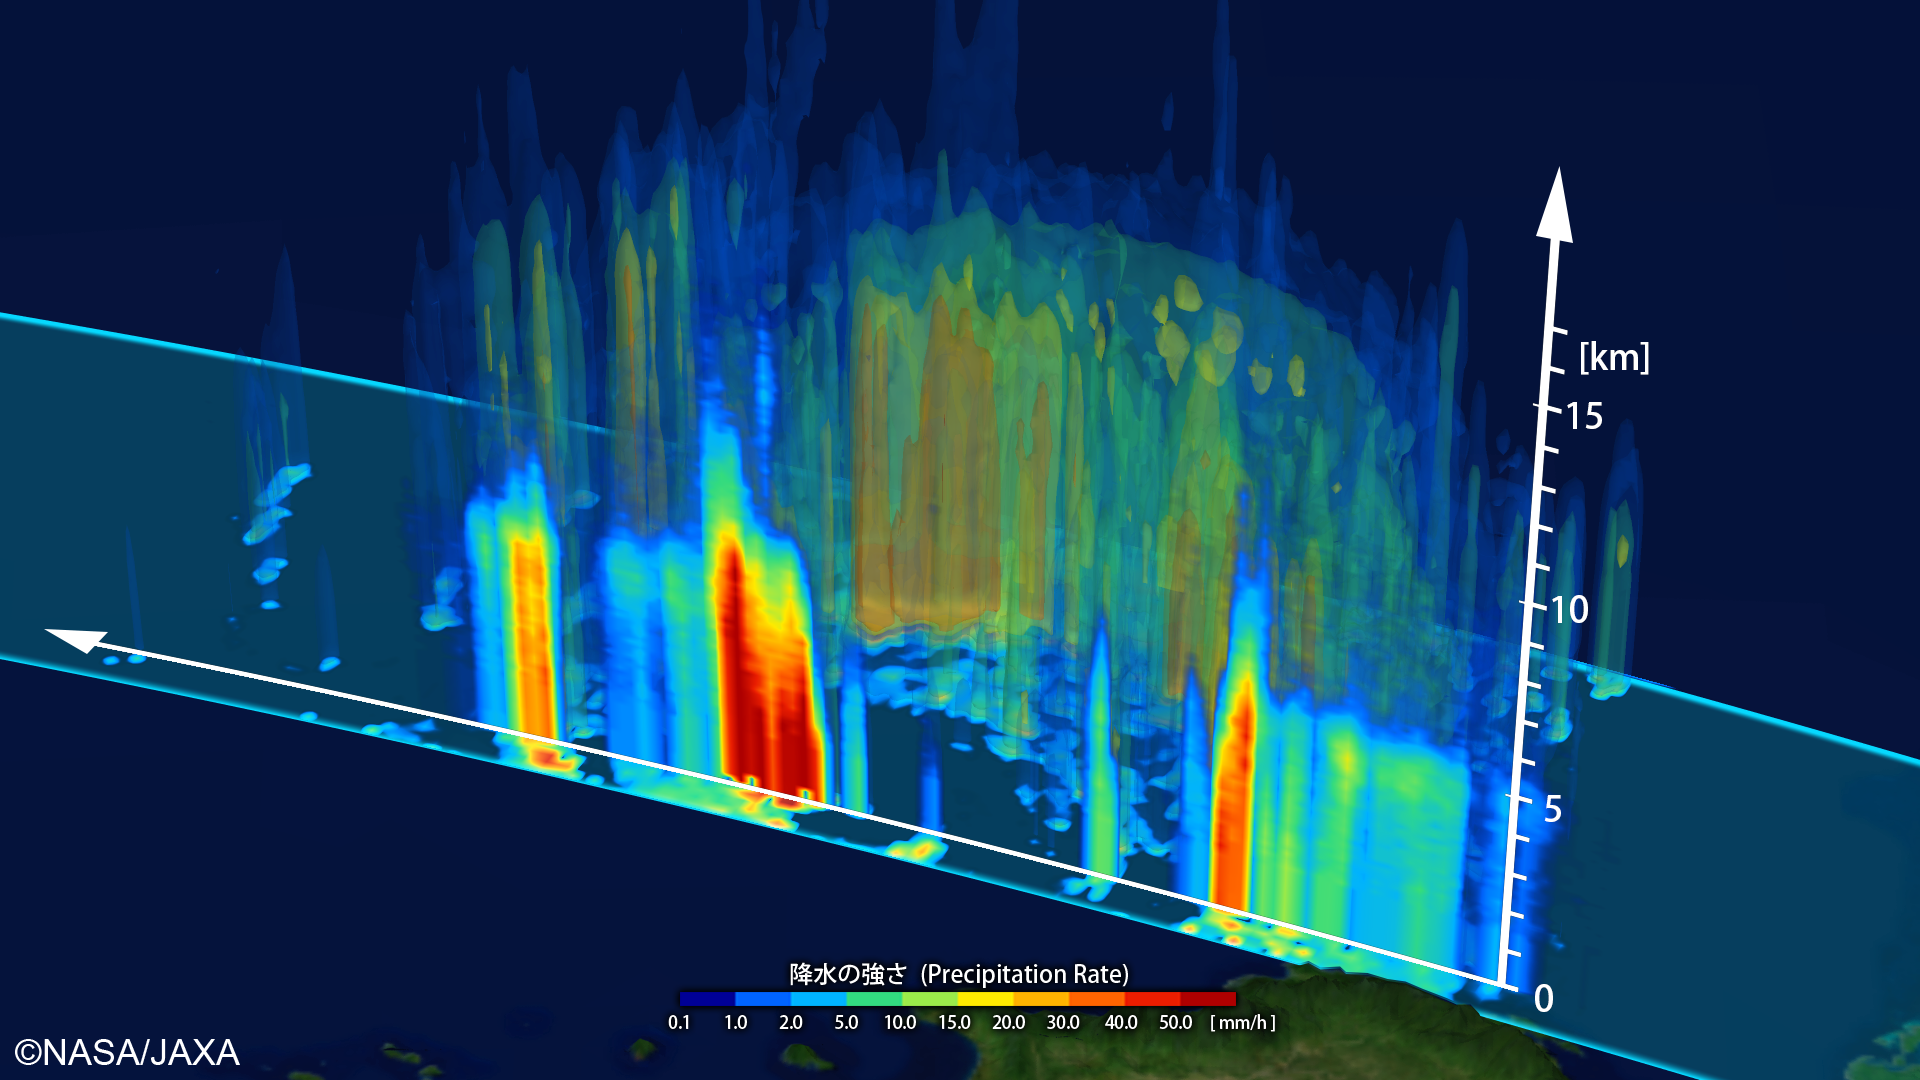
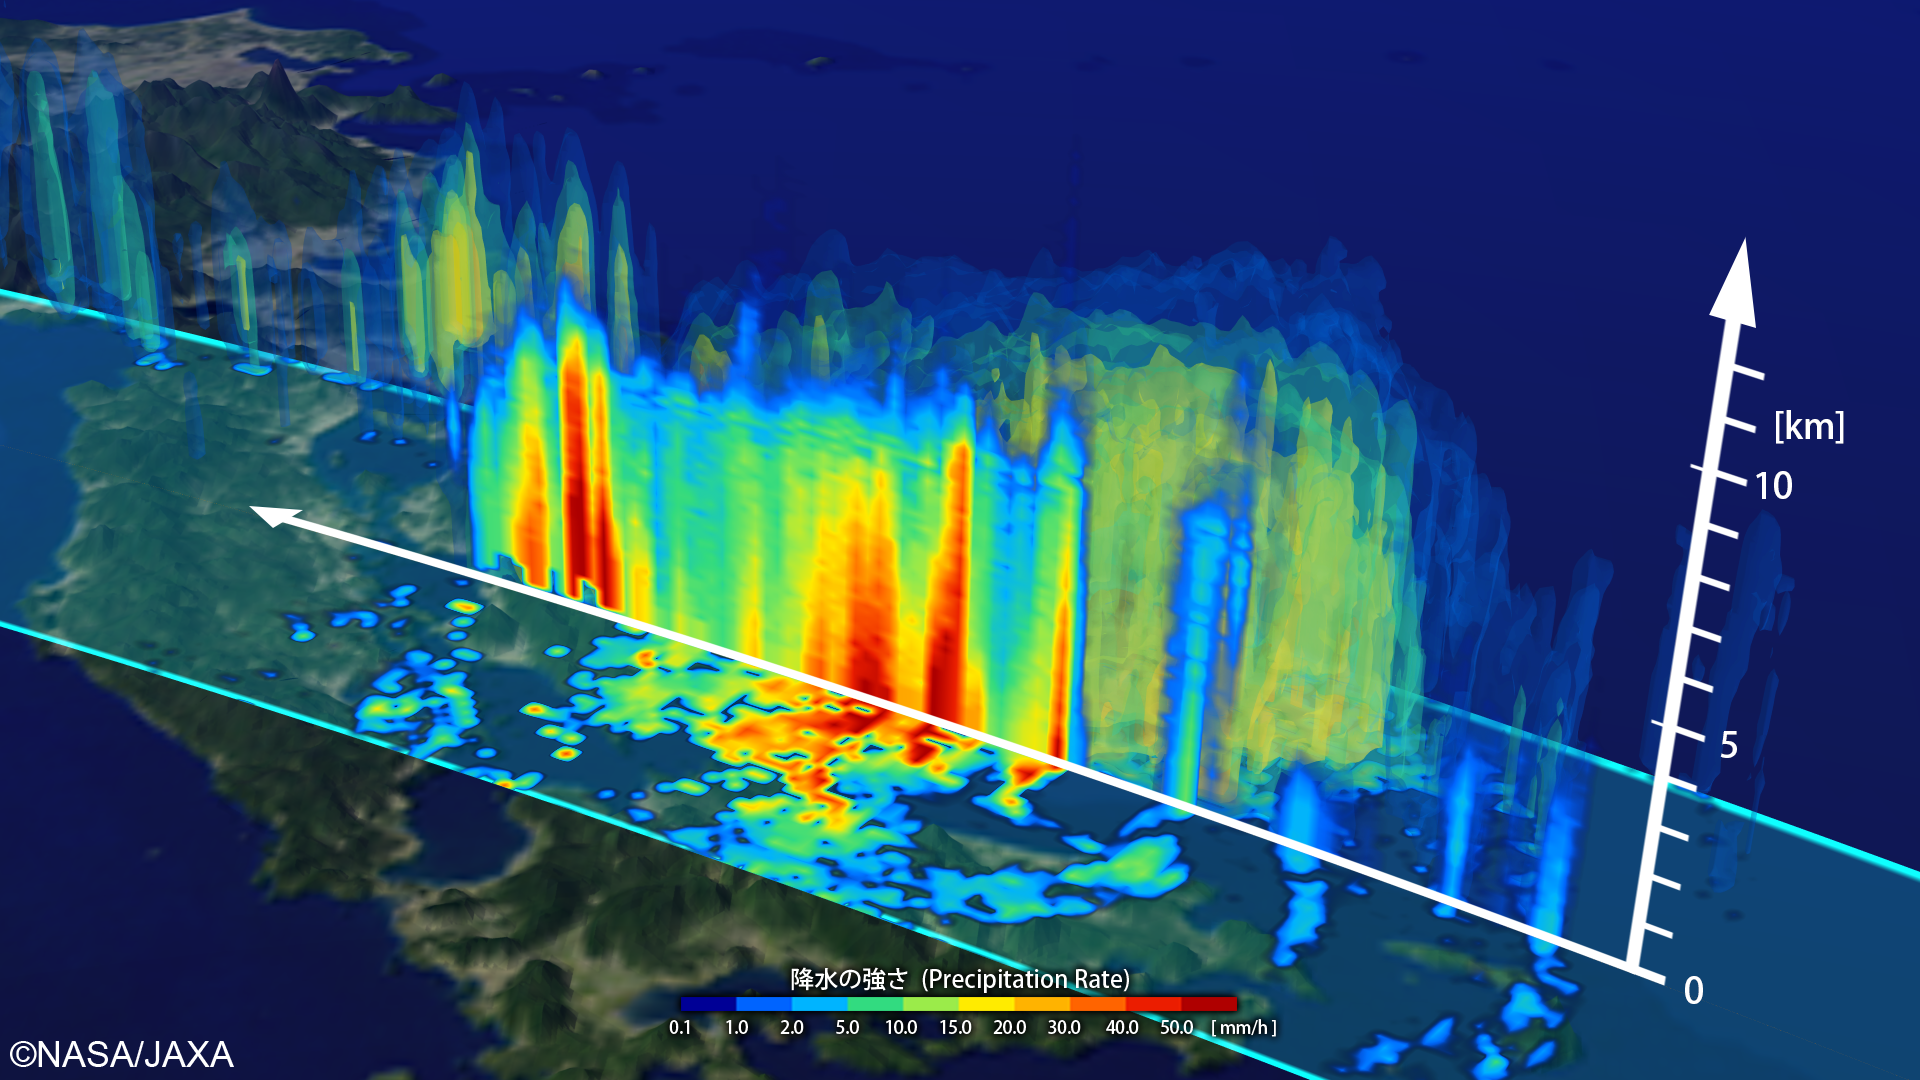
Japan Aerospace Exploration Agency (JAXA) has started public data release of the Global Precipitation Measurement (GPM) Core Observatory, which is jointly developed with the National Aeronautics and Space Administration (NASA), since September 2, 2014. The GPM Core Observatory, also known as "Flying Rain Gauge", is focused on precipitation observation from space, and carrying the Dual-frequency Precipitation Radar (DPR) developed by Japan. JAXA has completed calibration activities during initial calibration/validation phase to improve data accuracy, and started data distribution to the public through the JAXA's Earth Observation satellite data distribution service, G-Portal. DPR products consist of radar reflectivity and retrieved precipitation parameters obtained by DPR onboard the GPM Core Observatory. DPR radar reflectivity product (Level 1) was developed by JAXA, and DPR precipitation product (Level 2 and 3) was jointly developed by JAXA and NASA. Figure 1 is DPR observation of three dimensional precipitation system of Typhoon No.10 "MATMO" developed in the east of the Philippines at 15Z on July 21, 2014. In this observation, top of precipitation system is about 15km height, and system was well-developed and had big eye of typhoon. Two days later, Typhoon No.10 landed to the Taiwan Island. Figure 2 is another DPR three dimensional observation of Typhoon No.11 "HALONG" at 10Z on August 9, 2014. Typhoon No.11 landed to Kochi Prefecture, Japan at 21Z on August 10, and DPR observation clearly captured swirling three dimensional structure of typhoon No.11 before landing. Figure 3 is movie of Typhoon No.11 captured by the GPM.
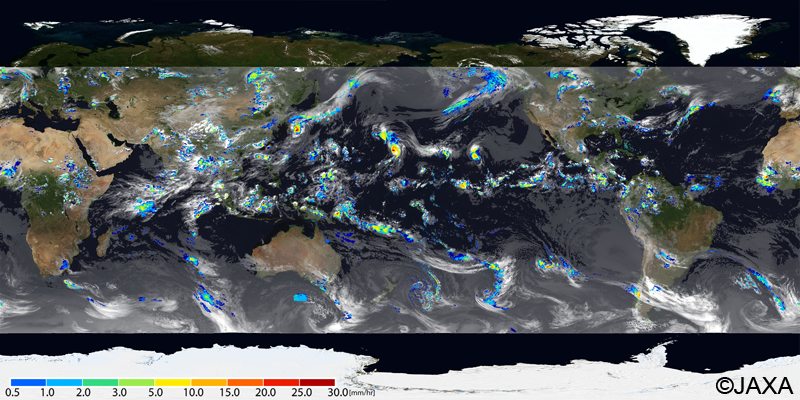
Global Rainfall Map (GSMaP) product is global rainfall distribution combining data from the GPM Core Observatory and Constellation satellites, which are operated by the international GPM partners, and developed by JAXA. JAXA's Global Change Observation Mission – Water (GCOM-W or "SHIZUKU") satellite, which was launched in May 2012, is also participating to the GPM mission as one of constellation satellites. GSMaP product is 0.1 degree latitude/longitude grid (about 10km grid around the equator) with hourly resolution and provided to users four hour after observation. In addition to satellite only rainfall product, rainfall calibrated by ground-based rain gauge data is also provided to users about three days after observation. Figure 4 is hourly global rainfall distribution by GSMaP at 18Z on August 19, 2014.
The GPM products enable us to understand global precipitation, including rain and snow, more accurately, and will be used to improve accuracy of weather forecast through data assimilation (*1) and storm track forecast in meteorological agencies in the world, and countermeasures for floods in developing countries. GPM products can be downloaded by anyone who made user registration at the JAXA's Earth observation satellite data distribution system "G-Portal". The DPR products are also distributed by NASA. Observation data by the GPM Microwave Imager (GMI) on board the GPM Core Observatory, and other microwave imager data provided by the GPM Partners are already available to the public. For more information regarding the Global Precipitation Measurement (GPM) mission, please visit following web sites. Explanation of the Images:
GPM-GSMaP, which is a new version of the JAXA Global Rainfall Watch, is hourly global rainfall product merging data from the GPM Core Observatory, GMI, and multi-satellites, including TRMM/TMI,GCOM-W/AMSR2, DMSP series SSMIS, NOAA series AMSU, MetOp series AMSU, and Geostationary IR. Background cloud images are globally merged IR data produced by NOAA Climate Prediction Center (CPC), using IR data observed by JMA's MTSAT satellite, NOAA's GOES satellites and EUMETSAT's Meteosat satellites. Related Sites: |