Seen from Space 2011
Drop in sea surface temperature after the passage of typhoon
 Fig. 1. Track of Typhoon #6 (Ma-on) and sea surface temperature (July 11–July 25, 2011)
AMSR-E (Advanced Microwave Scanning Radiometer for EOS), which has been developed by Japan Aerospace Exploration Agency (JAXA), is on board the NASA Earth-observation satellite, Aqua. Figure 1 shows the sea surface temperature from July 11, 2011, to July 25, 2011. The temperature shown is the average temperature over three days. The temperatures around the red and blue areas are about 30°C and less than 20°C, respectively. It can be clearly observed that the sea surface temperature in the southern area is high and that in the northern area is low. The black area shows a land area or area for which no data is available due to rain. The white area in the image shows clouds. This image was created from the data obtained by the Japanese geostationary satellite, Multi-functional Transport Satellite (MTSAT). The track of Typhoon #6 (Ma-on) approaching and passing Japan can be seen in this image. Typhoons cause disasters in the form of heavy rains, floods, and strong winds. On the other hand, typhoons are a source of water. Typhoon #6 originated near the South Torishima area on the evening of July 12, 2011. It developed gradually and proceeded toward the west. It developed rapidly on the midnight of July 16, 2011, and then turned its course toward the north. It maintained its intensity and attacked Kyushu and Shikoku districts. It caused heavy rain along the Pacific seaboard of Kyushu and Shikoku districts, and the Kii Peninsula. 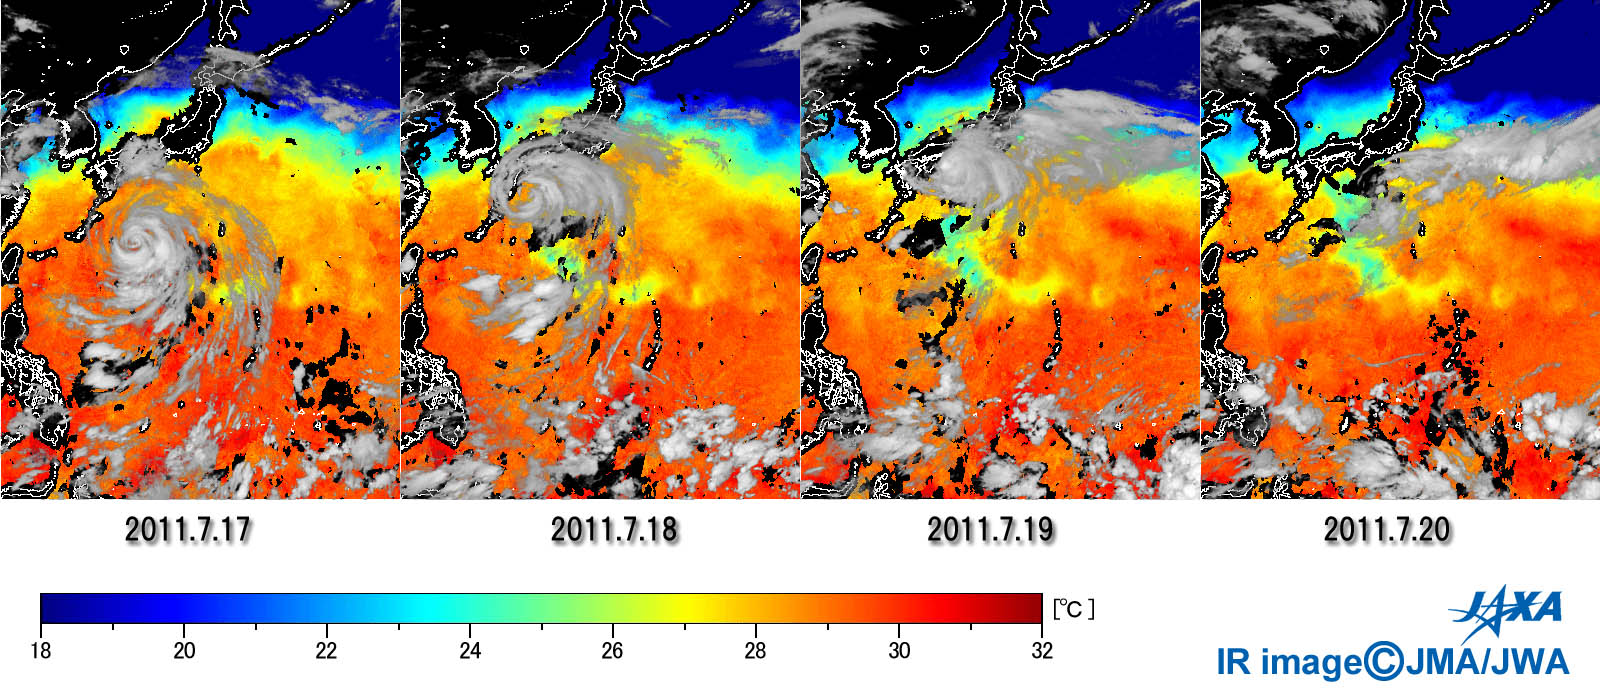 Fig. 2. Sea areas where the sea surface temperature dropped

Drop in sea surface temperature after the passage of typhoonA microwave scanning radiometer can detect the sea surface temperature in an area even when clouds are covering the area. Figure 2 shows the time series of sea surface temperature from July 17 to July 20, 2011, when the typhoon passed Kyushu and Shikoku districts, and the Kii Peninsula. The drop in the sea surface temperature over a wide area along the track of the typhoon can be observed. This drop was caused by the upstream movement of the seawater. The counterclockwise movement of the typhoon wind caused the cold seawater below the sea surface to move up. Strong wind stirred the warm surface seawater and the cold seawater below the surface. This strong typhoon caused a drop of 3–4°C in the sea surface temperature.
Name of typhoonsThe typhoon committee comprising 14 countries and areas, including Japan, has named the typhoons that have originated in the northern Pacific Ocean or the South China Sea since 2000. Each member country listed 10 names for the typhoons, and each typhoon was given a name according to this list of 140 names. When all the names are exhausted, the same list is used again. When a certain typhoon causes serious damage, its previous name will not be used again. The name Ma-on (saddle of the horse) was proposed by Hong Kong, and it is the name of a mountain. *AMSR-E observation halted Reference URL:Explanation of the Images:
|