Seen from Space 2009
IBUKI(GOSAT) "First Light"
|
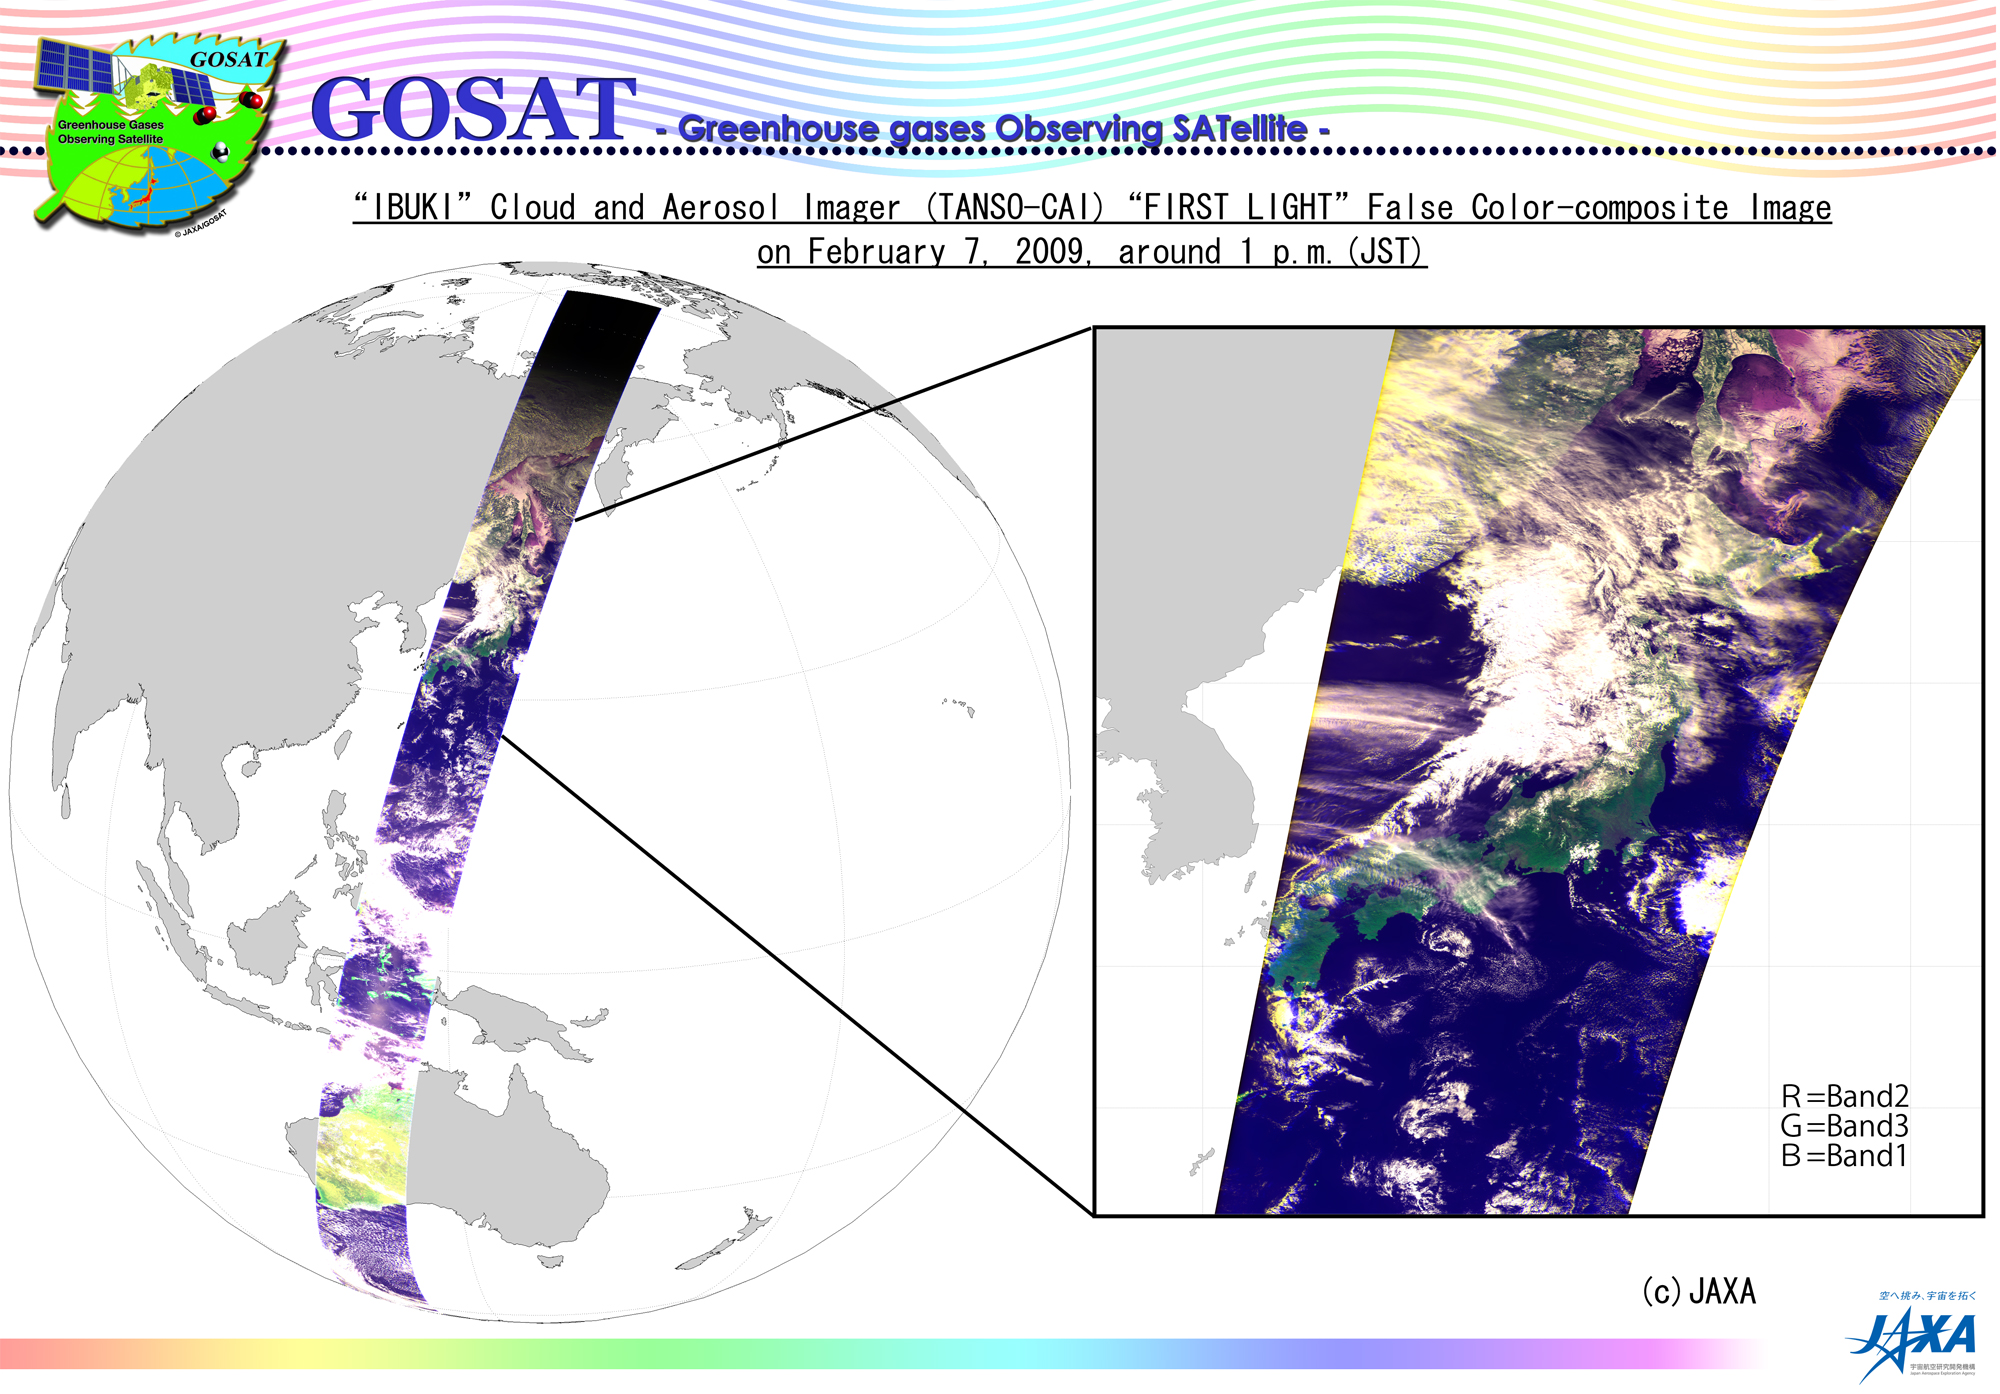
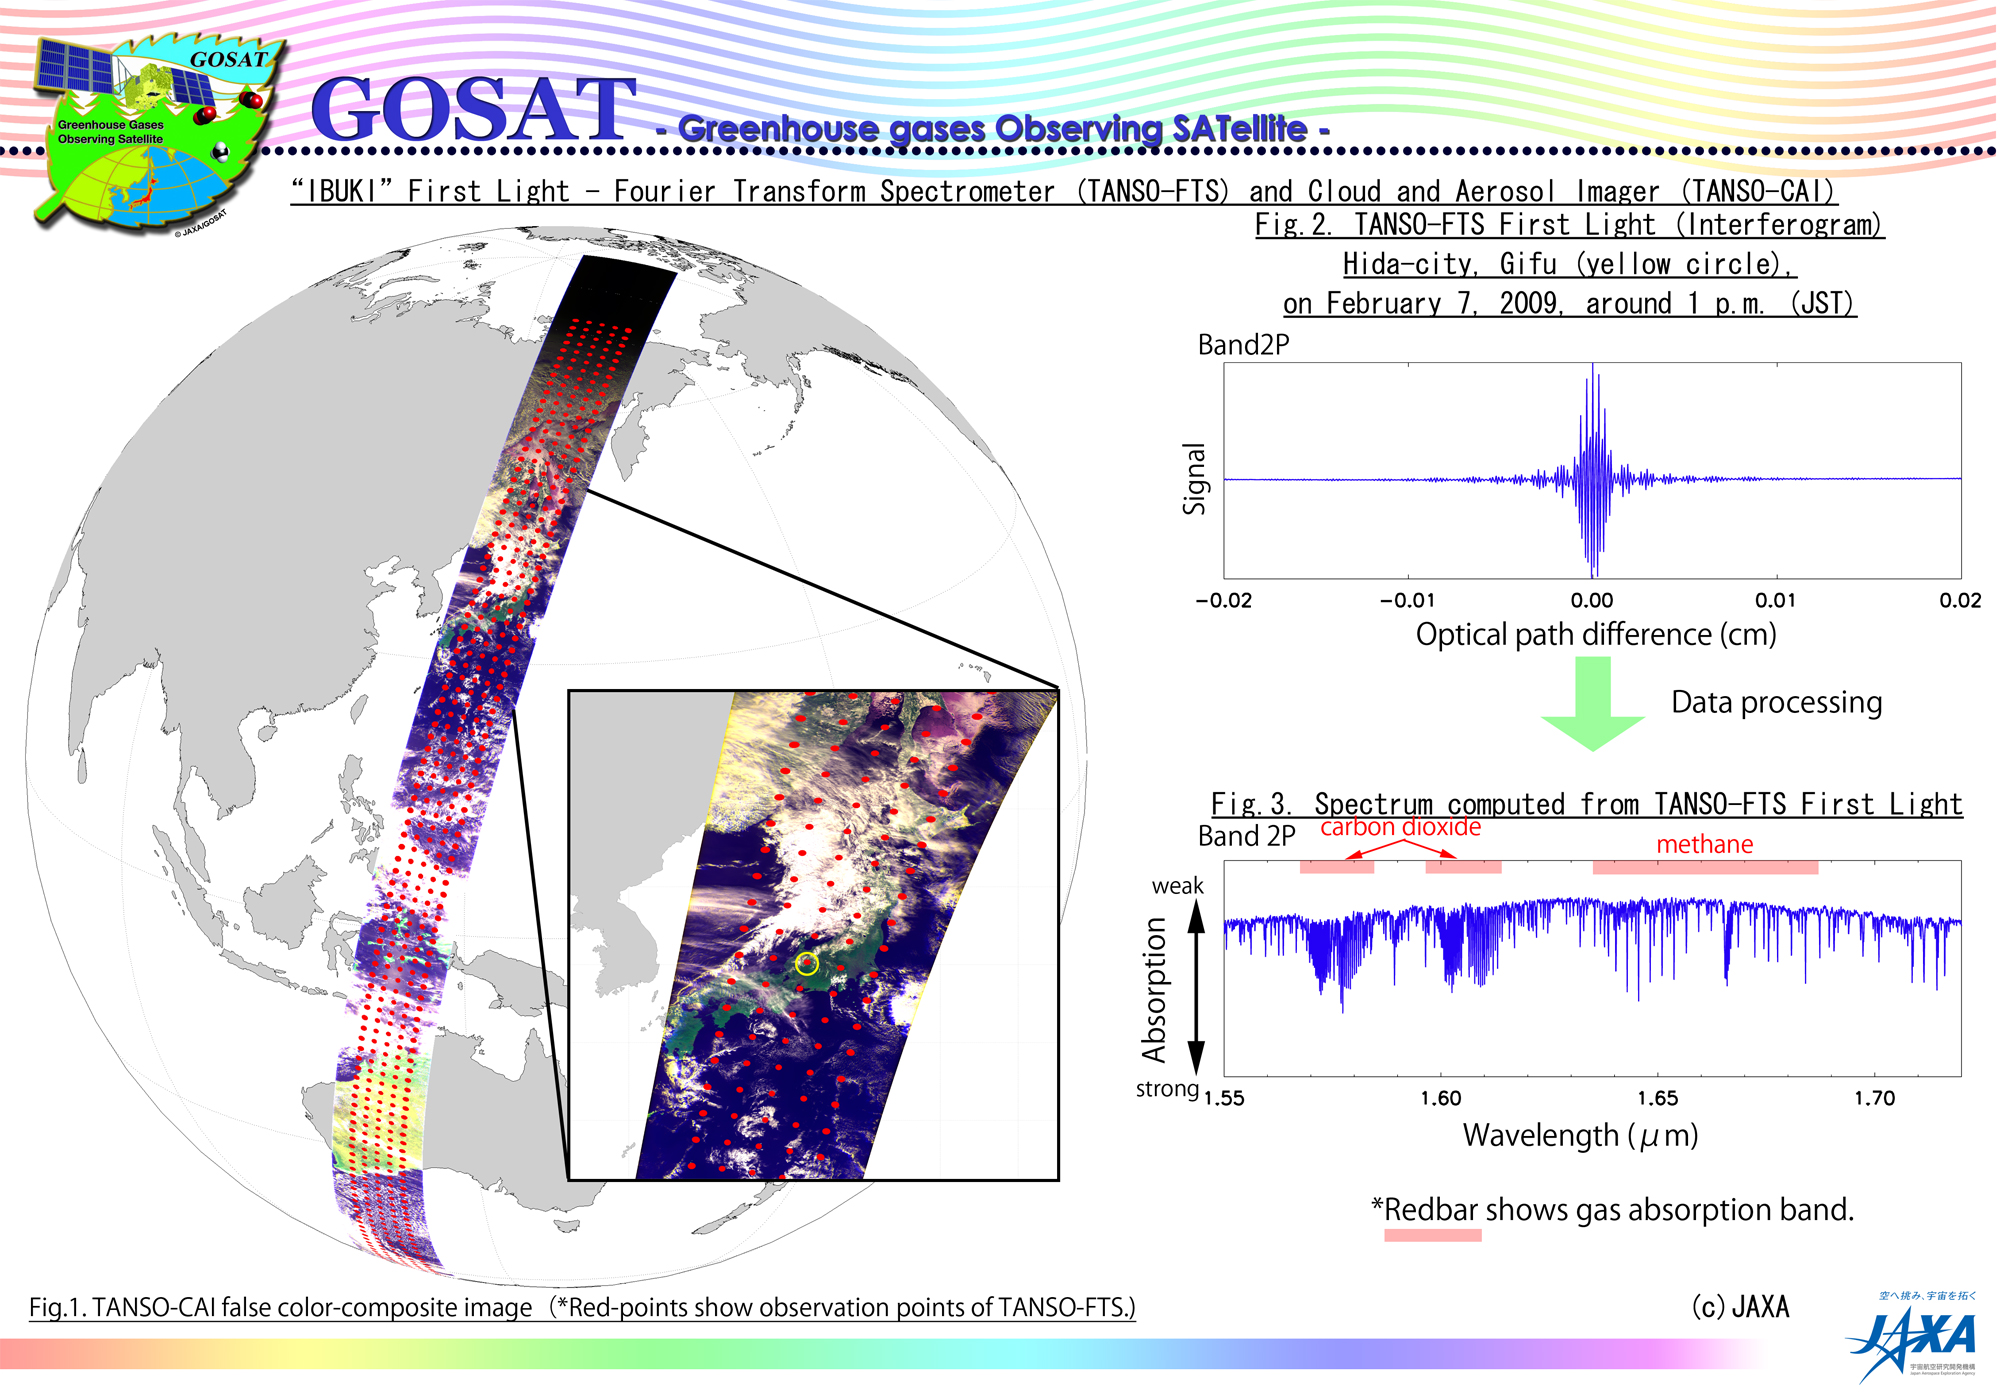
The Japan Aerospace Exploration Agency (JAXA) would like to announce that we successfully acquired the "First Light" by the Greenhouse Gases Observing Satellite "IBUKI" (GOSAT) during the course of its initial functional check. The data was acquired by the onboard sensors of the IBUKI, the Fourier Transform Spectrometer (TANSO-FTS) and the Cloud and Aerosol Imager (TANSO-CAI), which were just activated. The IBUKI was launched by JAXA at 12:54 p.m. on January 23, 2009, (Japan Standard Time, JST) from the Tanegashima Space Center. Its initial functional check, including checking the attitude control system and communication system, has been carried out on schedule, and the satellite is in good condition. The attached images show the observation results by the TANSO FTS and TANSO-CAI when the IBUKI passed over Japan at around 0400 on February 7, 2009 (UT). We will continue to carry out the initial functional check, which is scheduled to be completed in three months after its launch. JAXA, the National Institute for Environmental Studies (NIES), and the Ministry of the Environment (MOE) will then cooperatively carry out the initial calibration and validation operations including comparing IBUKI data and data acquired on the ground, confirming the data accuracy, and making compensations based on the data. Fig. 1: "First Light" of the TANSO-CAI (False Color-composite Image) aboard the IBUKI Fig. 2: IBUKI's "First Light" - the TANSO-FTS and TANSO-CAI Fig. 3: Spectrum from the TANSO-FTS onboard the IBUKI Fig. 4: Comparison of IBUKI observation data with simulation data
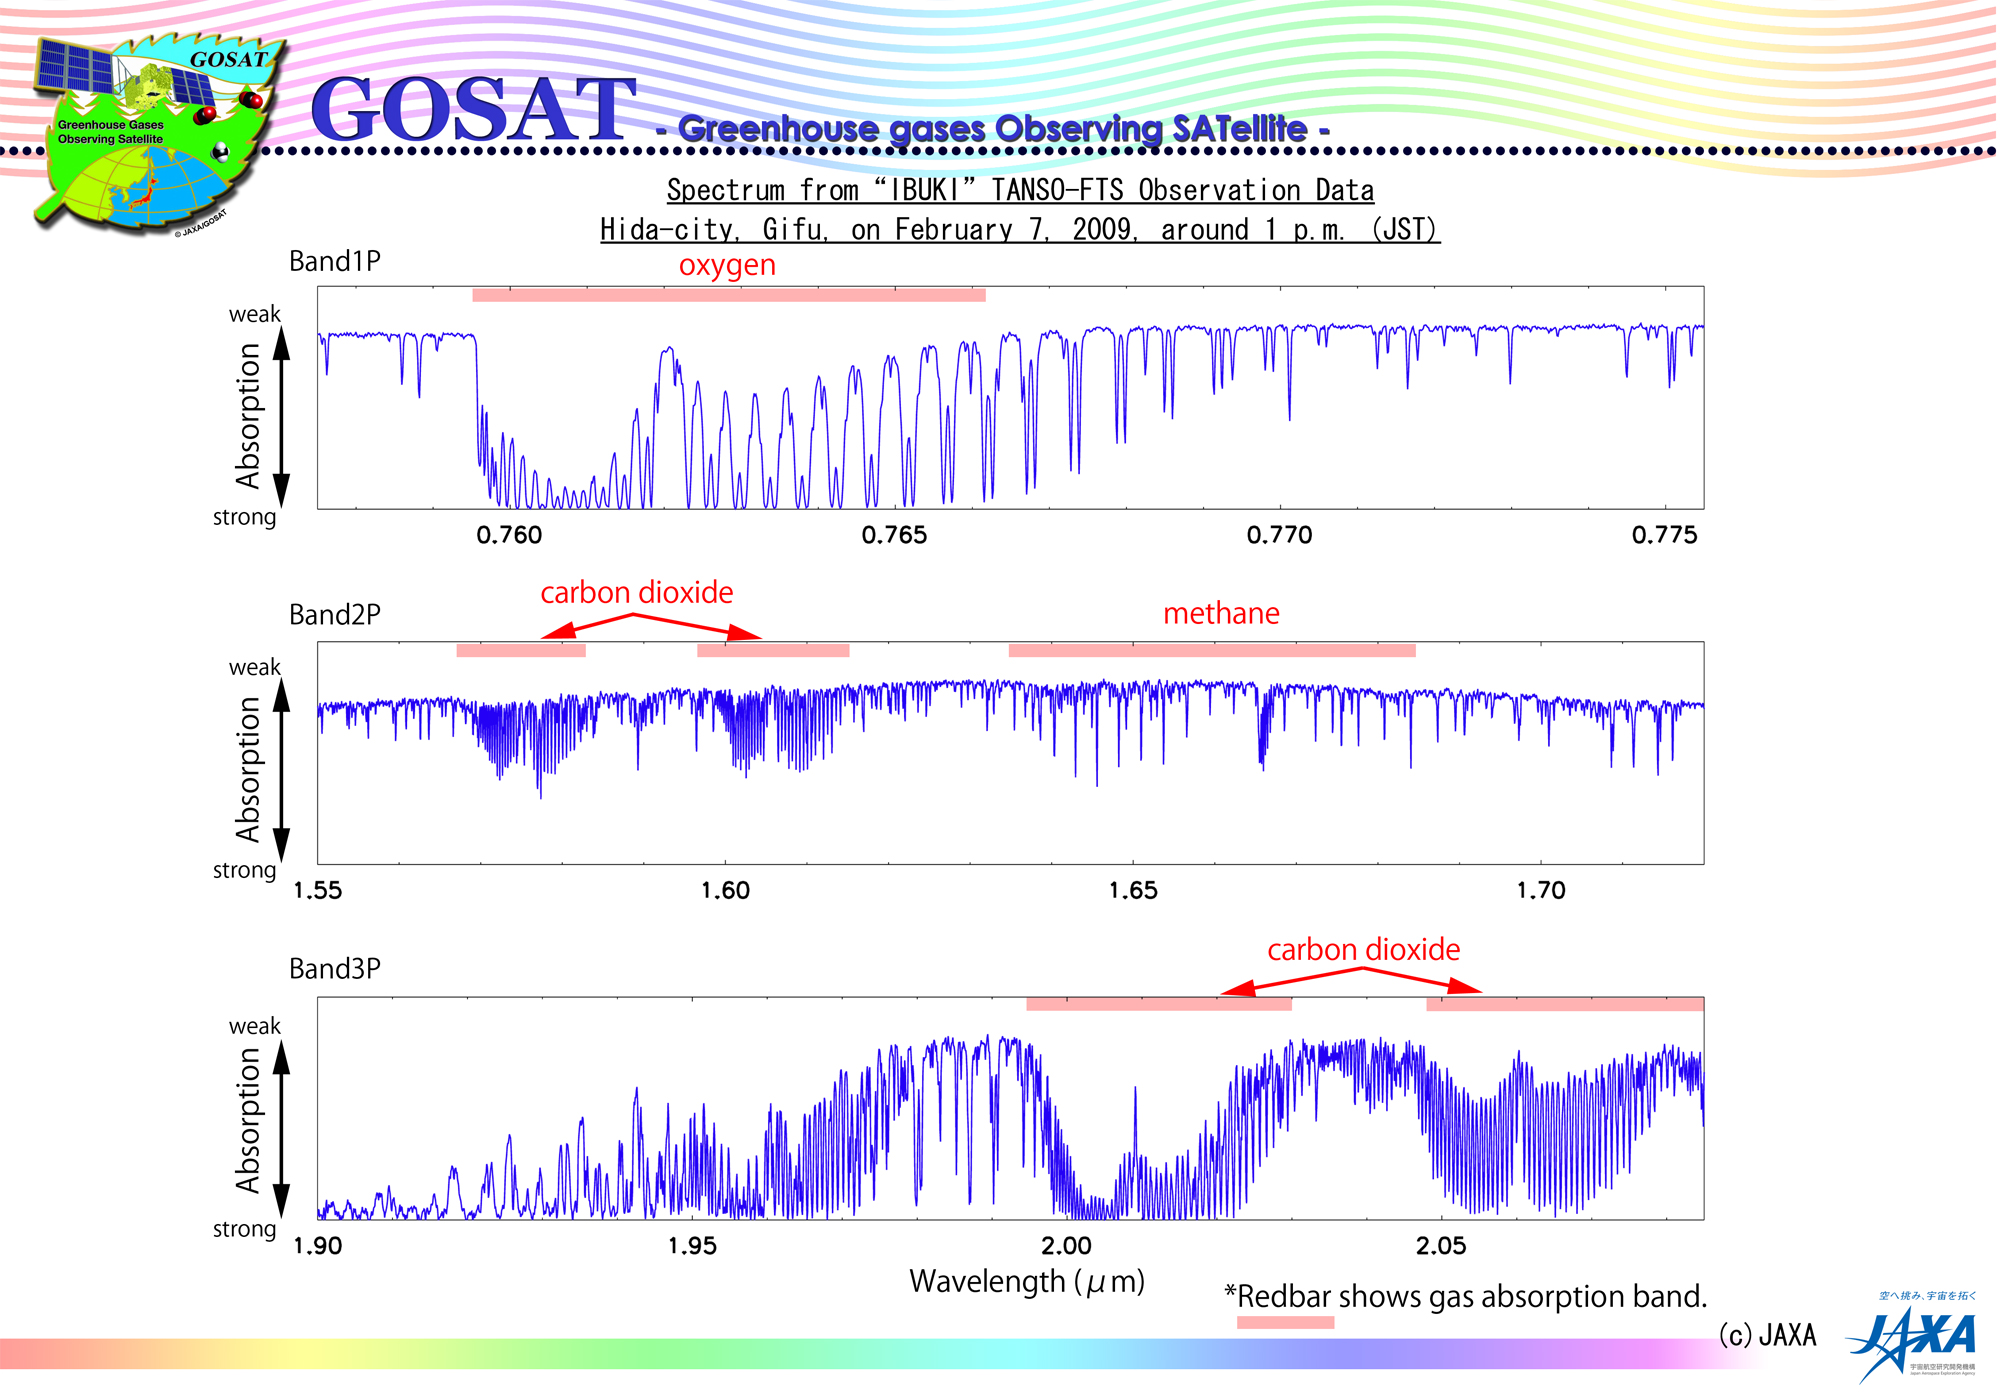
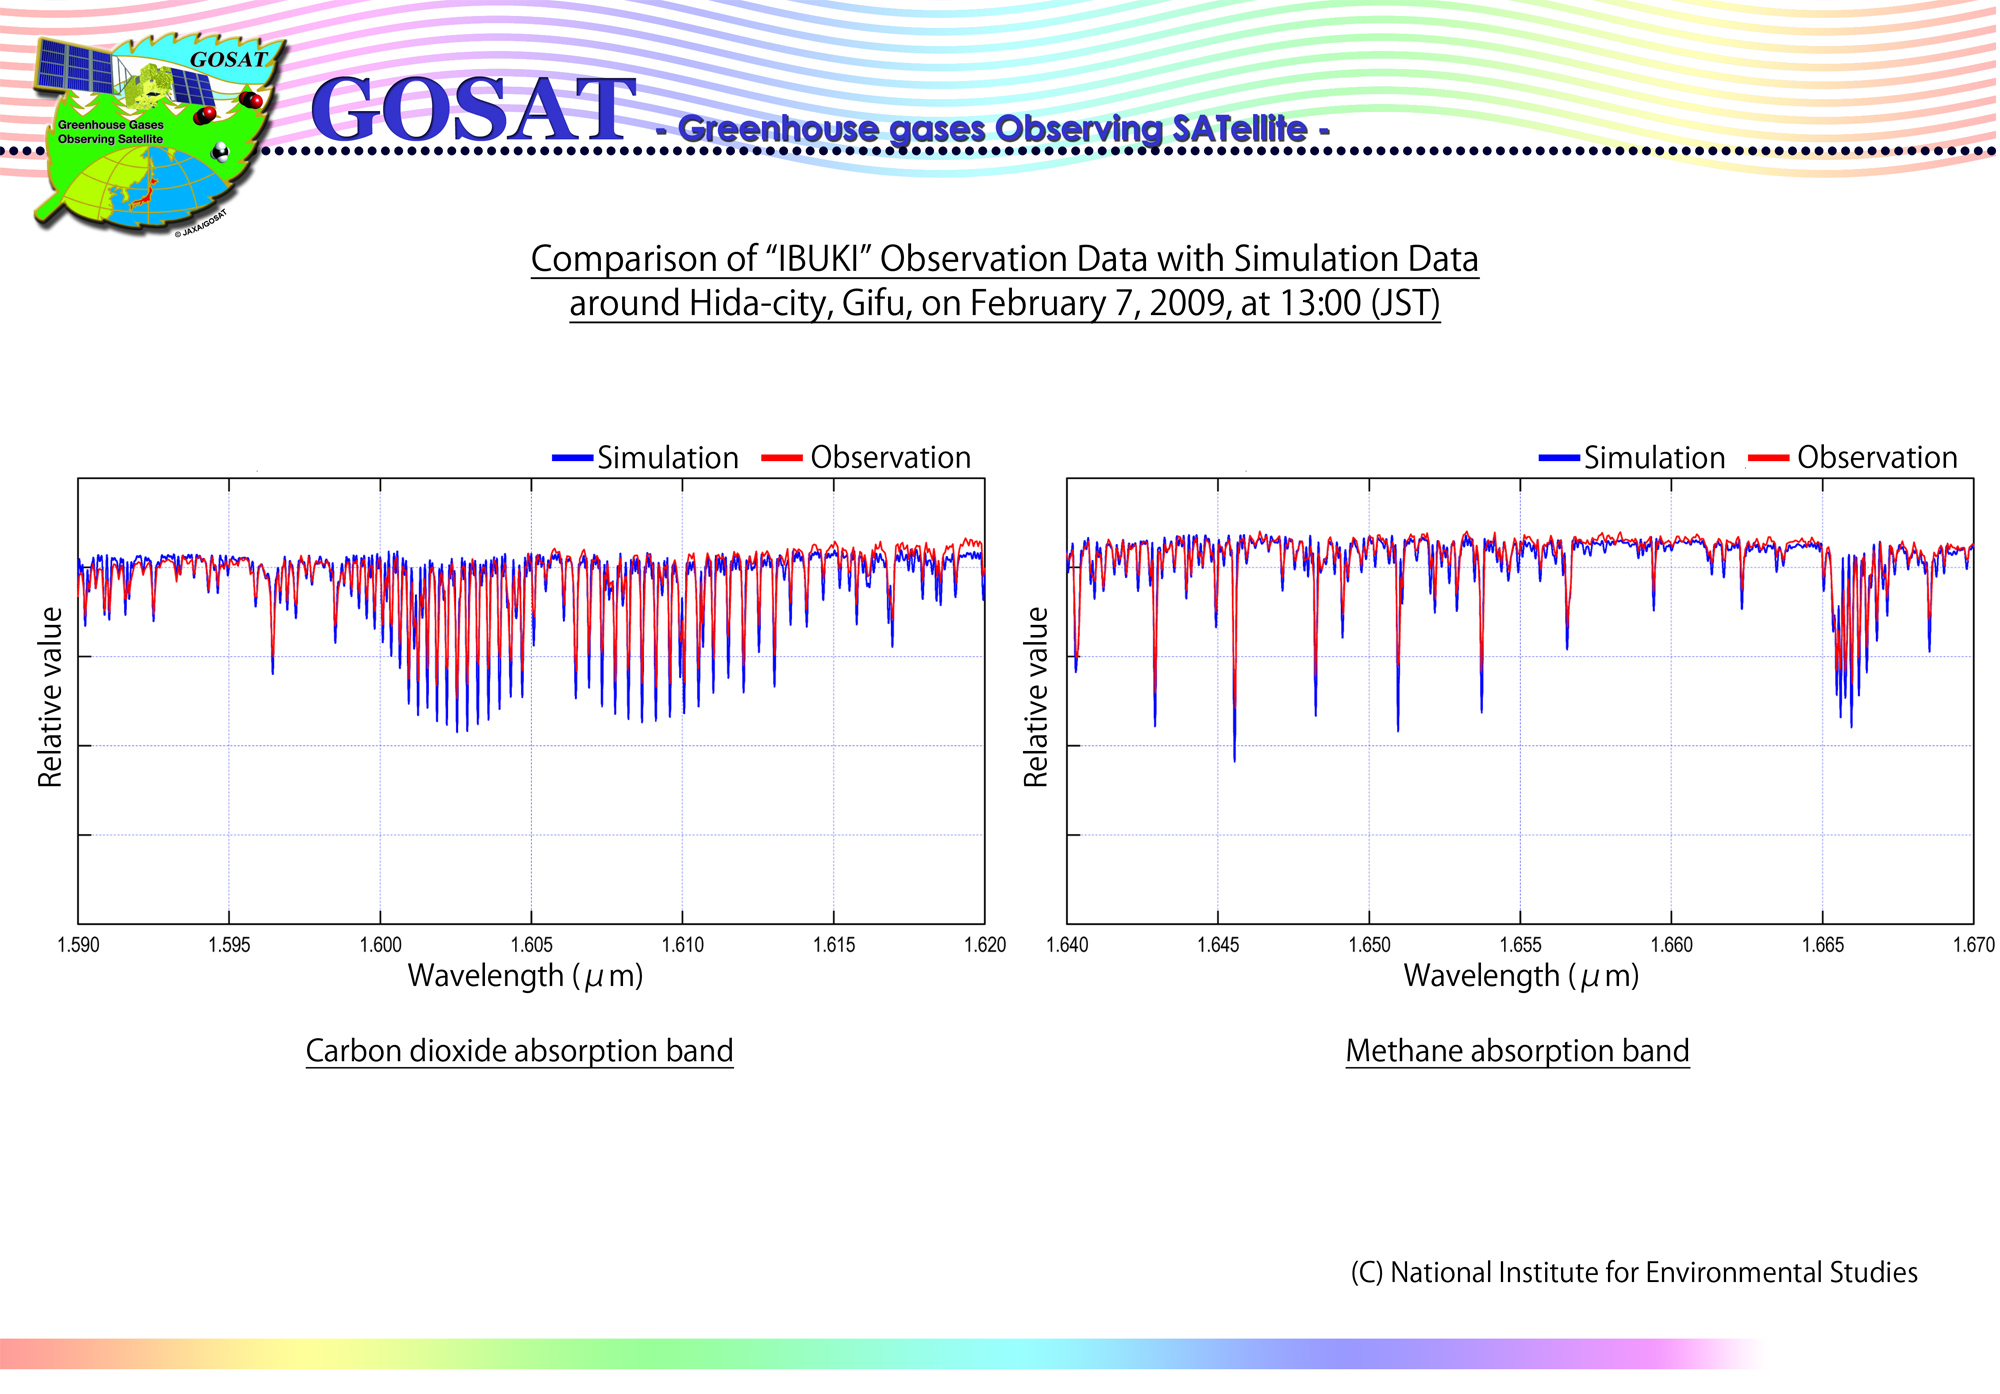
Top right image of Fig. 2 shows the "FIRST LIGHT" (Interferogram) taken by the TANSO-FTS aboard the "IBUKI". Bottom right image of Fig. 2 shows the light intensity of each wave length (spectrum) obtained from "First Light" data in top right image of Fig. 2. Greenhouse gases (Carbon dioxide and Methane) have the characteristics to absorb infrared signal at specific wave lengths. When Greenhouse gasses are concentrated in greater volumes, absorption becomes stronger and light intensity becomes weaker. This figure shows that each absorption line is clearly separated and identified. This data is virtually identical to the simulation data by National Institute for Environmental Studies (NIES) (Shown in Figure .4). This shows that the functions of the TANSO-FTS was confirmed nominal as designed. Calibration and Validation activities will be conducted in order to confirm the data accuracy and to compensate the characteristics of the instruments.
When Greenhouse gasses are concentrated in greater volume, absorption becomes stronger and light intensity becomes weaker. Band 4 data will be taken after the functional check of the detector cooler. Band 1, 2 and 3 data was taken this time.
The results of the comparisons between both of them show that the positions of the absorption lines of the observation data match those of the simulations, and we could confirm that the spectroscopic performance of the TANSO-FTS was as designed. We will evaluate the accuracy of the relative intensity of each spectrum from the calibration activities performing the comparison with the data measured by other instruments on the ground. * This simulation used the vertical profile of the temperature, pressure and water vaporobtained by the sonde above the region near the observation area of the "IBUKI" and the vertical profile of the methane obtained from the standard model of the atmosphere under the assumption that the concentration of the Carbon dioxides and the methane is 390 ppm and 1.74 ppm individually.
|