Seen from Space 2008
Various aerosols across the Pacific Ocean
| |
 |
 |
 |
 |
 |
 |
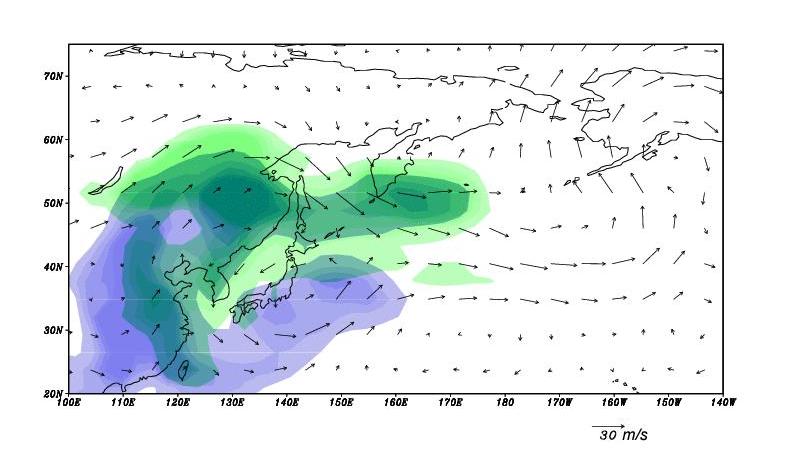
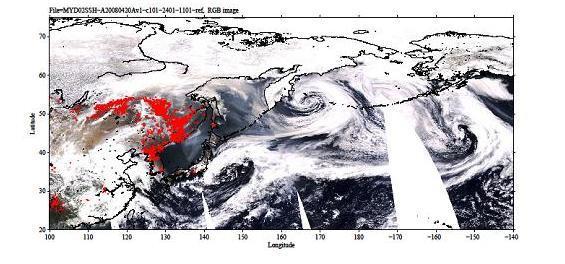
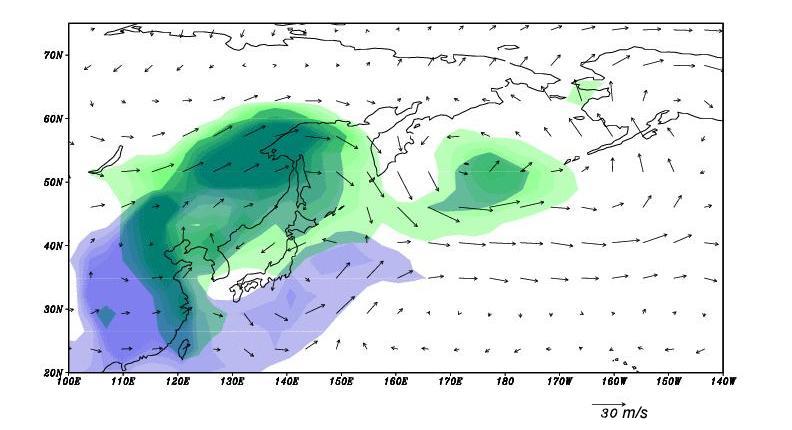
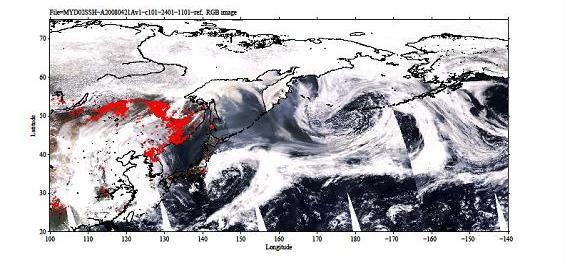
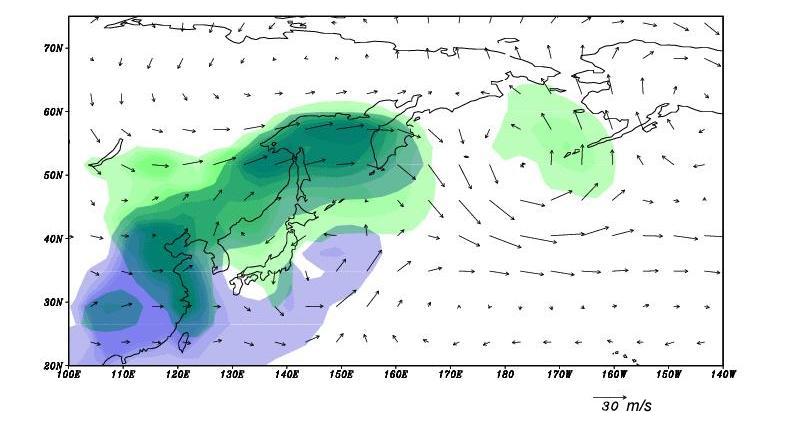
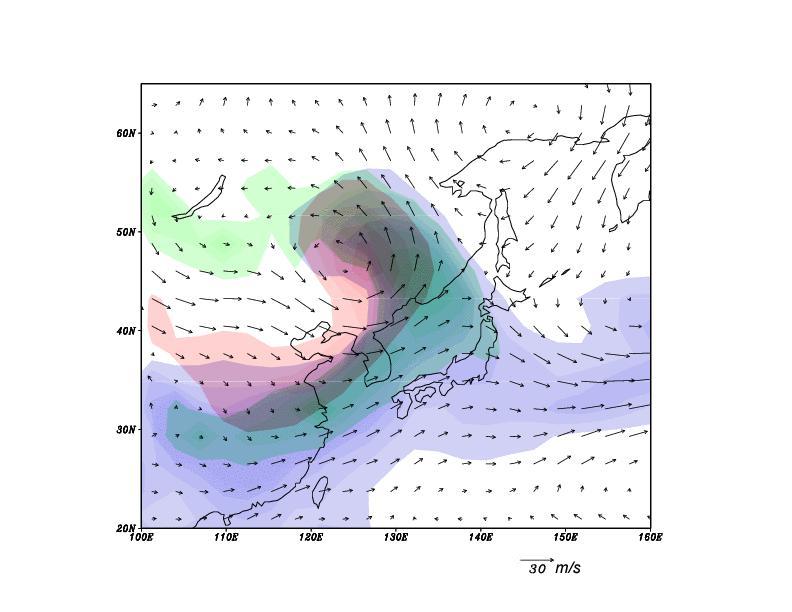
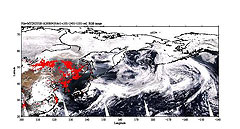
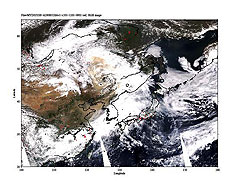
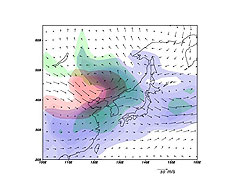
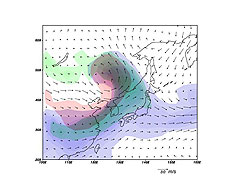
Fig. 1. Area of forest fires (left), Distribution of aerosols and wind (right)
Apr. 19 2008(top)
Apr. 20 2008(center)
Apr. 21 2008(bottom)
|
In April 2008, forest fires occurred frequently along the border between Russia and China. Satellite images for April 19 to 21 (left column in Fig. 1) indicate possible areas of fires (red dots). We can also see the smoke from forest fires spreading from Siberia to the Korean Peninsula, Sakhalin, and northern Japan.
The smoke is composed of fine particles called aerosols. Aerosols originate from forest fires, fossil fuel consumption, sand storms, and so on.
A general circulation model is used in order to investigate the kind of aerosols included in the smoke. The amount of aerosols emitted by a forest fire is estimated from satellite data. The general circulation model then uses this as input data and determines the aerosol transport process.
The right column in Fig. 1 indicates the aerosol distribution calculated by the model simulation. Green represents forest fire aerosols, and blue, fossil fuel burning aerosols. In East Asia, a huge amount of fossil fuel burning aerosols is emitted throughout the year. A mixture of these fossil fuel burning aerosols and forest fire aerosols is moved. Furthermore, the simulation indicates that forest fire aerosols are transported around Alaska. Such long-distance transportation seems to be due to the high emission of forest fire aerosols and strong winds.
 |
 |
 |
 |
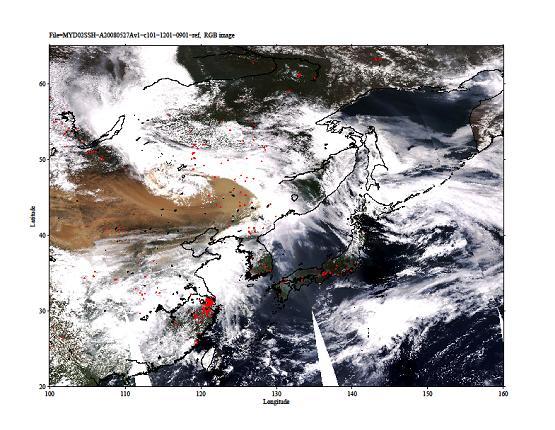
May 27 2008 |
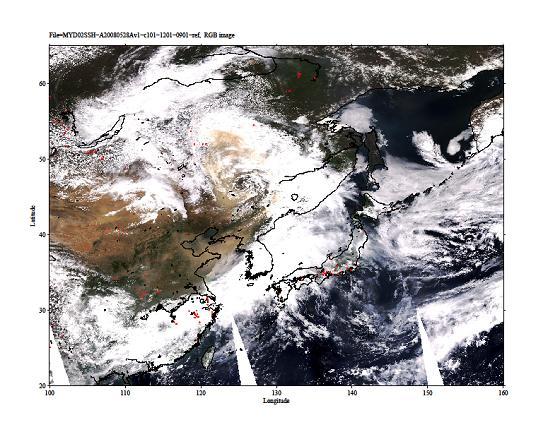
May 28 2008 |
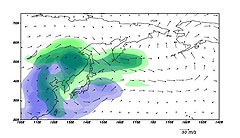
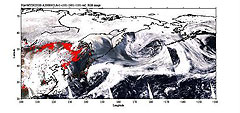
Fig. 2. Yellow dust and areas of forest fires (top)
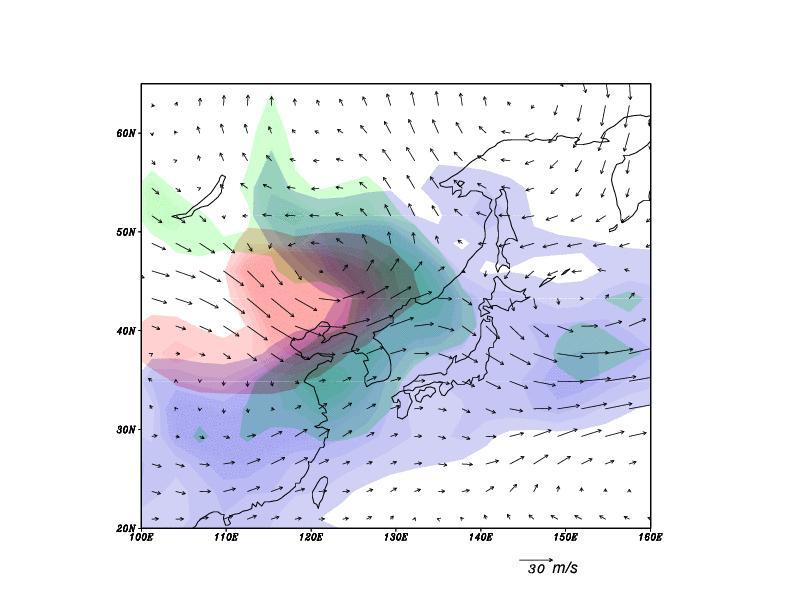
Distribution of aerosols and wind (bottom)
|
On May 26 and 27, 2008, strong winds caused severe sand storms in Inner Mongolia. Satellite images for those days depict large emissions and transportation of yellow dust.
The model simulation depicted in the bottom in Fig. 2 also demonstrates that yellow dust (red) is generated and moved. In the model simulation, yellow dust emissions are calculated using wind speed, soil wetness and snow amount. Model results indicate that forest fire aerosols (green) and fossil fuel burning aerosols (blue) as well as yellow dust cover the area around Beijing.
Aerosols are not simple but have various types and origins. We can get information about fine particles included in smoke from combined analysis using satellite data and model simulation.
Explanation of the Images:
Figs. 1 and 2
| Satellite: |
EOS-Aqua (NASA) |
| Sensor: |
Moderate Resolution Imaging Spectroradiometer (MODIS) (NASA) |
| Date: |
April 19 to 21, 2008 (Fig. 1) and May 27 to 28, 2008 (Fig. 2) |
| Resolution: |
5km |
The distribution of aerosol optical thickness at a wavelength of 550nm and winds at 600hPa depicted in the right of Fig. 1 and bottom of Fig. 2 are calculated by the SPRINTARS three-dimensional aerosol transport-radiation model based on the AGCM developed by the Center for Climate System Research (CCSR), the National Institute for Environmental Studies (NIES), and the Frontier Research Center for Global Change (FRCGC). The areas where the aerosol optical thickness exceeds 0.1 are colored. Green represents forest fire aerosols; blue, fossil fuel burning aerosols; and red, yellow dust.
|
|