| |

|
| |
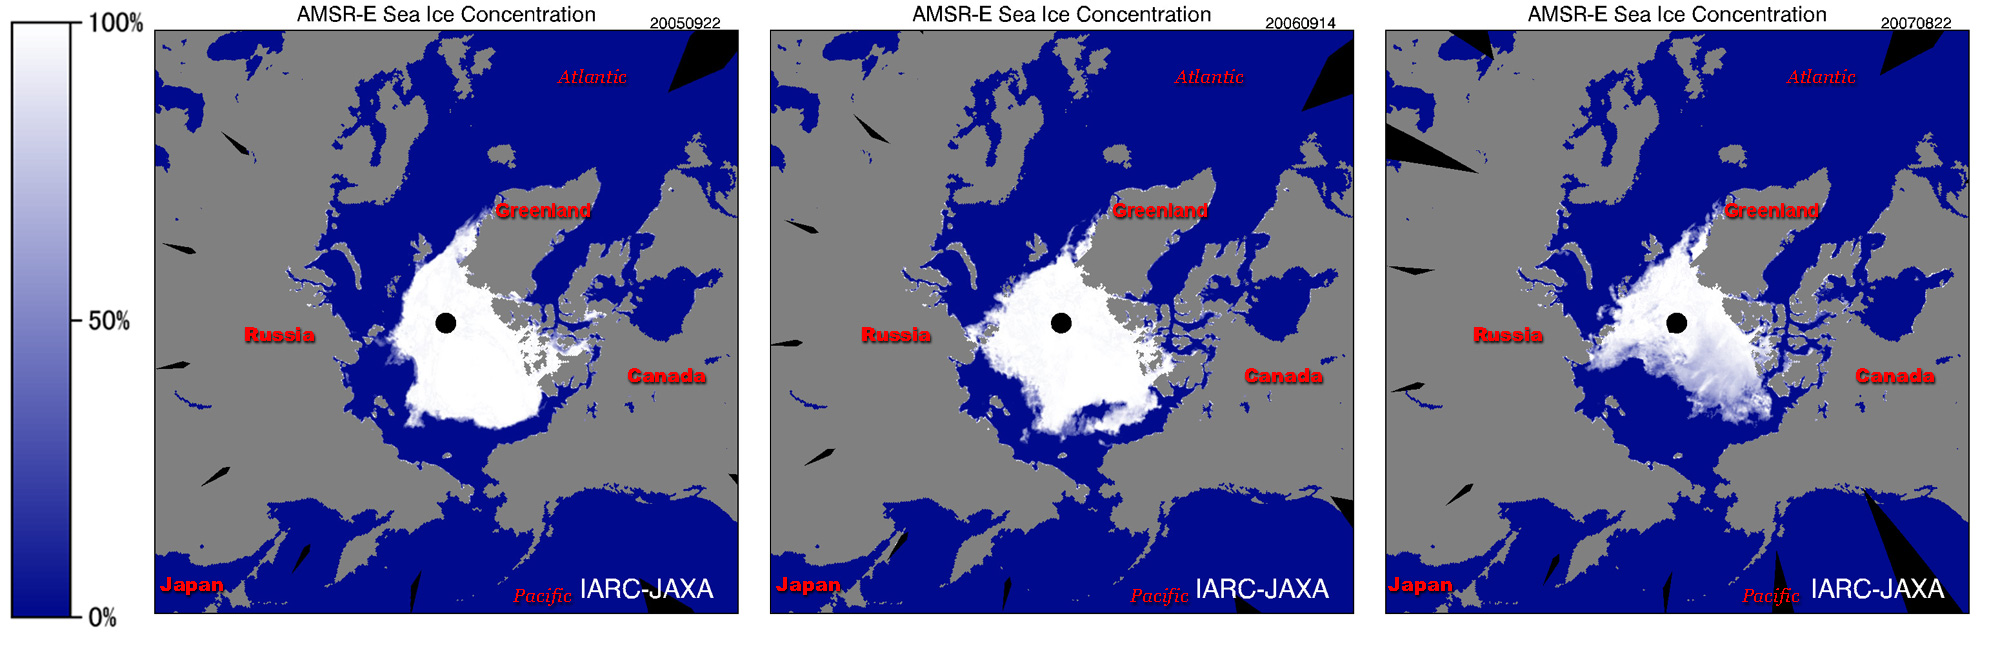
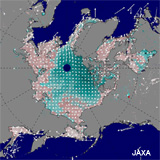
Sep. 22, 2005
(the minimum record) |
Sep. 14, 2006
(the minimum in 2006) |
Aug. 22, 2007 |
| Fig. 1 Summer sea-ice concentrations observed by AMSR-E from 2005 to 2007 |
The arctic sea ice is now in the melting season. JAXA has reported the decreasing arctic sea-ice area in this "Seen from space" every year.*1,2 This year, the sea-ice area is shrinking at an exceptional rate. (See also JAXA's press release on August 16, 2007 "Total area of sea ice in Arctic Ocean smallest since observations started- Much faster pace of ice melting than forecasted - " )
Figure 1 depicts the sea-ice concentration around middle to late September for the last two years (left, 2005; middle, 2006) when the arctic sea-ice area becomes minimum. The right image depicts the same for this year but on August 22, about one month earlier, indicating that the sea-ice area this year is less than the absolute minimum recorded in 2005.
Why is the sea ice area shrinking so fast this year? Three main factors could explain the decrease from the meteorological and sea ice conditions.
1) Low cloudiness was observed from this June to July. The sun illuminated the sea ice all day due to the midnight sun, warming the sea ice much more than usual.
2) The thin first-year ice layer broke into the interior of the pack ice region near the North Pole before the melting season began, making the sea ice much easier to melt.
3) The sea-surface temperature in the open water area around the sea ice is much higher than usual. All of these possible cause could jointly affect the this year's melting of sea ice.
 |
 |
 |
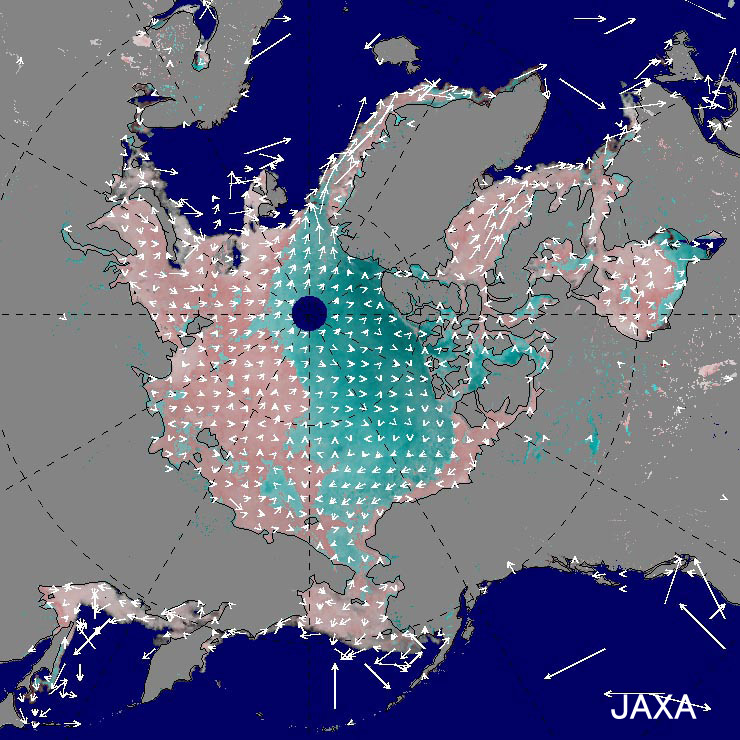
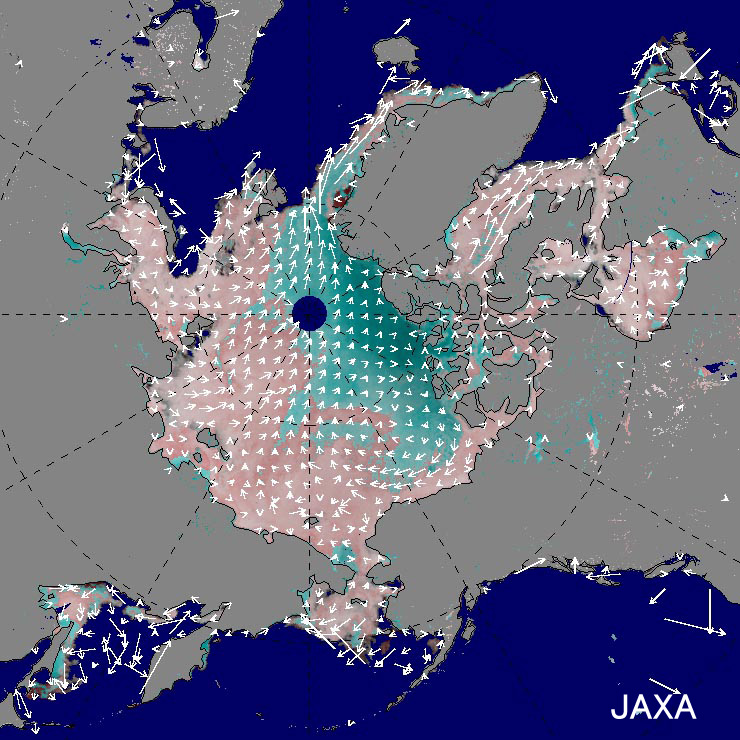
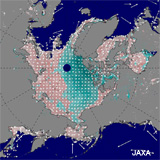
| April 15, 2005 |
April 15, 2006 |
April 15, 2007 |
| Fig. 2 Multi-year and first-year ice distribution in spring (April 15) and monthly averaged sea-ice motion vector (the latter vectors are calculated with half-year AMSR-E brightness temperature data from December to May) shown for the last three years (2005 to 2007). |
Figure 2 presents the AMSR-E derived sea-ice distribution classified into two categories, i.e., thick old (multi-year) ice shown in light blue and thin young (first-year) ice on April 15 during the last three years (2005 to 2007). Also shown (white arrows) are monthly averaged sea-ice motion vectors (direction and distance of sea-ice motion) calculated with a half year AMSR-E brightness temperature data from December to May. You can see that the whole sea-ice area does not vary significantly, but the fraction of the multi-year ice (light-blue area) has rapidly decreased in the last two years. As the sea-ice motion vectors indicate, the decrease of the multi-year ice fraction is considered to result partly from the accelerated export of multi-year ice through the Fram Strait located north-east of Greenland. Warm sea water around the sea ice recently seen in late autumn is also expected to prevent the sea ice from freezing and growing into thicker ice in the winter season.
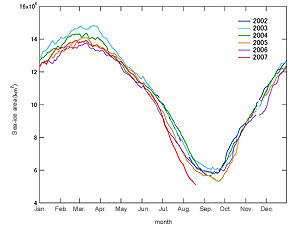 |
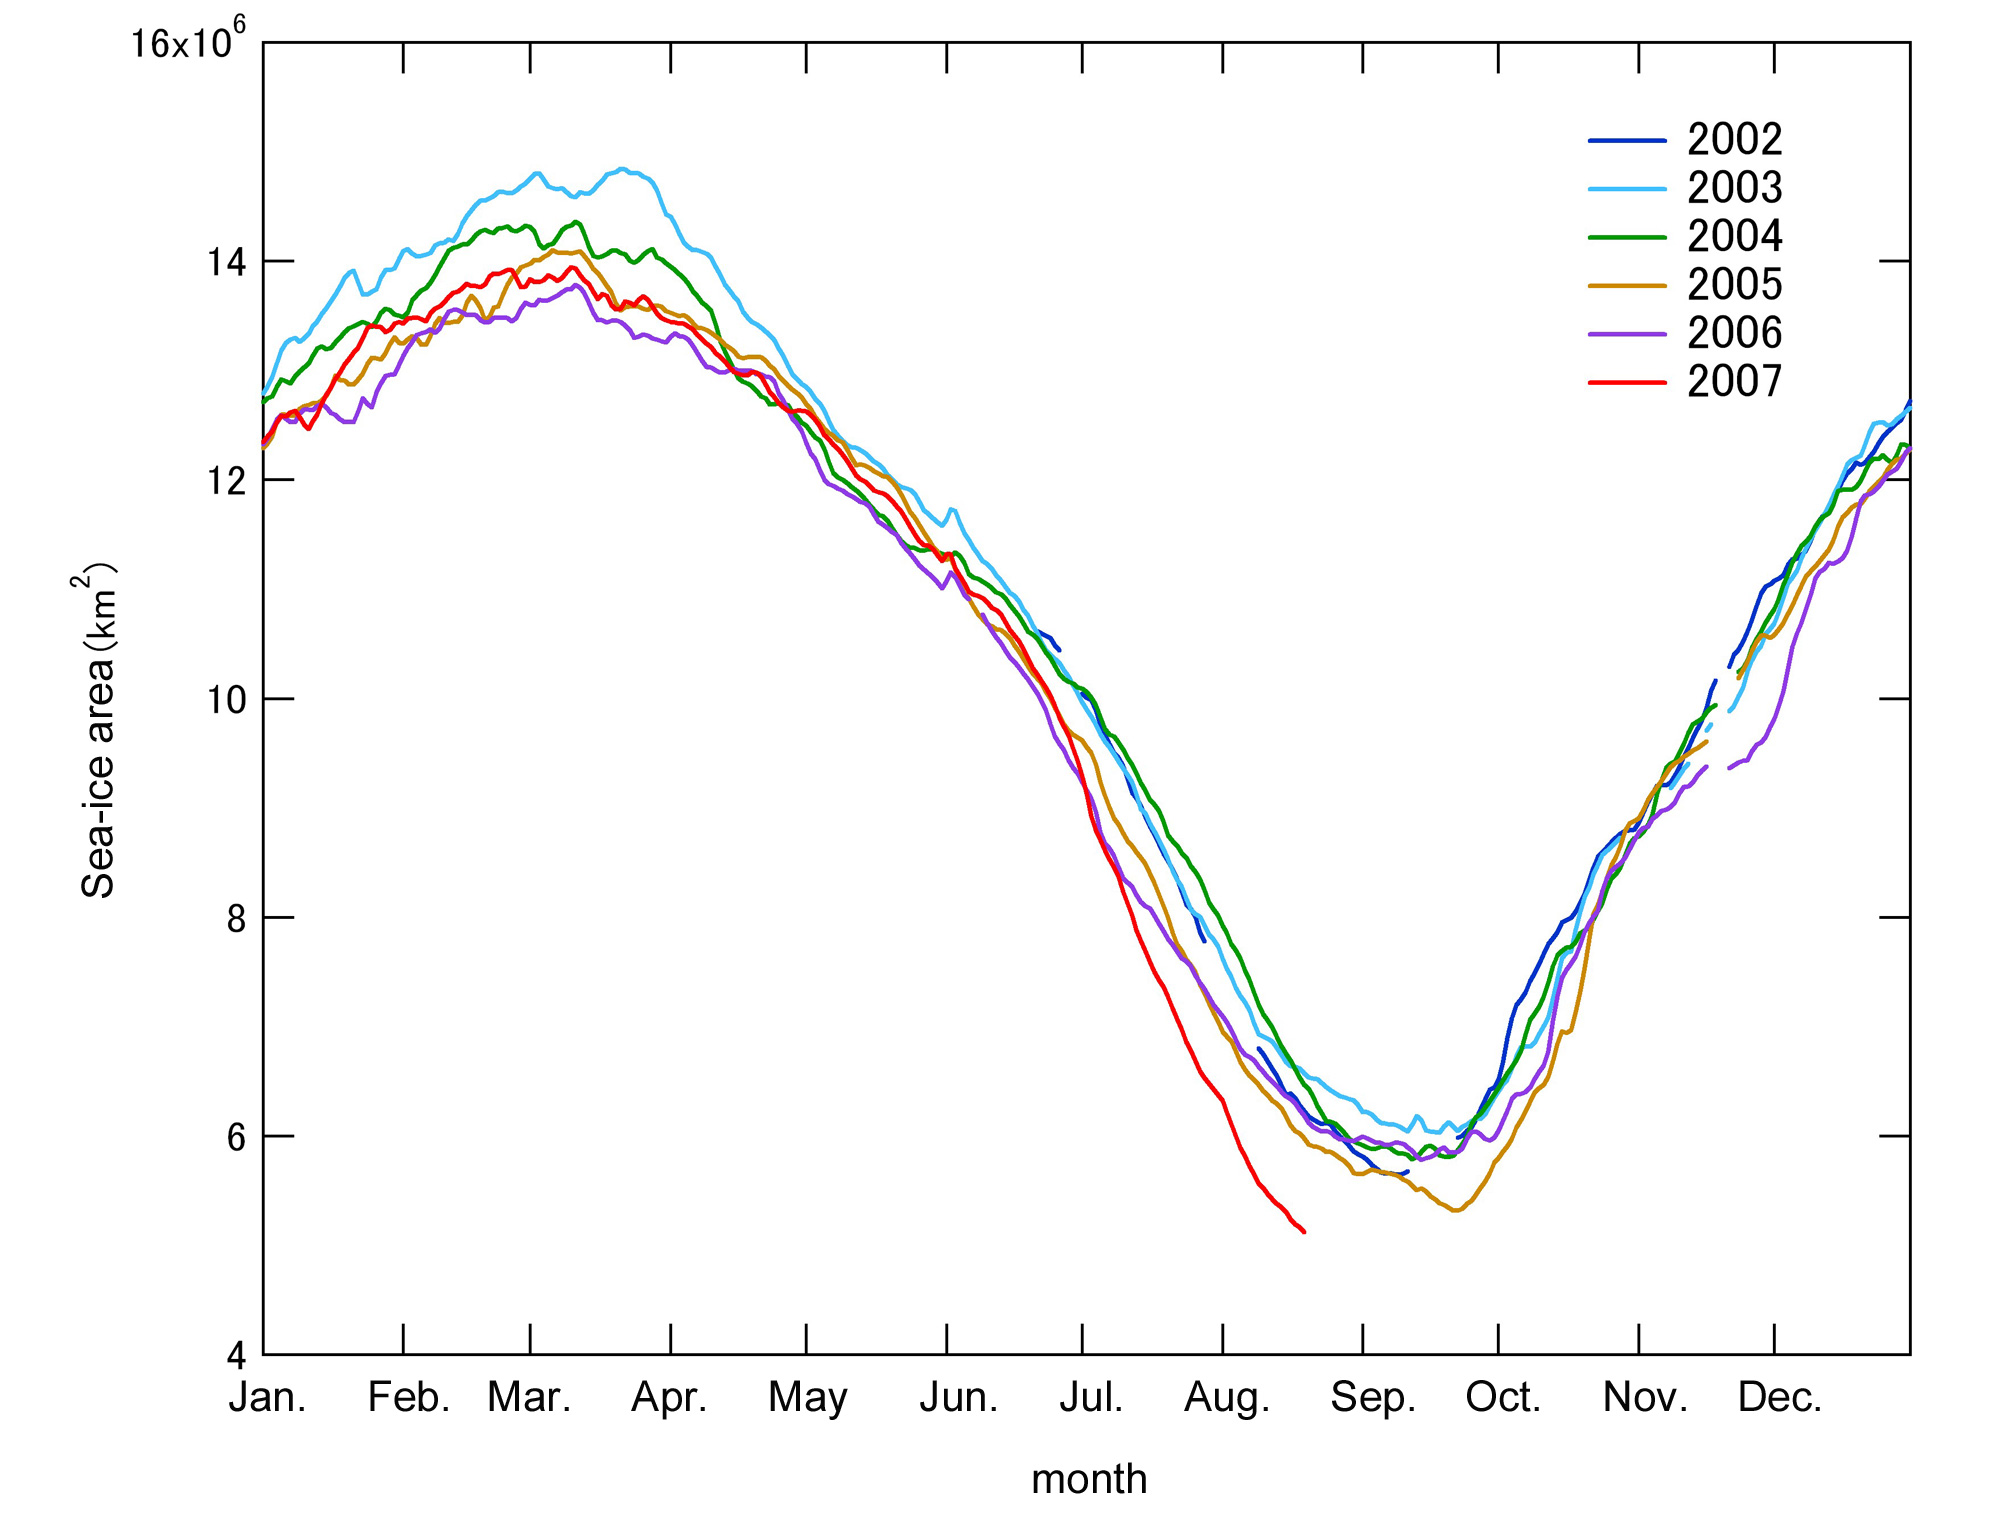
| Fig. 3 Seasonal variation of the arctic sea-ice concentration captured by AMSR-E (2002 to 2007) |
Figure 3 shows the AMSR-E-derived seasonal variations of the arctic sea-ice concentration since 2002. The decrease of the sea-ice area due to melting usually continues until the middle of September. If the rate of ice shrinking seen so far this year is maintained, the absolute minimum record in 2005 will have to be significantly updated this September. Sunlight gradually weakens as the sun elevation decreases in August. The sea-surface temperature around the sea ice, however, remains warm. You might see a strange open water area in the Arctic Ocean around the North Pole this autumn.
You can find the latest image of sea-ice density in the Arctic Ocean and past observation images on Arctic Sea-Ice Monitor in the IARC-JAXA information system (IJIS) maintained by JAXA and located at the International Arctic Research Center (IARC, Fairbanks, Alaska).
Explanation of images:
Fig. 1. Click the image to enlarge it.
Figure 1 shows the calculated concentration of sea ice based on an algorithm developed by one of the Principal Investigators (PI) for AMSR/AMSR-E algorithm development, Dr. Josefino C. Comiso from NASA GSFC. The calculation uses 36.5-GHz and 18.7-GHz horizontal and vertical polarization data of AMSR-E.
Fig. 2. Click the image to enlarge it.
Figure 2 shows the sea ice classified into two categories, i.e., multi-year ice and first-year ice, using 36.5-GHz and 18.7-GHz vertical polarization data of the AMSR-E. The spatial resolution of Fig. 2 data is approximately 25km. Sea-ice motion vectors are monthly averages generated with AMSR-E brightness temperature data for a half year from the previous December to May.
|
 |
|