| |
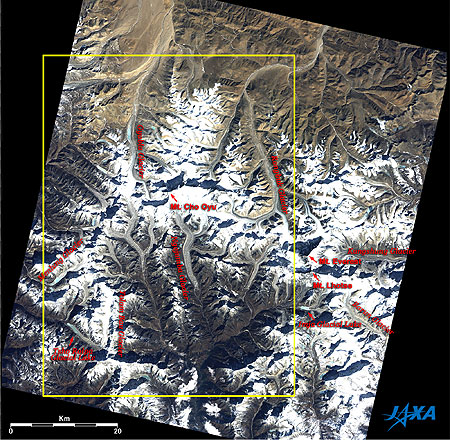 |
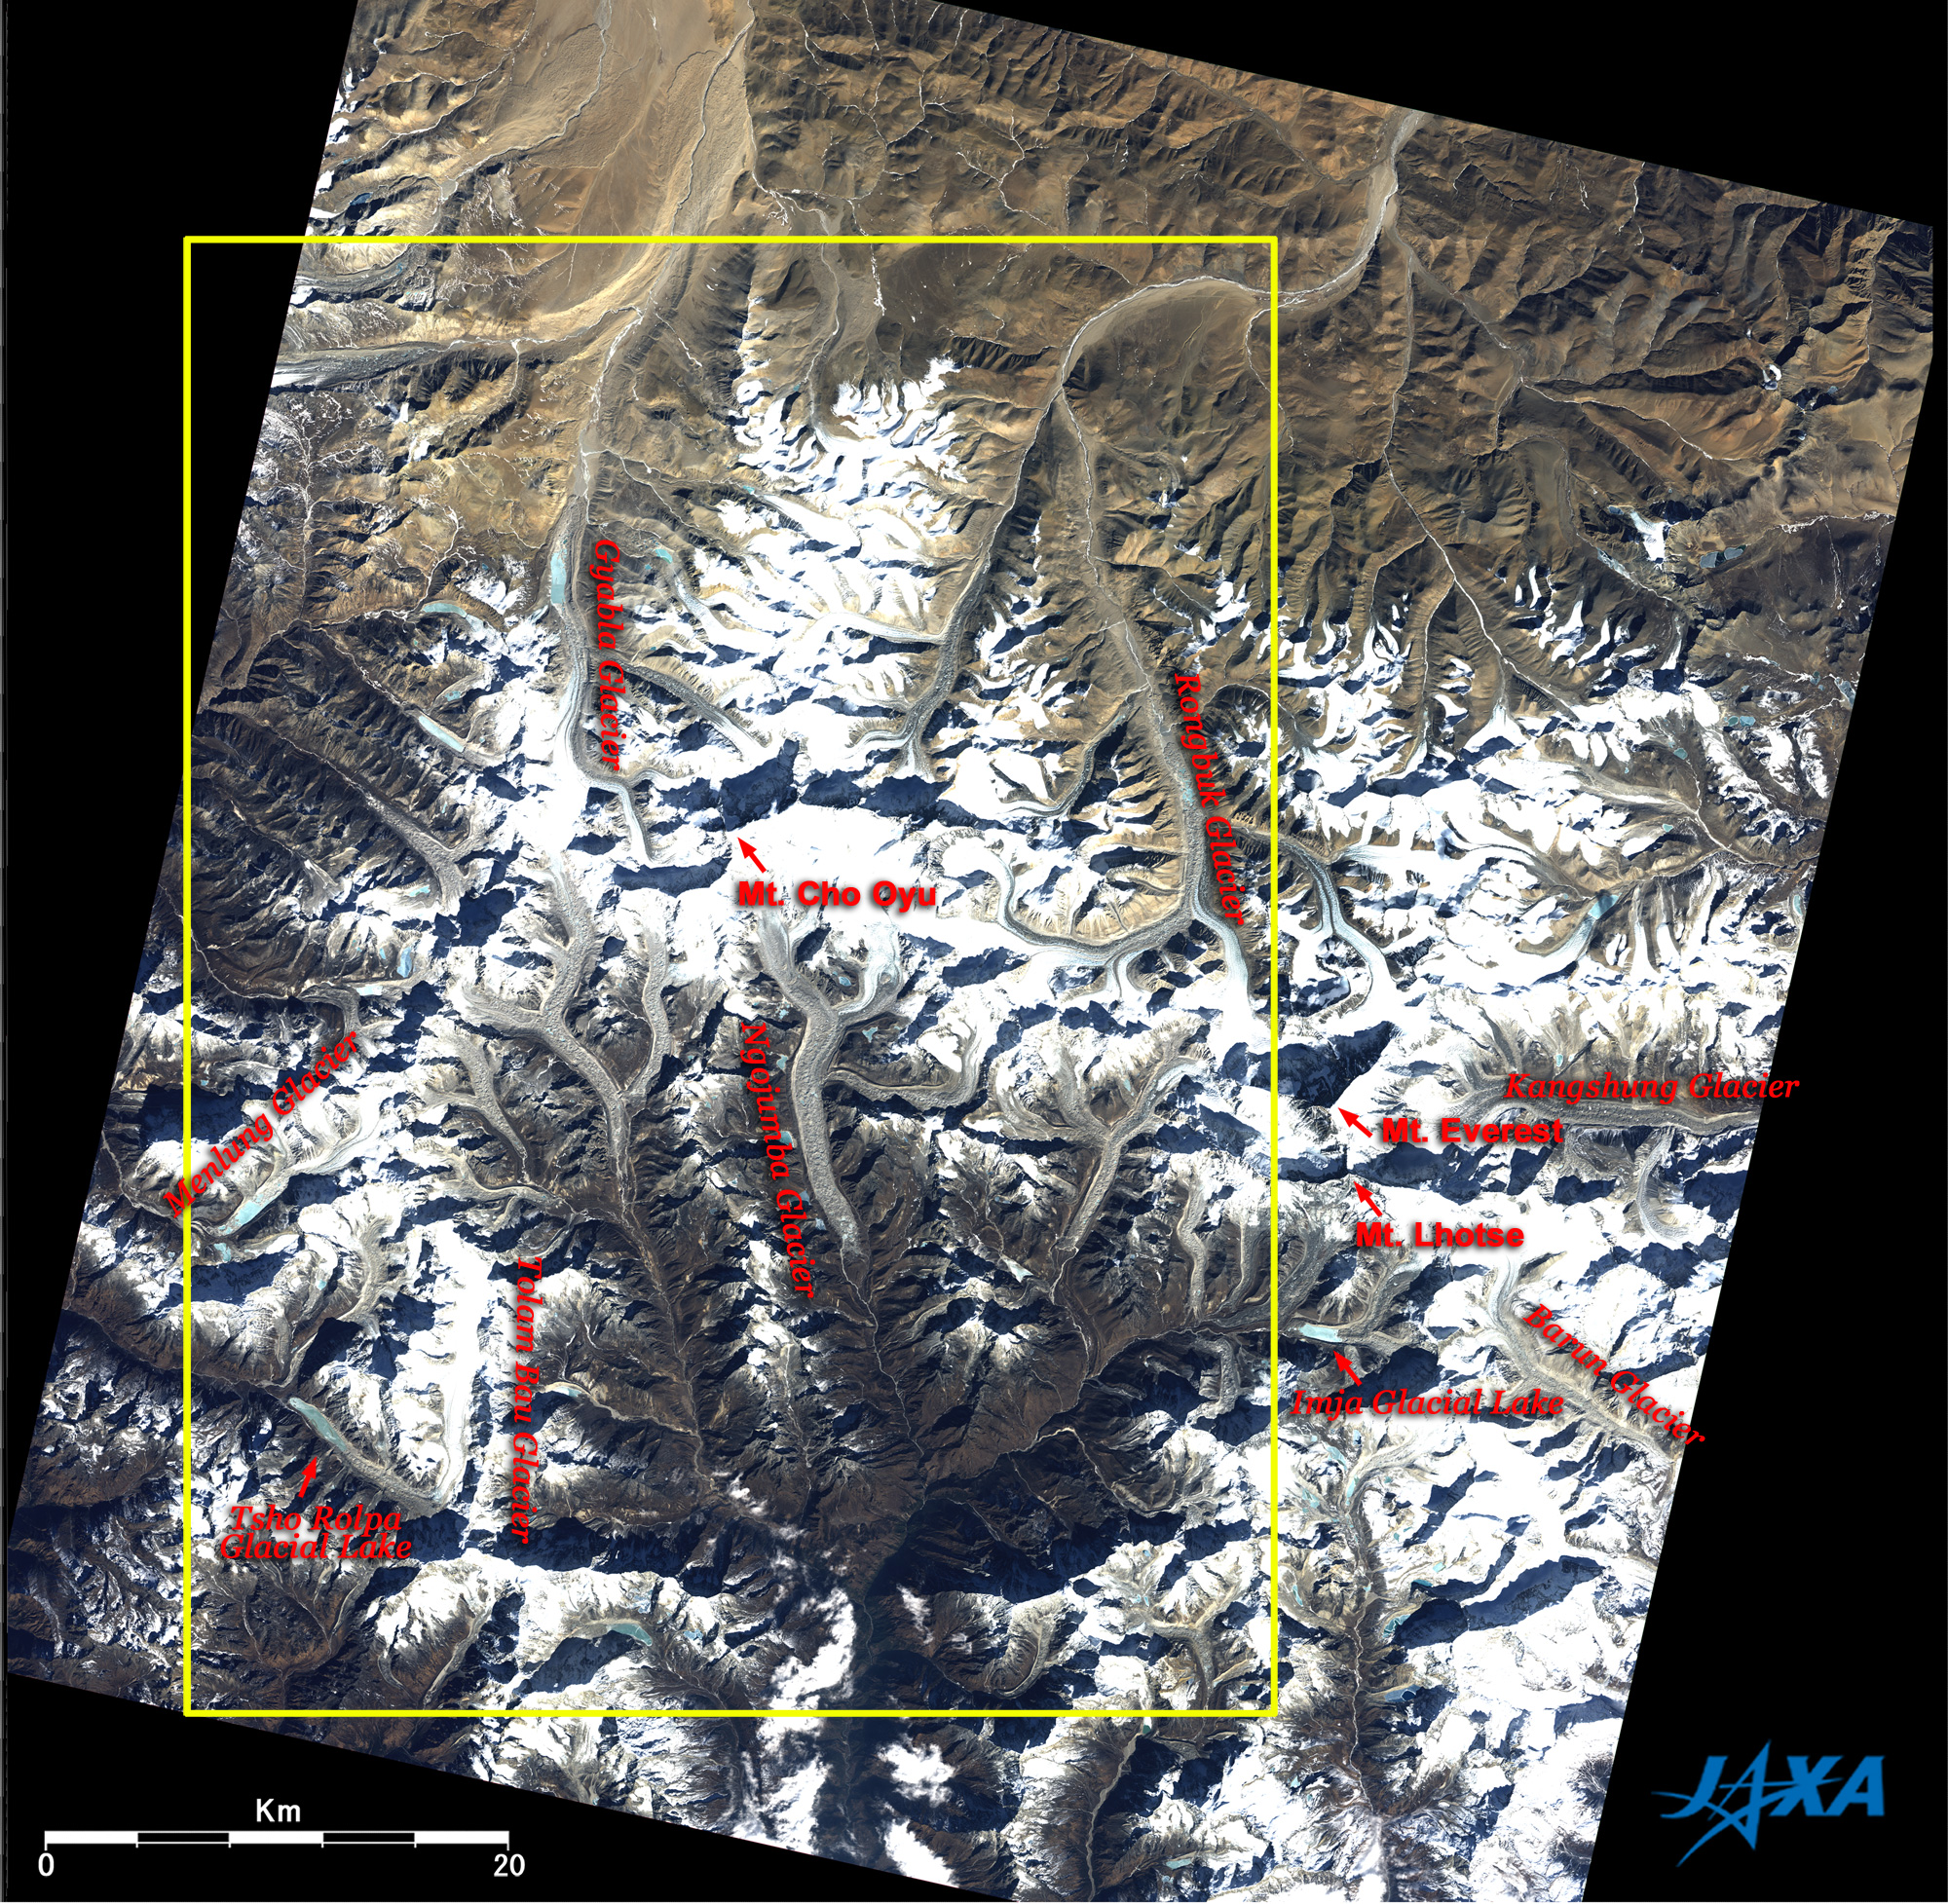
Fig. 1 Wide area image around Mt. Everest
Everest (kmz,1.94MB,Low Resolution) is seen from Google Earth. |
Figure 1 depicts the world's highest peak, Mt. Everest (8,848m above sea level) and surrounding mountains in the Himalayas in January 2007. The steep summits and ridges of the mountains cast their own shadows toward the upper left due to the sunlight from the southeast. Mt. Everest is located at the large triangular shaded area on the right. You can also see Mt. Lhotse (8,516m), Mt. Cho Oyu (8,201 m), and other high peaks; numerous glaciers; and the light-blue glacial lakes. The glaciers can be seen as white, light blue or light brown stripes. The upper half of the figure is Chinese Tibet, and the lower half is Nepal with the borderline running east and west in the center of the figure. The three 8,000m peaks mentioned above are on the border.
Mt. Everest was identified as the world's highest peak in 1852. However, the local name was not known at that time because of the national isolation of Tibet and Nepal. It was therefore named after the English geographer, Colonel Sir George Everest who achieved many valuable tasks as the Surveyor-General of India. The Tibetan name "Chomolungma" means "Mother god of the world," and the Nepalese name "Sagarmatha" means "Summit of the world." The first topping of Mt. Everest was accomplished by a British group in 1953 when Edmund P. Hillary from New Zealand and Tenjin Noll Gay of Sherpa stood at the top on May 29.
 |
 |
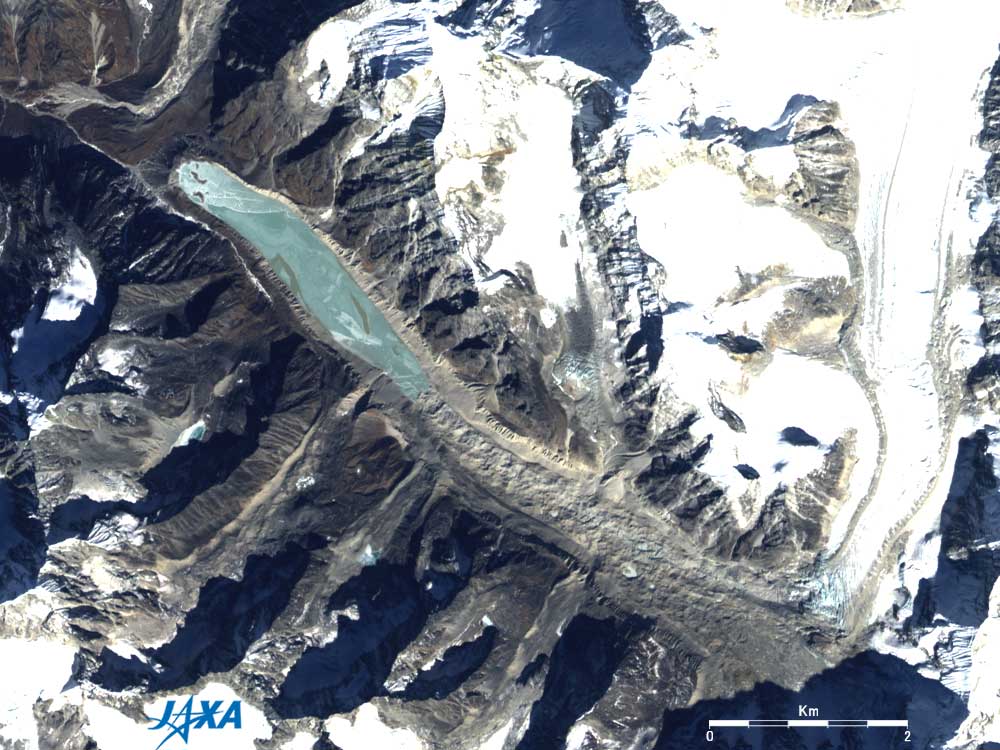
| (a) Tsho Rolpa Glacial Lake |
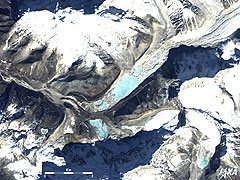
(b) Glacial Lake on Menlung Glacier |
 |
 |
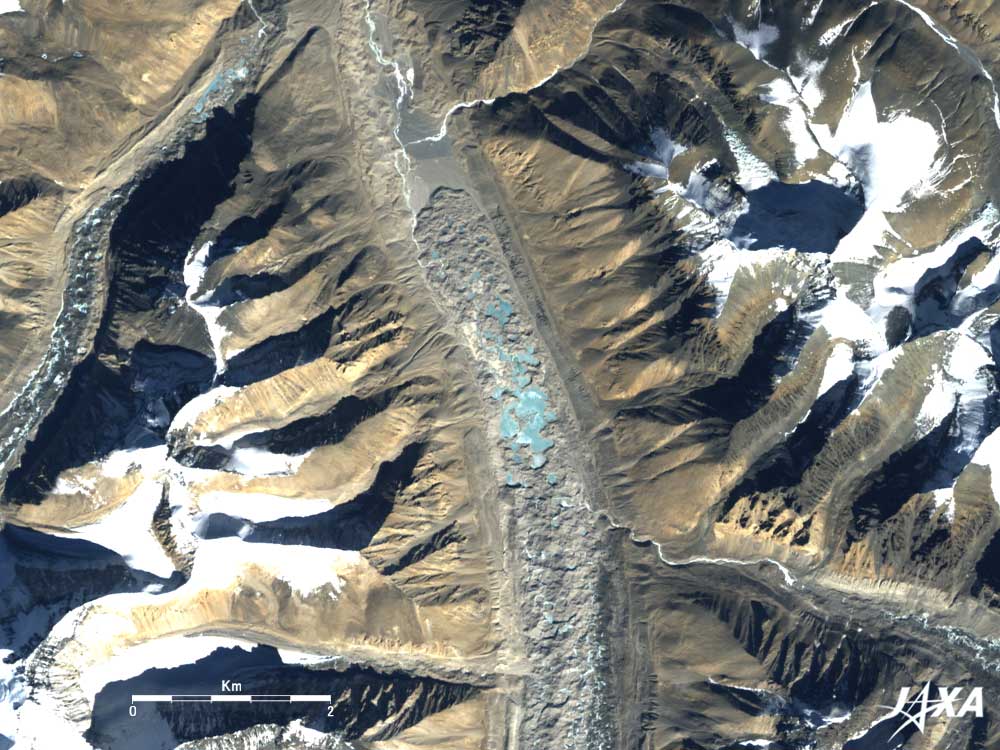
| (c) Glacial Lake on Rongbuk Glacier |
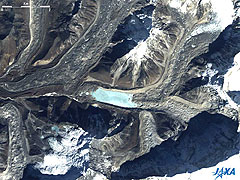
(d) Imja Glacial Lake |
| Fig. 2 Expanded Images of the Glacial Lakes around Mt. Everest |
Figures 2a to 2d are the expanded images of the important glacial lakes in Fig. 1.
Figure 2a depicts Tsho Rolpa Glacial Lake situated 46km west-southwest of Mt. Everest. It is 600m wide and 3,400m long. The United Nations Environment Programme's (UNEP's) report* pointed out that this glacier has the possibility of breaking and causing flooding. Please refer to the image comparison in Fig. 4.
Figure 2b presents Menlug Glacier situated 47km west of Mt. Everest. The glacial lake at the center of the figure was formed within the last 10 years; it is about 700m wide and about 1,100m long. Please refer to the image comparison in Fig. 4.
Figure 2c shows Rongbuk Glacier situated 15km northwest of Mt. Everest. A large glacial lake was formed in an area 500m wide and 2,000m long on the surface of this glacier after some small glacial lakes combined to form a larger one. Please refer to the image comparison in Fig. 6.
Figure 2d depicts Imja Glacier situated 9km south of Mt. Everest. It is 600m wide and 1,500 to 2,000m long. The UNEP report* also notes the possibility of it breaking and causing flooding, and the local people are anxious about it.
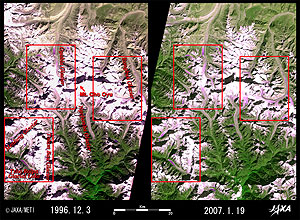 |
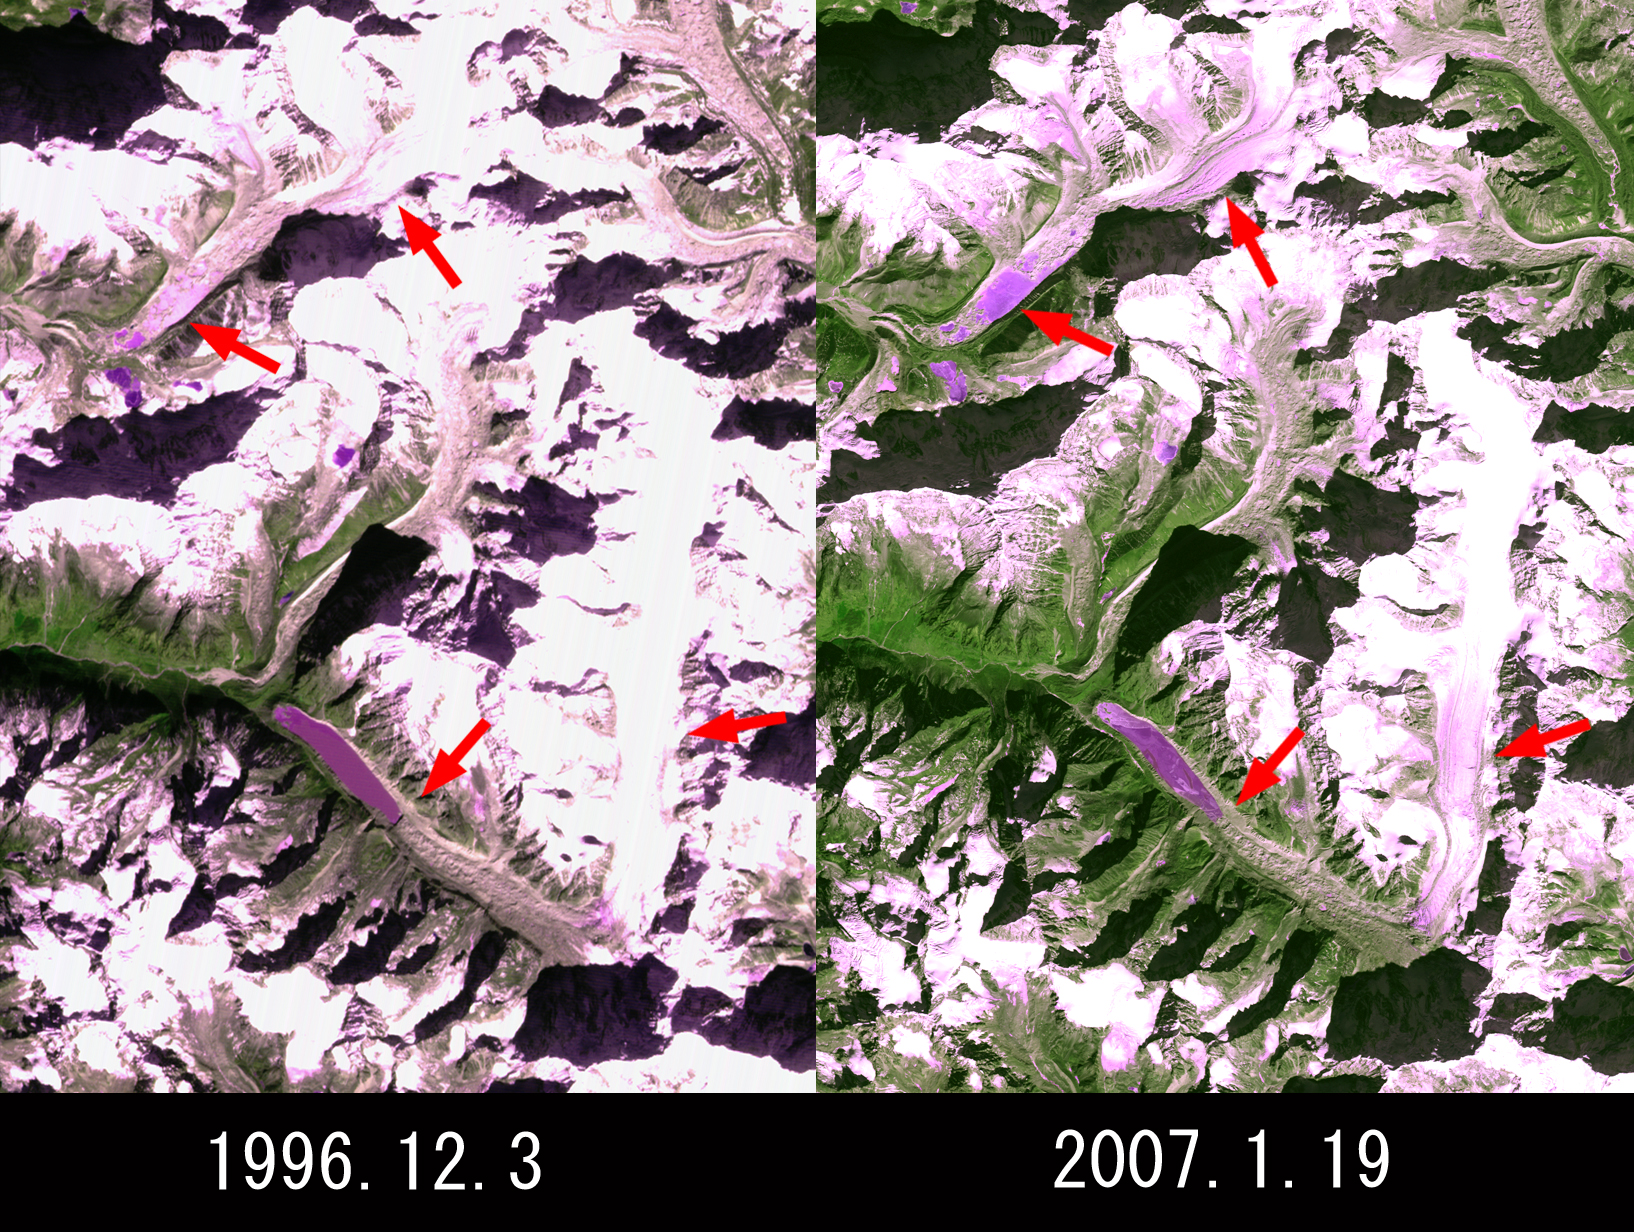
| Fig. 3 Comparison of the western area of Mt. Everest |
The right side of Fig. 3 is a different color image within the yellow square frame of Fig. 1, and the left side is the same area in December 1996.
The figures were acquired in almost the same season, but you can find that the white areas covered with snow and ice had shrunk and that the green areas indicating vegetation had expanded between 1996 and 2007. A comparison of Figs. 4 to 6, which are expanded images of Fig. 3, revealed that new glacial lakes were created, the surface area of many glacial lakes expanded as the volume of stored water increased, and the glacier surfaces began melting in the last 10 years. These figures indicate that the influence of global warming extends to Mt. Everest.
The glaciers appear as white or light-purple stripes, and the glacial lakes appear dark purple because the coloring of Figs. 3 to 6 differs from that of Figs. 1 and 2.
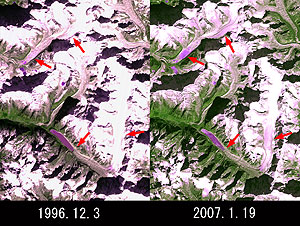 |
| Fig. 4 Expanded Image around Menlung Glacier and Tsho Rolpa Glacial Lake |
The arrows in the upper left indicate a large glacial lake formed on Menlung Glacier during the last 10 years. A small change in the upstream side (arrow at the bottom) of Tsho Rolpa Glacial Lake is raising concern about the lake possibly bursting. Additionally, the color of other areas indicated by arrows changed from white to purple, indicating that snow and ice on the surface had begun melting.
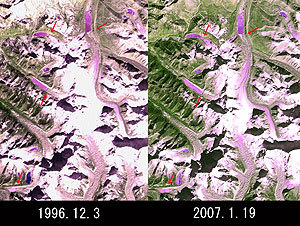 |
| Fig. 5 Expanded Image around Gyabla Glacier |
Some dark-purple glacial lakes can be seen to have grown within the last 10 years. Some areas that were white in 1996 changed to purple in 2007, indicating that snow and ice on the surface began melting. You can also see that green areas representing vegetation increased.
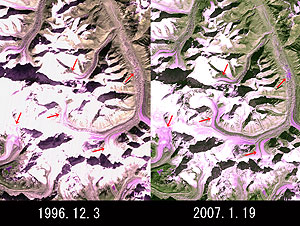 |
| Fig. 6 Expanded Image around Rongbuk Glacier |
Small dotted purple glacial lakes tens of meters in size seen in 1996 (upper right) had combined to form a larger glacial lake by 2007. The areas indicated by arrows changed from white to purple, suggesting that snow and ice on the surface had begun to melt.
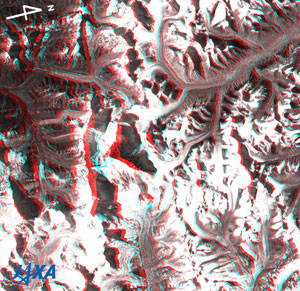 |
Fig. 7 Three-Dimensional View around Mt. Everest
(Staring at the image for a long time may cause eye-strain. A color print is available in pdf format. Pdf files for the left and right eyes are also available for stereoscopic viewing.)
|
Figure 7 is a 3-D view combining forward- and nadir-looking images in December 2006. Please note that north is to the right in this image.
If you view this figure with red and blue 3-D glasses, you can distinctly see the steep mountains including Mt. Everest at the center of the figure and Mt. Lhotse in the lower left, as well as deep valleys, extending branches, and the glaciers that flow in the upper streams of the valleys. The white areas, representing snow and ice, are higher above sea level. Imja Glacial Lake is on the left of the figure, and the glacial lake formed on the surface on Rongbuk Glacier is in the upper right.
Explanation of the Images:
Figs. 1, 2a to 2d and right side of Figs. 3 to 6
AVNIR-2 has four observation bands. Figure 1 and Figs. 2a to 2d were composed by assigning red to visible Band 3 (610 to 690nm), green to visible Band 2 (520 to 600nm), and blue to visible Band 1 (420 to 500nm). The resulting image has natural coloring as if seen by the naked eye. In these images, snow and clouds are white;, glaciers are white or light brown; exposed rocks, soil and sand are brownish; and hay is dark brown. Areas with no data are black.
The right sides of Figs. 3 to 6 were composed by assigning red to visible Band 3 (610 to 690nm), green to near-infrared Band 4 (760 to 890nm), and blue to visible Band 2 (520 to 600nm). As a result, the figures have nearly natural coloring, with vegetation slightly emphasized. In these images, snow and ice are white or light purple, forests are dark green, grassland is light green, and glacial lakes are dark purple. Areas with no data are black.
Left images of Figs. 3 to 6
The composite figures were produced by assigning red to the visible channel (630 to 690nm), green to the near-infrared channel (760 to 860nm), and blue to the visible channel (520 to 600nm). The resulting figures have nearly natural coloring with a slightly emphasized green for vegetation and light purple for snow and ice. In these images, snow and ice are white or light purple, forests are dark green, and grasslands are green-yellow. Areas with no data are black.
Fig. 7
PRISM is an optical sensor for observing ground surfaces with visible and near-infrared signals in the 520 to 770 nanometer (one-billionth of a meter) band. The acquired image is monochrome. PRISM has three independent optical systems (telescopes) to acquire images for nadir, forward, and backward views at the same time so that terrain data including altitude data can be obtained.
Figure 7 was composed using the forward-looking image (green and blue) and the nadir image (red). In Fig. 7, the left side is the satellite moving direction because the nadir of the satellite is seen with the left eye and the forward with the right eye. The left side corresponds to the moving direction of "Daichi," and the right side, to the north. Note that the right side is the north direction in Fig. 7 even though the upper side is north in Figs. 1 to 6.
|
 |
|