| |
On December 11, 2006, the Japan Meteorological Agency (JMA) announced the possibility that an El Niño phenomenon had occurred last autumn and that this condition would continue until spring.
|
|
Fig. 1 Sea-surface temperature distribution (top) and sea-surface temperature anomaly distribution (bottom)observed by AMSR-E.
Enlarged animation (4.9MB) |
Figure 1 presents the distribution of sea-surface temperature (Fig. 1 top) and sea-surface temperature anomaly from the last 30-years average (Fig. 1 bottom) observed by AMSR-E on Aqua, a NASA Earth observation satellite. The red area in the upper figure is a high-temperature zone (32.5°C maximum) of the sea surface. The blue area is a low-temperature zone (20°C minimum). The red area in the bottom figure is warmer than the average, and the blue area is colder than the average. An anomalous high sea-surface temperature region is found in the eastern and central tropical Pacific. The box in the image (90°W to 150°W, 5°S to 5°N) is the sea area used by JMA to judge El Niño and La Niña phenomena.
The animation depicts the temporal variation of the weekly mean of sea-surface temperature and its anomaly from January to mid-December, 2006. From January to March, the sea-surface temperature anomalies were negative in the eastern and central tropical Pacific region, corresponding to a La Niña event (ref. "AMSR-E observes La Niña"). The La Niña event ended by June (ref. "La Niña event ends"), and positive sea-surface temperature anomalies have spread since last autumn.
 |
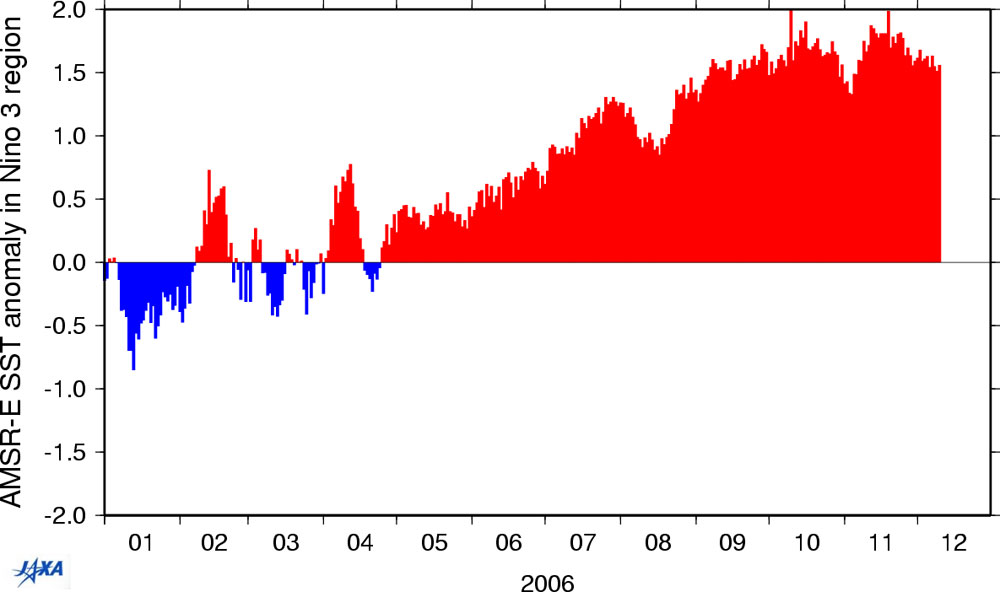
| Fig. 2 Time series of sea-surface temperature anomaly in the judgment area |
Figure 2 depicts the temporal variation of daily sea-surface temperature anomalies from the 30-year average in the judgment area. A positive anomaly (red area) corresponds to El Niño, and a negative anomaly (blue area) corresponds to La Niña. A positive anomaly appeared in June and has exceeded 1°C since September.
For the latest information on the sea-surface temperature of the tropical Pacific, please visit our webpage "El Niño watch."
|