Seen from Space 2006
Typhoon No. 13 (Shanshan) approaching Okinawa and Kyushu, Japan
| |
 |
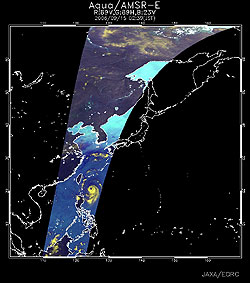 |
Fig. 1 Typhoon No. 13 observed
by MODIS |
Fig. 2 Typhoon No. 13 observed
by AMSR-E |
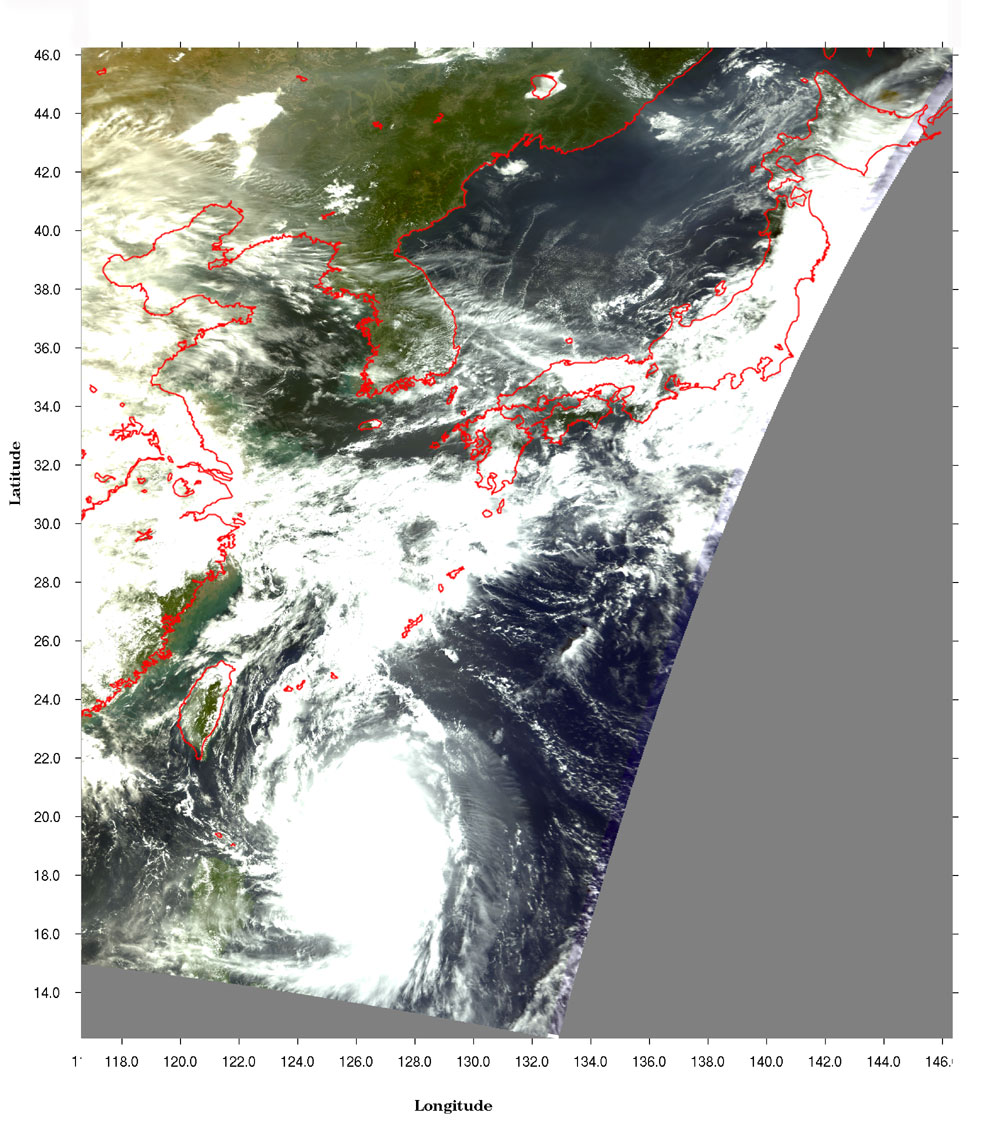
Figure 1, observed by MODIS on September 14, depicts the clouds of typhoon No. 13 (Shanshan) and the frontal clouds stretching from the Japanese Archipelago to China. Typhoon No. 13 is approaching Yaeyama Islands in Okinawa as it grows from "strong" to "very strong" and changes its course from westward to northward.
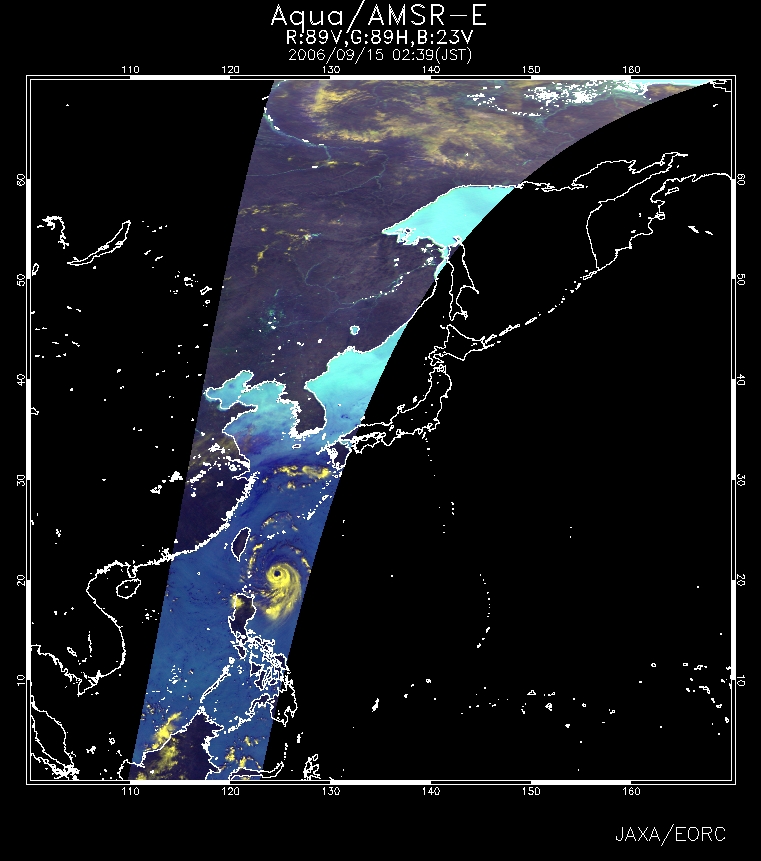
Figure 2 presents typhoon No. 13 observed by AMSR-E. The atmosphere that contains a lot of moisture over the sea area appears dark blue, and the developed clouds appear yellow. You can see the apparent eye of the typhoon and the clouds distributed on the southeastern side.
 |
 |
Fig. 3 Rain rate distribution acquired
by PR and cloud image acquired
by VIRS |
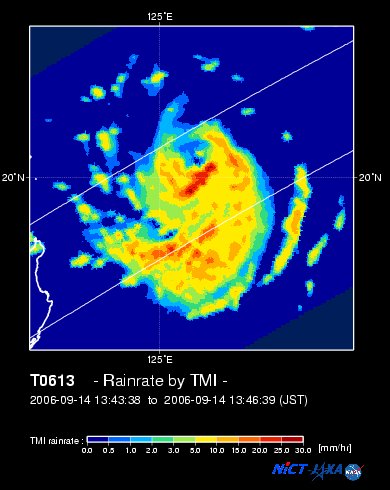
Fig. 4 Rain rate image acquired
by TMI |
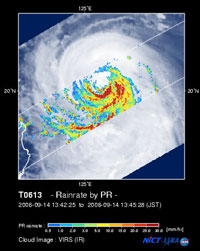
Figure 3 is a composite image of rain rates near the Earth's surface observed by PR and the cloud image observed by VIRS; both sensors are aboard the TRMM satellite. Figure 4 presents the precipitation observed by TMI aboard the TRMM satellite. You can see that the heavy precipitation areas (red and yellow) are distributed to the southern side of the eye of the typhoon.
 |
| Fig. 5. Wind velocity distribution on the sea observed by AMSR-E |
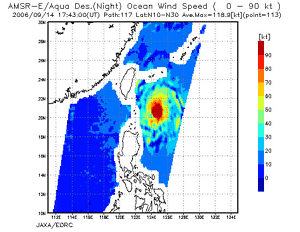
Figure 5 illustrates the distribution of analyzed wind velocity on the sea south of the Japan Archipelago on September 15. Wind velocity on the sea can be analyzed by observing wave conditions (swells and surfs) of the sea surface created by wind there. AMSR-E observes the sea surface with microwaves, so we can estimate the wind velocity on the sea night or day and under cloud cover. In Fig. 5, we can observe the oval red-hatched area of strong 90-knot winds (1 knot is about 0.5 meter per second) in the center of the typhoon.
The typhoon is expected to approach the main island of Okinawa and Kyushu as it is driven by westerlies and gains speed.
The front stagnating in Southern Kyushu is expected to become active because warm, damp air will flow into it due to the approaching typhoon.
Please monitor and heed future typhoon reports.
Explanation of the images:
Fig. 1
| Satellite: |
EOS- Terra (NASA) |
| Sensor: |
Moderate Resolution Imaging Spectro-radiometer (MODIS; NASA) |
| date: |
1117 (JST) on September 14, 2006 |
| Color composition was made by using three out of 36 channels on MODIS; channel 1 of the visible band (620 to 670 nm) for red, channel 4 of the visible band (545 to 565 nm) for green, and channel 3 of the visible band (459 to 479 nm) for blue, resulting in the figure below. |
| Green: |
Abundant vegetation (ex. forests) |
| White: |
Clouds |
| Light brown: |
Sparse vegetation |
| Black: |
Water surfaces (sea) |
| Grey: |
No data |
Figs. 2 and 5
Fig. 3
Fig. 4
*1 TRMM is a joint mission with participation of NASA, NICT, and JAXA. |
 |
|