| |
 |
 |
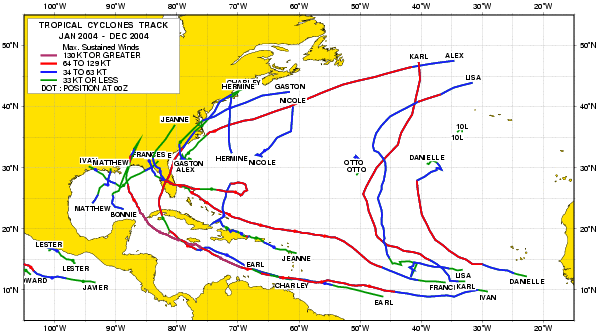
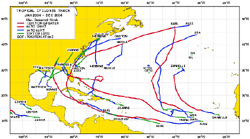
| Fig. 1. Maps of hurricane paths, a) in 2004 and b) in 2005 |
The typhoon season in the northwestern Pacific and the hurricane season in the North Atlantic ended in December of 2005. Compared to the average year, there were more hurricanes in the North Atlantic in 2005 (*1). Fourteen hurricanes that year had maximum wind speeds of 64 knots (32.6m/s) or greater, surpassing the former record of 12 in 1969. Hurricane Epsilon developed on December 2, although December hurricanes are not typical. Tropical cyclones with maximum wind speeds of 34 knots (17.3m/s) or greater are named in each area in the world, but in 2005, after they had used all 21 predesignated names, they used Greek letters sequentially. Hurricane Epsilon was the 26th tropical cyclone that year. It was characteristic of hurricanes that year that the central pressures recorded were lower than average. In addition to Hurricane Wilma, which set a record for minimum central pressure with 882hPa, three hurricanes that year were included in the top 10 observation records. Figure 1 depicts the maps of the tropical cyclone paths in 2004 and 2005 in the North Atlantic. A lot of damage by hurricanes was reported in 2004, but there were more tropical cyclones in 2005.
 |
 |
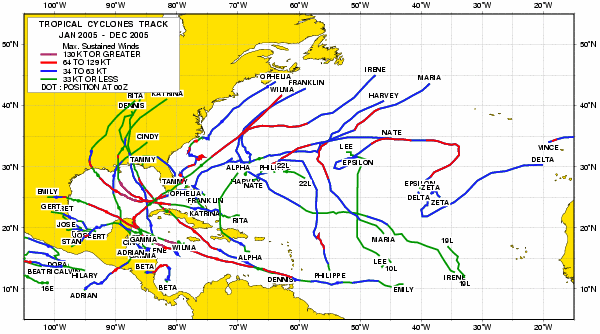
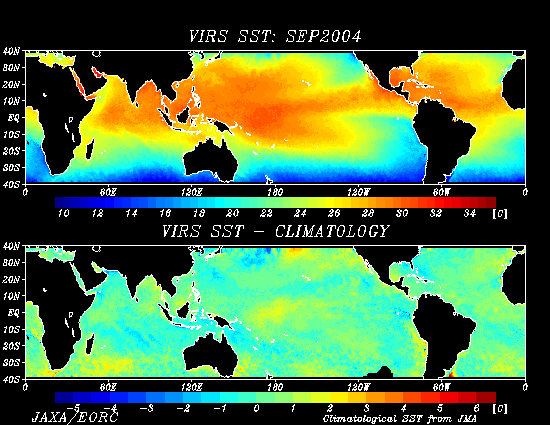
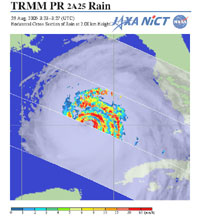
Fig. 2. Hurricane Katrina
a) Cloud images and rainfall distribution at 2km above sea level.
b) Bird's-eye view of the rainfall. |
The 2005 Hurricane Katrina, which developed from August 23 to 31, brought the greatest damage in the southern United States, especially in New Orleans, Louisiana. The levees there burst, 80 percent of the city was submerged, more than a thousand people died, and more than a million people were displaced. Katrina was fierce, with maximum wind speeds of 78m/s and minimum atmospheric pressure of 902hPa. Figure 2 depicts Katrina at 0325 (UT) on August 28, 2005, as observed by the Precipitation Radar (PR) aboard the Tropical Rainfall Measuring Mission (TRMM). Katrina was developing rapidly at that time, and a few hours later it reached "category 5" (*2), the maximum classification by the US National Oceanic and Atmospheric Administration (NOAA). Figure 2a superimposes the rainfall image at 2km above sea level on a cloud image from the Visible Infrared Scanner (VIRS). The eye of the hurricane is at the edge of the observation swath of PR, and the wall clouds are just outside of the eye. The surrounding, very strong rainfall areas depicted in red are shown as multiple concentric lines. When viewing this three-dimensional structure (Fig. 2b), you can see that each linear rainfall area developed at high altitude (maximum 15km above sea level) in a narrow area. This is characteristic of tropical cyclones from development to maturity.
 |
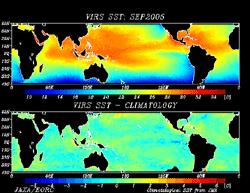 |
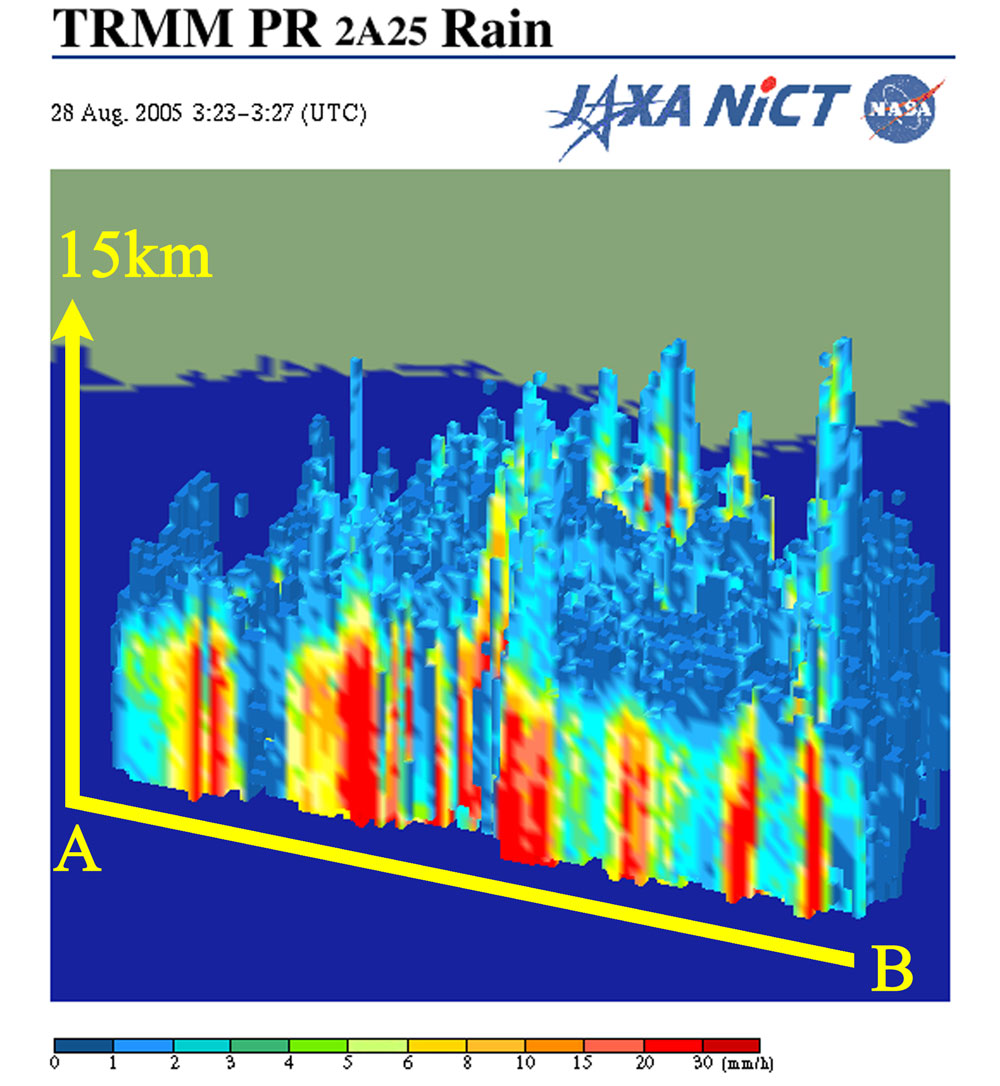
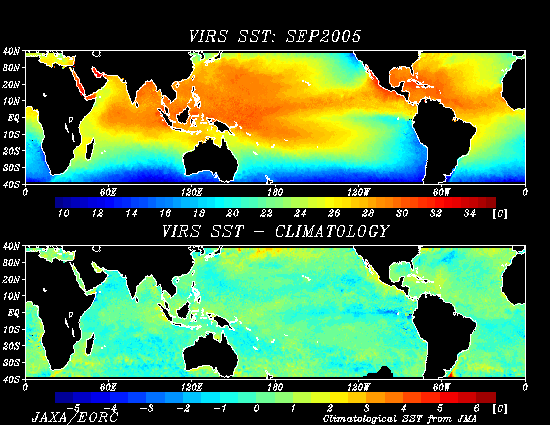
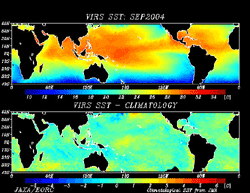
Fig. 3. TRMM/VIRS
a) Sea-surface temperature in September 2004.
b) Sea-surface temperature in September 2005. |
One reason for the great strength and the large number of hurricanes in 2005 was that the sea-surface temperature (SST) in the area was greater than average. The upper section of Figs. 3a and b indicate the average monthly SST. The lower section illustrates the difference between the average monthly SST and the average yearly value. When comparing the areas near the West Indies in the upper right, i.e. from the Gulf of Mexico and the Caribbean Sea to the Atlantic, there is not much difference between the figures in the upper section. However, in the lower section, the area in September 2005 appears yellow, and the same area in September 2004 appears light blue, indicating that the SST in September 2005 was approximately 2°C warmer than in September 2004.
The variation of rainfall is expected to increase, and the damage by the heavy rains of typhoons and hurricanes as well as by droughts will increase if global warming increases. Global warming may not be the sole cause of the frequent rainfall disasters in Japan in 2004 and the hurricane damage in the United States in 2005, therefore it is important to continue such global rainfall observation.
NASA had intended to terminate TRMM operation in 2005, but in September 2006, they decided to continue its operation until the end of September 2009. NASA and JAXA will continue to observe such meteorological damage worldwide and to acquire valuable data by TRMM satellite.
(*1)Tropical cyclones with maximum wind speeds exceeding 64 knots and which are generated in the northern and mid Pacific, the northeast Pacific and the northern Atlantic are called hurricanes. Please refer here for more information on the classification of tropical cyclones.
(*2)Hurricane category is an index indicating the extent of the potential damage that a hurricane can bring. The index divides hurricanes into categories 1 to 5 in strength, and is commonly used in the United States and other countries. Please refer here for more information on each category (Simpson's scale).
References:
 "Typhoon Statistics" Japan Meteorological Agency's home page (in Japanese) "Typhoon Statistics" Japan Meteorological Agency's home page (in Japanese)
The Most Intense Hurricanes in the United States 1851-2004 (NOAA, National Weather Service, National Hurricane Center / Tropical Prediction Center)
|
Explanation of the images:
(Figs. 1 to 3)
*3 TRMM is a joint mission between NASA, NICT and JAXA.
|
 |
|