| |
The La Niña event that we introduced in "AMSR-E observes La Niña" has ended.
On June 9, the Japan Meteorological Agency (JMA) announced that this La Niña event had ended this spring.
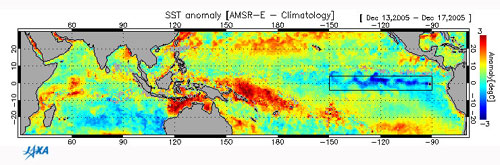 |
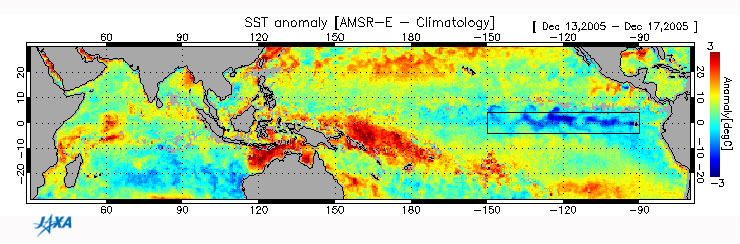
| Fig. 1 Deviation from 30-year average of sea-surface temperature, averaged over a five-day period (December 12 to December 17, 2005) |
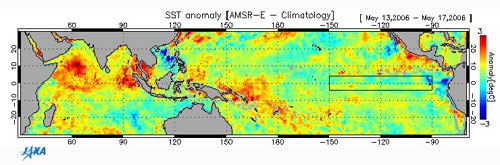 |
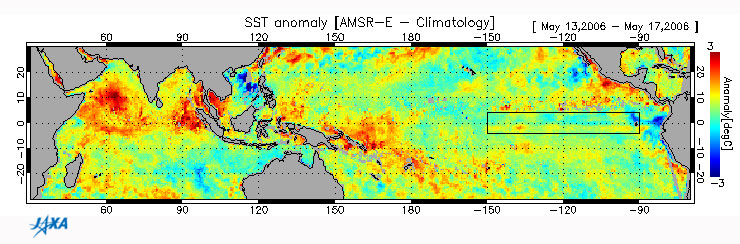
| Fig. 2 Deviation from 30-year average sea-surface temperature, averaged over a five-day period (May 12 to May 17, 2006) |
Figures 1 and 2 illustrate the deviation of the sea-surface temperature distribution (observed by AMSE-E) from the last 30-year average. In these figures, red areas are warmer than the average, and blue areas are colder. The black-edged area (90W-150W, 5N-5S) in these figures is the El Niño monitoring area from which JMA determines whether conditions constitute an El Niño, a La Niña, or neither. Figure 1 depicts a La Niña event on Dec 15, 2005. A deep-blue area spreads across the El Niño monitoring area, and a deep-red area extends from New Guinea Island to near Indonesia, so the color contrast is great. Figure 2 was acquired on May 15, 2006. There is little color contrast between the El Niño monitoring area and the west.
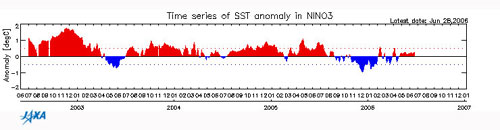 |
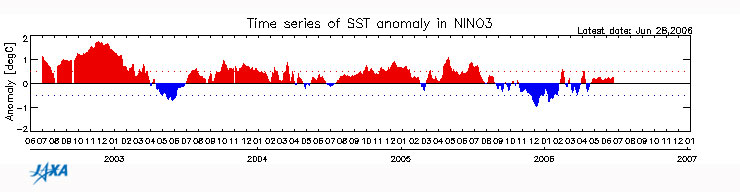
| Fig. 3 Deviation of sea-surface temperature in El Niño monitoring area. |
Figure 3 illustrates the deviation of the sea-surface temperature from the 30-year average in the El Niño monitoring area. Figure 3 corresponds to La Nina when the deviation tends toward the minus side (blue area) and to El Nino when it tends toward the plus side (red area). After May 2006, the blue area corresponding to this La Niña event had entirely disappeared.
Although an El Niño or a La Niña event is limited in eastern tropical pacific, it is known to influence the global climate. JMA has stated that a La Niña winter tends to be colder than normal.
JMA has also declared that one cause of low temperatures near Japan this winter is convection activation in western tropical pacific associated with a La Niña event. However, they didn't conclude that the La Nina event is the only cause of the cold winter because the climatological system is so complex that there is no simple cause-and-effect relationship. It's amazing that sea-surface variation over 10,000 km from here relates to the weather near Japan and to our daily lives.
JAXA will continue research and observation to solve the variation of Earth's environment with AMSR-E and other observation sensors. For the latest sea-surface information on the tropical Pacific Ocean and Indian Ocean, please visit our homepage "El Niño watch."
Explanation of the images:
(Fig. 1 to Fig. 3)
|
 |
|