| |
 |
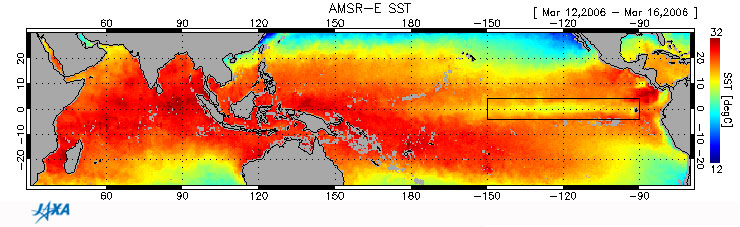
Figure 1. Five-day (March 12 to March 16, 2006) averaged distribution of sea surface temperature observed from AMSR-E
|
 |
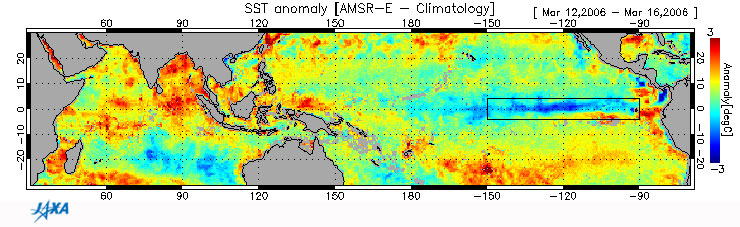
| Figure 2. Deviation from 30-year average sea-surface temperature, averaged over a 5-day period (March 12 to March 16, 2006) |
On March 10, the Japan Meteorological Agency (JMA) announced that the present condition of lower sea surface temperature than usual in the mid-eastern tropical Pacific was a good possibility of La Niña and this conditon would continue until spring. The last La Niña occurred during the summer of 1998 through the spring of 2000. If it is decided, it means that it was generated after an interval of six years.
La Niña is a phenomenon that the sea surface temperature in the eastern tropical Pacific continueously decreases to lower than the average. It is the counter-phenomena to El Niño and it is assumed that abnormal weather tends to occur all over the globe when they occur. In Japan when La Niña occurs, it seems to cause intense heat during the summer and a severe winter.
Figure 1 shows the distribution of sea surface temperature encompassing tropical India and Pacific as observed by AMSR-E (*1) installed on Aqua, a NASA earth observation satellite. The red area in Figure 1 is a high-temperature zone (32°C maximum) of the sea surface. The blue area is a low-temperature zone (12°C minimum). There are some high-temperature area with approximately 30°C in tropical India and western tropical Pacific.
Figure 2 illustrates the deviation of the sea-surface temperature distribution from the last 30 years average (observed by AMSE-E). The red area in Figure 2 is warmer than the average, and the blue area is colder than the average. There is a colder zone in the mid-eastern tropical Pacific.
The National Oceanic and Atmospheric Administration (NOAA) in the United States announced on February 2nd that the decrease in the sea surface temperature in the eastern tropical Pacific indicated of the forming of La Niña. The reason for the difference in content of these announcements is that the judgment sea areas and the judgement criteria are slightly different betweeen JMA and NOAA.
The judgment sea area of JMA is Niño 3 (5S-5N; 150W-90W), but that of NOAA is Niño 3.4 (5S-5N; 170W-120W) that veers almost half the size to the west compared with Niño 3. When the temperature deviation averaged over five months is less than -0.5°C for six consecutive months, JMA declares a La Niña event. NOAA defines La Niña as the condition whereby the Oceanic Niño Index (ONI) is less than or equal to -0.5°C. The ONI is the three-month running-mean values of sea surface temperature departures from average in the Niño 3.4 region.
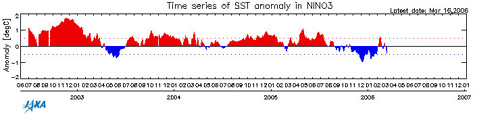 |
| Figure 3. Deviation of sea-surface temperature in Niño 3 monitored by AMSR-E (from July 2003 to March 2006) |
Figure 3 depicts the deviation of sea-surface temperature from the 30-year average in Niño 3. Figure 3 corresponds to La Niña when the deviation leads to a minus side (blue area) and corresponds to El Niño when it leads to the plus side (red area). A blue area that started in November, 2005 corresponds to this La Niña.
For the latest information on the water temperature of the tropical Pacific sea-surface, visit our homepage "El Niño watch."
Explanation of the images:
(Fig. 1 to Fig. 3 )
|
 |
Related sites:
 Release of new AMSR-E product "El Niño watch" Release of new AMSR-E product "El Niño watch"
2002-2003 El Niño Event Observed by AMSR-E
El Niño and La Niña event (JMA, in Japanese)
Appendix:
El Niño and La Niña:
El Niño and La Niña occur in relation to the variation of the strength of the easterly wind (trade wind) near the equator in the Pacific.
In the usual equatorial Pacific, the warm seawater in the surface is blown away to the west by the trade wind, stagnates in the western area (to be obstructed by the islands in the Philippines and in Indonesia) and creates the area with the world's highest sea surface temperature about 30 °C. On the other hand, the sea surface temperature in the eastern area decreses because the cold seawater wells up from the depths as compensating for the blown-away warm seawater in the surface.
When the easterly wind becomes stronger, warm seawater in the surface is forced away to the western area than usual and the eastern cold area stretches to the west. When the easterly wind weakens oppositely, the sea surface temperature in the eastern Pacific becomes higher than usual, because the tropical seawater is warmed by strong sunshine for a long time. The former condition that the easterly wind is stronger is La Niña, and the latter condition, which the eastern wind is weaker, is El Niño.
It is known that the normal difference between the sea-surface level in the western Pacific and in the eastern Pacific is about 20-30 cm because the water of sea-surface surges due to the easterly wind and raises the level of sea water in the west. When La Niña occurs, the difference becomes larger by the strength of the easterly wind.
The homepage of the European Space Organization (ESA) clarifies that the difference of the sea-surface level in the western Pacific and in the eastern Pacific has reached a maximum of about 60cm. This was observed, until the middle of February of this year, with the Radar Altimeter 2 (RA-2) installed on the earth observation satellite Envisat.
|
|